

Abstract
A novel assay using high pressure liquid chromatography (HPLC) coupled to mass spectrometer (MS) detection was developed and validated for the rifamycin anti-tuberculosis antibiotics rifampicin (RIF), rifabutin (RBT), rifapentine (RPT) and their active desacetyl metabolites (dRIF, dRBT and dRPT, respectively) in human plasma. The assay uses 50 μL of human plasma with a quick and simple protein-precipitation extraction to achieve a dynamic range of 75–30000 ng/mL for RIF, RBT and RPT and 37.5 to 15000 ng/mL for dRIF, dRBT and dRPT respectively. The average %CV and %deviation were less than 20% at the lower limit of quantitation and less than 15% over the range of the curve. The method was fully validated according to FDA criteria for bioanalytical assays and has successfully been used to support three large international tuberculosis trials.
Keywords: rifampin, rifabutin, rifapentine, bioanalysis, tuberculosis
Graphical abstract

1. Introduction
Tuberculosis is the second leading cause of mortality from an infectious agent globally. There were an estimated 8.6 million incident cases of tuberculosis and an estimated 1.3 million deaths from tuberculosis in 2012 (1). Although there have been 56 million people treated for tuberculosis since 1995, the global disease burden remains very large (1). Tuberculosis is a curable disease. Pharmacotherapy is the foundation of tuberculosis treatment and rifamycin antibiotics have been a mainstay of tuberculosis treatment since the 1970’s.
Rifampin (RIF), rifabutin (RBT), and rifapentine (RPT) are all first line options for treatment of active tuberculosis (2, 3). Typical initial treatment for tuberculosis includes a combination of isoniazid, rifampin, pyrazinamide and ethambutol. For individuals with the potential for drug-drug interactions, RBT may be substituted for RIF as RBT is a less potent inducer of cytochrome P450 (CYP) drug metabolizing enzymes (4, 5). The advantage of RPT lies in its longer plasma half-life compared with other rifamycin antibiotics: the half-life of RPT is 13 to 14 hours whereas the half-life of RIF is only 2 to 3 hours (4, 6).
Standard treatment for latent tuberculosis infection (LTBI) requires daily oral isoniazid therapy for nine months (7). Recently, three months of once weekly oral RPT was shown to be no less effective than the nine-month treatment with daily isoniazid for LTBI treatment (8). Currently RPT is indicated for the treatment of active TB disease, while it is recommended by the Centers for Disease Control and Prevention (CDC) for prophylaxis against active TB as part of a 12 week directly observed therapy (DOT) regimen (7, 9).
In 2012, 1.1 million of the 8.6 million new cases of TB were in HIV-infected individuals (1). Co-infection with HIV is associated with an increased level of morbidity and mortality from tuberculosis. In 2010 the World Health Organization (WHO) estimated there were 350,000 deaths in HIV-infected individuals related to TB (1). Currently there are numerous large trials investigating the treatment of both latent and active TB in HIV-infected individuals. For example, the AIDS Clinical Trials Group (ACTG) Study A5279 is an international trial of over 3000 individuals investigating a three-month short course treatment of LTBI with RPT and isoniazid compared with 9 months of daily isoniazid in HIV-infected individuals. ACTG Study A5290 is an international phase 2b study with 471 HIV-infected individuals with active TB. A5290 is enrolling subjects on either a RIF or RBT based TB regimen. While the primary endpoint of these studies is efficacy, there is a critical need to investigate possible drug-drug interactions that may arise when using rifamycin-based regimens in combination with antiretroviral therapy in HIV and TB co-infected individuals. Both A5279 and A5290, for example, have defined secondary analyses to investigate these possible drug-drug interactions. The pharmacokinetic analysis within these two studies dictated the necessity to develop a novel assay to accommodate patient samples with the ability to quantitate any of the rifamycin antibiotics: RIF, RBT or RPT. Herein we describe the development and validation of an LC/MS/MS assay to quantify simultaneously RIF, RBT, RPT and their active desacetyl metabolites in human plasma.
2. Methods and Materials
2.1 Chemicals and Reagents
RBT, dRBT and RIF were purchased from the United States Pharmacopeia (Rockville, MD). RPT and dRPT were provided by Sanofi-Aventis (Bridgewater, NJ). We purchased dRIF from the Toronto Research Company (North York, Ontario, Canada). Rifabutin-D6 (RBT-IS) and rifampin-D8 (RIF-IS) were purchased from Alsachim (Illkirich Graffenstaden, France). Acetonitrile (ACN) (HPLC grade), methanol (MeOH) (HPLC grade), formic acid (FA) (88%) and trifluoroacetic acid (TFA) (Optima grade) were purchased from Thermo Fisher Scientific (Fairlawn, NJ). Type I water (H2O) was produced in the laboratory using a Millipore MilliQ Integral 3 system. Human (K2EDTA) plasma was purchased from Innovative Research (Novi, MI).
2.2 Instrumentation
Analysis was performed using a Prominence integrated HPLC system (Shimadzu, Kyoto, Japan) consisting of two Shimadzu Prominence LC-20ADXR pumps, a Prominence SIL20ACXR auto-sampler, a Prominence CBM-20A controller and a CTO20AC column oven coupled to an API 5000 triple quadrupole mass spectrometer (Applied Biosystem/Sciex, Foster City, CA). The MS was operated in positive, multiple-reaction-monitoring mode with electrospray ionization. Data acquisition was performed with Analyst 1.5 software (Applied Biosystem/Sciex, Foster City, CA). Nitrogen was produced by a Parker Balston SF5500 gas generator system (Haverhill, MA).
2.3 Stock Solution and Standard (STD) Curve Preparation
RBT, RIF and RPT reference powders were weighed and diluted with the appropriate amount of methanol (corrected for impurities) to create 2.00 mg/mL primary stock solutions. Metabolites dRBT, dRIF and dRPT were similarly prepared at 1.00 mg/mL in methanol. Primary stock solutions were subsequently diluted in methanol to create an 8-point combined working spiking standard curve (2x) ranging from 150 – 60,000 ng/mL (RBT, RIF, RPT) and 75.0 – 30,000 ng/mL (dRBT, dRIF, dRPT). 25 μL of the working spiking STD is added to 50 μL of blank plasma to make the STD curve.
2.4 Quality Control (QC) Sample Preparation
QC samples were prepared by spiking stock solutions, made from unique weighings, into human (K2EDTA) plasma at concentrations of 225, 4,500, 24,000 ng/mL (RBT, RIF, RPT) and 112.5, 2,250, 12,000 ng/mL(dRBT, dRIF, dRPT). A separate lower limit of quantitation (LLOQ) sample was prepared to test sensitivity at 75.0 and 37.5 ng/mL for RBT, RIF, RPT and dRBT, dRIF, dRPT respectively. Additionally, a dilution QC sample was prepared at 90,000 and 45,000 ng/mL RBT, RIF, RPT and dRBT, dRIF, dRPT respectively. QC samples were split into polypropylene vials and stored at −80°C until needed.
2.5 Internal Standard Preparation
RBT-IS and RIF-IS reference powders were weighed and diluted with the appropriate amount of methanol (corrected for impurities) to create 1.00 mg/mL primary stock solutions. Primary stock solutions were subsequently diluted in methanol to make a working internal standard solution at concentrations of 400 and 1,000 ng/mL for RBT-IS and RIF-IS respectively. RBT-IS was paired with RBT and dRBT to track analyte extraction. RIF-IS was paired with RIF, dRIF, RPT and dRPT.
2.6 Clinical Sample Processing
Patient peripheral blood samples were collected by venipuncture into spray dried K2EDTA Vacutainer® tubes (Becton Dickinson) and centrifuged at 1200 × g for 10 min at 4°C. The plasma was removed and frozen at −70°C until shipment on dry ice to our analytical laboratory where the samples were stored at −80°C until analysis.
2.7 Extraction Procedure
Micro-centrifuge tubes (1.5 mL) were used for precipitating all samples. STD tubes were spiked with 25 μL of appropriate working spiking standard, 25 μL of working internal standard and 50 μL of blank plasma. 50 μL aliquots of unknown and QC samples were placed into tubes along with 25 μL of working internal standard and 25 μL of methanol. Blank samples were spiked with 50 μL of methanol and 50 μL of blank plasma. All tubes were vortexed prior to the addition of 150 μL of 0.1% precipitation solvent (TFA:ACN, 0.1/99.9). Samples were incubated at 5°C for at least 1 hour and then centrifuged at 13,000 × g for 20 minutes at 10°C. 100 μL of supernatant is transferred to a clean tube and diluted with 150 μL of type 1 water. Each sample was mixed and transferred to injection vials for LC-MS analysis.
2.8 LC and MS Conditions
Chromatographic separation was achieved using a 3 × 100 mm ACE®C18 column (Advanced Chromatography Technologies Ltd. Aberdeen, Scotland) stationary phase and FA:H2O:ACN (0.5:55:45, v/v/v) mobile phase. For the analysis of RIF, RPT, their desacetyl metabolites (dRIF, dRPT) and respective internal standards, 2 μL of extracted sample was injected onto the LC system with a mobile phase flow rate of 1.0 mL per minute. Analytical column temperature was maintained at 30°C. Acquisition time was 3.85 minutes and 60% of the total flow diverted to waste. RBT, dRBT, and RBT-IS were acquired under a separate injection. Injection volume for the RBT and dRBT injection was 1 μL with a 2.1 minute run time; LC conditions were identical to the RIF and RPT injection. MS conditions are shown in Supplemental Table 1.
2.9 Analytical Method Validation
Method validation was performed under standard operating procedures based upon the FDA “Guidance for Industry Bioanalytical Method Validation,” 2001 (10). Assessments performed in the validation included standard curve performance, intra and inter-day precision and accuracy (QC’s), sensitivity, dilution integrity, matrix effect, selectivity, analyte recovery and stability.
Intra and inter day precision and accuracy was assessed over 3 days with 6 replicates of samples at each QC level and at the LLOQ (Sensitivity). The accuracy of the QC’s was determined by the % deviation from the expected concentrations of the samples. Precision was determined by the coefficient of variation (%CV) of the analyzed QC’s. Dilution integrity was evaluated by preparing a QC above the highest standard and evaluating the accuracy of 3 separate dilution factors.
Matrix effect (ME) was determined utilizing a method adapted from work by Matuszewski et al (11) where unweighted linear regression slopes were generated for each of 6 lots of plasma at the QC concentrations. The %CV was calculated for the 6 slopes and %CV less than 5 were considered acceptable. Recovery % was determined by comparing extracted samples to samples spiked post extraction at each of the QC concentration levels. Selectivity was assessed by comparing six different lots of blank plasma with and without spiked analyte. Additionally, a blank sample was spiked with a cocktail of antiretroviral drugs (tenofovir, emtricitabine, abacavir, lamivudine, atazanavir, darunavir, lopinavir, ritonavir, efavirenz, nevirapine, raltegravir, etravirine) along with commonly used anti-tuberculosis drugs (isoniazid, ethambutol, pyrazinamide) to assess for interference within the method from these other exogenous compounds.
Freeze and thaw (F/T) stability was demonstrated by cycling QC samples at the low and high concentration levels three times for at least 6 hours at room temperature and 12 hours at −80°C. Room temperature stability was assessed by removing QC samples from the freezer and storing them on the bench-top overnight for approximately 24 hours. Post-preparative stability QC samples were extracted and stored in the auto-sampler for 72 hours. All stability samples were compared to freshly extracted QC samples (Quality Control Samples) and a % difference was calculated. Freshly weighed and diluted primary stock solutions were compared to stored primary stock solutions at −80°C and also to aliquots stored at room temperature for 19 hours at low and high working standard concentrations (STD Stock).
Incurred sample reproducibility (ISR) was assessed after several patient samples had been evaluated. ISR was not conducted as a part of validation, rather as a tool to evaluate the consistency of the method and stability of patient samples under extraction conditions. ISR acceptance criteria have been debated by multiple groups (12, 13). For the purposes of this evaluation a comparison of the difference in two assayed values divided by the mean of the values was chosen (12). An acceptance threshold of 20% was used and 2/3 of all re-assayed ISR samples had to meet this criteria.
3. Validation Results
3.1 Calibration Curve and Concentration Determination
A weighted linear regression curve (1/x2) was determined to best represent the concentration vs detector response relationship for RBT, dRBT, RIF, dRIF, RPT and dRPT in human plasma. Detector response was the ratio of analyte/internal standard peak area counts. The LLOQ was set at the lowest non-zero standard. Back-calculated calibration curve standard concentrations and their parameters representing 3 days of curve points run in duplicate are shown in Table 1. Predetermined acceptance criteria of less than 20% at the LLOQ and 15% at the other concentrations were met.
Table 1.
Inter-Day Standard Calibration Curve Results and Parameters
| STD Analyte | Parameter | STD 1 | STD 2 | STD 3 | STD 4 | STD 5 | STD 6 | STD 7 | STD 8 | Slope | y-Int | R |
|---|---|---|---|---|---|---|---|---|---|---|---|---|
| RBT | Conc. | 75.0 | 150 | 300 | 1500 | 7500 | 15000 | 25500 | 30000 | |||
| Mean | 74.3 | 150 | 306 | 1581 | 7725 | 14991 | 24681 | 28056 | 0.00157 | 0.00635 | 0.9985 | |
| %CV | 2.9 | 5.2 | 2.8 | 3.5 | 1.8 | 1.6 | 1.7 | 3.9 | ||||
| %Dev | −0.9 | 0.3 | 2.0 | 5.4 | 3.0 | −0.1 | −3.2 | −6.5 | ||||
| n | 6 | 6 | 6 | 6 | 6 | 6 | 6 | 6 | 3 | 3 | 3 | |
|
| ||||||||||||
| dRBT | Conc. | 37.5 | 75.0 | 150 | 750 | 3750 | 7500 | 12750 | 15000 | |||
| Mean | 36.6 | 76.1 | 158 | 812 | 3927 | 7423 | 11903 | 13564 | 0.0109 | 0.00620 | 0.9970 | |
| %CV | 3.6 | 3.7 | 3.2 | 2.6 | 3.3 | 2.1 | 2.5 | 4.0 | ||||
| %Dev | −2.4 | 1.4 | 5.2 | 8.3 | 4.7 | −1.0 | −6.6 | −9.6 | ||||
| n | 6 | 6 | 6 | 6 | 6 | 6 | 6 | 6 | 3 | 3 | 3 | |
|
| ||||||||||||
| RIF | Conc. | 75.0 | 150 | 300 | 1500 | 7500 | 15000 | 25500 | 30000 | |||
| Mean | 74.9 | 149 | 303 | 1572 | 7713 | 15156 | 24681 | 28343 | 0.00239 | 0.00658 | 0.9980 | |
| %CV | 4.4 | 4.2 | 5.3 | 5.4 | 5.0 | 4.1 | 4.5 | 4.4 | ||||
| %Dev | −0.1 | −0.7 | 0.9 | 4.8 | 2.8 | 1.0 | −3.2 | −5.5 | ||||
| n | 6 | 6 | 6 | 6 | 6 | 6 | 6 | 6 | 3 | 3 | 3 | |
|
| ||||||||||||
| dRIF | Conc. | 37.5 | 75.0 | 150 | 750 | 3750 | 7500 | 12750 | 15000 | |||
| Mean | 37.8 | 73.8 | 150 | 742 | 3847 | 7711 | 12839 | 14385 | 0.00219 | 0.00398 | 0.9989 | |
| %CV | 4.4 | 2.7 | 4.9 | 3.6 | 1.9 | 2.2 | 3.0 | 4.2 | ||||
| %Dev | 0.9 | −1.6 | −0.2 | −1.1 | 2.6 | 2.8 | 0.7 | −4.1 | ||||
| n | 6 | 6 | 6 | 6 | 6 | 6 | 6 | 6 | 3 | 3 | 3 | |
|
| ||||||||||||
| RPT | Conc. | 75.0 | 150 | 300 | 1500 | 7500 | 15000 | 25500 | 30000 | |||
| Mean | 75.5 | 148 | 298 | 1553 | 7700 | 15113 | 25211 | 28678 | 0.00435 | −0.00279 | 0.9983 | |
| %CV | 3.9 | 4.6 | 5.0 | 5.9 | 3.1 | 5.6 | 4.0 | 4.9 | ||||
| %Dev | −4.4 | −1.1 | 0.8 | 2.7 | 3.5 | −0.6 | −1.5 | 0.7 | ||||
| n | 6 | 6 | 6 | 6 | 6 | 6 | 6 | 6 | 3 | 3 | 3 | |
|
| ||||||||||||
| dRPT | Conc. | 37.5 | 75.0 | 150 | 750 | 3750 | 7500 | 12750 | 15000 | |||
| Mean | 37.9 | 73.6 | 148 | 756 | 3865 | 7688 | 12622 | 14498 | 0.00285 | 0.00231 | 0.9981 | |
| %CV | 5.6 | 4.3 | 5.1 | 5.1 | 4.0 | 5.1 | 6.3 | 4.9 | ||||
| %Dev | 1.2 | −1.8 | −1.4 | 0.8 | 3.1 | 2.5 | −1.0 | −3.3 | ||||
| n | 6 | 6 | 6 | 6 | 6 | 6 | 6 | 6 | 3 | 3 | 3 | |
Rifabutin (RBT), desacetylrifabutin (dRBT), rifampin (RIF), desacetylrifampin (dRIF), rifapentine (RPT), desacetylrifapentine (dRPT).
3.2 Precision, Accuracy and Sensitivity
Acceptable levels of precision and accuracy were set at less than 15% CV and less than 15% deviation from theoretical concentrations at the low medium and high QC levels. No analyte had a %CV greater than 5.8 or a % deviation greater than 10.0. Sensitivity acceptance was set at less than 20% CV and less than 20% deviation from theoretical concentrations at the LLOQ. Each analyte had a %CV less than or equal to 10.7 or a % deviation less than or equal to 7.8. Precision and accuracy results are displayed in Table 2.
Table 2.
Inter-Intra Batch Precision and Accuracy
| Analyte Conc. | Level ng/mL | LLOQ 75.0 |
Low 225 |
Med 4500 |
High 24000 |
LLOQ 37.5 |
Low 112.5 |
Med 2250 |
High 12000 |
|
|---|---|---|---|---|---|---|---|---|---|---|
| RBT | Mean | 71.4 | 235 | 4761 | 23030 | dRBT | 35.0 | 121 | 2476 | 11228 |
| %CV | 10.7 | 5.8 | 4.5 | 3.0 | 6.2 | 5.0 | 3.4 | 2.5 | ||
| %Dev | −4.8 | 4.6 | 5.8 | −4.0 | −6.5 | 7.2 | 10.0 | −6.4 | ||
| n | 18 | 17 | 18 | 18 | 17 | 18 | 18 | 18 | ||
| RIF | Mean | 79.0 | 242 | 4809 | 23872 | dRIF | 39.2 | 119 | 2350 | 12591 |
| %CV | 5.0 | 3.8 | 3.7 | 1.8 | 3.4 | 4.8 | 5.0 | 3.1 | ||
| %Dev | 5.3 | 7.5 | 6.9 | −0.5 | 4.6 | 6.0 | 4.5 | 4.9 | ||
| n | 18 | 17 | 18 | 18 | 17 | 18 | 18 | 18 | ||
| RPT | Mean | 76.0 | 234 | 4646 | 24012 | dRPT | 40.4 | 122 | 2395 | 12245 |
| %CV | 3.3 | 3.8 | 3.3 | 2.8 | 3.7 | 4.3 | 3.5 | 2.2 | ||
| %Dev | 1.4 | 3.9 | 3.3 | 0.1 | 7.8 | 8.9 | 6.5 | 2.0 | ||
| n | 18 | 18 | 18 | 18 | 18 | 17 | 18 | 18 | ||
|
| ||||||||||
| RBT | Mean | 66.9–80.5 | 225–254 | 4571–4846 | 22467–23420 | dRBT | 32.5–37.3 | 118–127 | 2424–2507 | 11051–11398 |
| %CV | 2.7–7.7 | 2.7–5.4 | 2.2–4.7 | 2.2–2.7 | 2.3–5.0 | 1.8–5.2 | 1.7–10.9 | 1.7–3.2 | ||
| %Dev | −10.9–7.4 | 0.0–12.9 | 1.6–8.2 | −6.4–(−2.4) | −13.4–(−0.4) | 4.6–12.5 | 7.7–11.4 | −7.9(−5.0) | ||
| n | 3 | 3 | 3 | 3 | 3 | 3 | 3 | 3 | ||
| RIF | Mean | 75.6–81.6 | 237–254 | 4665–4944 | 23656–24275 | dRIF | 39.2–40.1 | 114–126 | 2235–2447 | 12378–13006 |
| %CV | 2.4–5.0 | 1.8–3.3 | 1.2–4.0 | 0.7–1.6 | 2.1–7.9 | 0.4–4.0 | 2.5–4.6 | 1.6–2.3 | ||
| %Dev | 0.8–8.7 | 5.4–13.1 | 3.7–9.9 | −1.4–1.1 | 4.6–7.0 | 1.7–11.9 | −0.7–8.8 | 3.2–8.4 | ||
| n | 3 | 3 | 3 | 3 | 3 | 3 | 3 | 3 | ||
| RPT | Mean | 74.1–77.8 | 229–241 | 4574–4757 | 23446–24809 | dRPT | 39.7–41.6 | 119–128 | 2331–2463 | 12040–12354 |
| %CV | 1.9–3.5 | 2.1–3.8 | 1.7–4.6 | 0.9–1.5 | 1.4–4.8 | 1.6–4.3 | 1.7–4.0 | 1.0–2.8 | ||
| %Dev | −1.2–3.7 | 1.7–7.2 | 1.6–5.7 | −2.3–3.4 | 6.0–10.9 | 5.7–13.7 | 3.6–9.5 | 0.3–2.9 | ||
| n | 3 | 3 | 3 | 3 | 3 | 3 | 3 | 3 | ||
Rifabutin (RBT), desacetylrifabutin (dRBT), rifampin (RIF), desacetylrifampin (dRIF), rifapentine (RPT), desacetylrifapentine (dRPT).
3.3 Dilution Integrity
The 90,000/45,000 (RBT, RIF, RPT/dRBT, dRIF, dRPT) ng/mL QC sample was diluted by factors of 5, 10 and 20. A % deviation of less than 15 and %CV less than 15 was considered acceptable for effective dilution techniques. No analyte had a %CV greater than 9.1 or a % deviation greater than 8.1. Dilution integrity results are displayed in Supplemental Table 2.
3.4 Matrix Effect and Recovery
The %CV when comparing the slopes of analyte response at 3 concentrations through six different lots of human K2EDTA plasma were all less than 2.9% indicating a lack of significant matrix effect. Recovery for each analyte was greater than 86.4% demonstrating no significant loss of analyte due to the protein precipitation. Matrix effect and recovery results are displayed in Table 3.
Table 3.
Recovery and Matrix Effects
| Analyte Conc. | Recovery % | ME Slope CV% | ||
|---|---|---|---|---|
| Low | Med | High | ||
| RBT | 95.3 | 92.1 | 92.1 | 2.9 |
| dRBT | 96.4 | 99.2 | 102 | 2.5 |
| RBT-IS | N/A | 95.9 | N/A | N/A |
| RIF | 98.8 | 98.5 | 104 | 2.5 |
| dRIF | 90.7 | 86.4 | 89.9 | 1.5 |
| RIF-IS | N/A | 99.0 | N/A | N/A |
| RPT | 93.3 | 93.5 | 98.3 | 1.6 |
| dRPT | 99.5 | 96.9 | 99.8 | 1.2 |
Rifabutin (RBT), desacetylrifabutin (dRBT), rifampin (RIF), desacetylrifampin (dRIF), rifapentine (RPT), desacetylrifapentine (dRPT).
3.5 Selectivity
A typical blank sample for RBT, RIF and RPT is shown with typical LLOQ samples in Figure 1, Figure 2 and Figure 3, respectively. No endogenous interference was observed in any of the six lots screened at the retention time of any analyte at the respective transitions used. Internal standard transitions were also free from interference. A blank plasma sample spiked with the cocktail of antiretroviral drugs and anti-tubercular antibiotics was shown to be free from interference at the retention times of the analytes of interest.
Figure 1.

RBT LLOQ (1a.), RBT Blank (1b.), dRBT LLOQ (1c.) and dRBT Blank (1d.).
Figure 2.
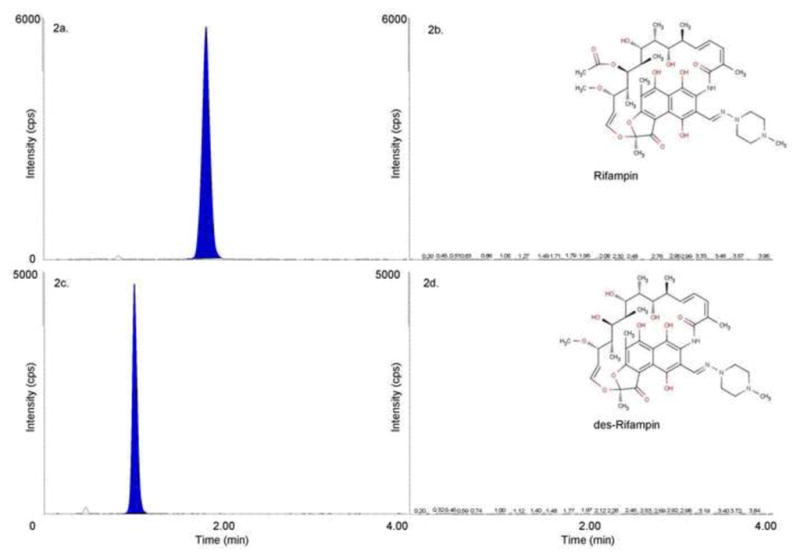
RIF LLOQ (2a.), RIF Blank (2b.), dRIF LLOQ (2c.) and dRIF Blank (2d.).
Figure 3.

RPT LLOQ (3a.), RPT Blank (3b.), dRPT LLOQ (3c.) and dRPT Blank (3d.).
3.6 Stability
All stability conditions tested had an acceptance criterion of less than 15% difference from control samples. F/T cycled quality control samples demonstrated an absolute % difference from controls of less than 5.6% for all analytes. RT incubated quality control samples demonstrated an absolute % difference from controls of less than 7.8% for all analytes. Clinical samples may be frozen and thawed up to 3 times and left at room temperature for less than 24 hours with no significant change in concentrations. Fresh working standard solutions were prepared from primary stocks and compared to working standards that were used throughout the validation. No response differed by more than 3.6% at either the high or low concentration levels. Stability results are displayed in Table 4.
Table 4.
Stability (% difference) of Analytes When Compared to Control Samples
| Condition | Analyte Conc. | RBT | dRBT | RIF | dRIF | RPT | dRPT | ||||||
|---|---|---|---|---|---|---|---|---|---|---|---|---|---|
| Low | High | Low | High | Low | High | Low | High | Low | High | Low | High | ||
| F/T | −0.1 | 1.7 | 0.8 | −1.3 | −0.9 | 0.5 | −1.8 | 1.9 | 0.5 | 3.6 | −5.6 | −1.4 | |
| RT | −0.9 | 4.9 | −0.1 | 3.7 | 6.8 | 5.3 | 3.5 | 7.9 | 5.2 | 3.5 | −1.0 | 1.8 | |
| PPS | −4.4 | −1.7 | 0.4 | −4.3 | 0.4 | −0.1 | −0.9 | −0.5 | 0.8 | 1.5 | −1.4 | 0.8 | |
| STD Stock | 3.3 | −0.7 | 2.4 | 3.4 | 1.6 | 2.1 | 3.0 | 1.2 | 1.6 | 3.6 | 0.8 | 2.7 | |
Rifabutin (RBT), desacetylrifabutin (dRBT), rifampin (RIF), desacetylrifampin (dRIF), rifapentine (RPT), desacetylrifapentine (dRPT).
3.7 Incurred Sample Reproducibility
ISR evaluations for RBT, RIF and RPT from clinical patients met acceptance criteria and are available in Supplemental Table 3. Samples originally evaluated below the limit of quantitation repeated as such. One sample evaluated for dRPT was originally near the upper limit of quantitation and above the limit of quantitation (ALQ) upon re-analysis. As the sum of the ISR data met acceptance criteria, a repeat analysis with a dilution factor was determined to be unnecessary.
4.0 Discussion
Clinical investigations and comparisons of rifamycin anti-tubercular antibiotics necessitate an analytical assay to simultaneously extract RIF, RBT and RPT and their desacetyl metabolites for direct injection onto LC/MS/MS. Currently there is no such method found in the literature. Of the MS based detection methods in the literature only one describes a combined assay for either RIF, RBT or RPT. Mueller et al describe an LC/MS assay for RIF and dRIF along with RBT, that utilizes solid phase extraction (SPE) coupled to MS detection (14). Our methodology is novel because it includes all three of the commercially used anti-tubercular rifamycins (RIF, RBT, RPT) and their active desacetyl metabolites, utilizes MS detection and with the addition of isotopically labeled internal standards is rapid and robust. The sample extraction procedure utilizes a quick deproteination procedure with acidified acetonitrile allowing for high sample through-put.
Chromatographic conditions necessitated two separate injections for the analysis. During method development it was noted that RBT and dRBT standard curve linearity was not regularly maintained with a concurrent injection with RIF and RPT. Investigations to correct issues with RBT standard curve linearity lead to the discovery that instrument sensitivity was promoting flattening detector response at high concentration points in the standard curve. Initially, changes in collision energy were investigated as an approach to decrease detector response in an attempt to correct issues with RBT standard curve linearity. A second approach of a reduced injection volume, while maintaining instrument optimization, was a more robust solution and remedied issues with standard curve linearity. To preserve the sensitivity of RIF, dRIF, RPT and dRPT it was decided to inject RBT and dRBT at a lower injection volume within a separate injection onto the LC-MS/MS.
Previous literature reports have been mixed regarding the stability of RIF. Earlier reports have detailed instability of RIF to both light and heat (15–19). Ascorbic acid has been found to be a useful additive for the prevention of RIF oxidation thus improving its stability (15, 16). During our method development process we conducted heat inactivation experiments at 58° C for one hour and found RIF instability results similar to those described by others. We investigated issues of RIF instability further and found minimal changes in RIF concentrations at 24 hours of bench-top exposure in ambient light conditions (Table. 4). Our sample processing does not include a heat inactivation step; for this reason, we chose not to include the addition of ascorbic acid in our sample processing. Further testing with both post-preparative stability samples and incurred sample reproducibility validated the stability of both the quality control and unknown samples we have analyzed with this method in our laboratory.
To date we have employed the method to analyze 547 samples from patients enrolled in clinical trials investigating the treatment of latent and active tuberculosis. Patient derived data are summarized in Table 5. These patient data are highly comparable with previously reported literature values for these analytes. The assay has had a 100% batch pass rate. This assay has the added feasibility of simultaneously extracting patient derived samples containing RIF, RBT or RPT for routine analysis. The method can be used as a tool for investigating pharmacokinetic and pharmacodynamic characteristics of novel rifamycin-containing drug combinations and therapeutic strategies for tuberculosis infected individuals.
Table 5.
Concentration of Rifamycin Antibiotics in Human Plasma Patient Derived Samples
| Analyte | (n) | Oral Dose (mg) | Time (average hours post dose) | Conc. ng/mL (Median, IQR) |
|---|---|---|---|---|
| RIF | 10 | 600 | 9.5 | 5,472 (981 – 6,587) |
| dRIF | 5 | - | 9.5 | 1,070 (92.3 – 1,420) |
| RBT | 24 | 150 | 10.8 | 232 (192 – 378) |
| dRBT | 24 | - | 10.8 | 173 (84.0 – 232) |
| RPT | 242 | ~10 mg/kg | 13.8 | 11,471 (6,750 – 16,742) |
| dRPT | 242 | - | 13.8 | 8,969 (5,337 – 14,925) |
Rifabutin (RBT), desacetylrifabutin (dRBT), rifampin (RIF), desacetylrifampin (dRIF), rifapentine (RPT), desacetylrifapentine (dRPT).
Supplementary Material
Highlights.
Validated simultaneous LC/MS assay for rifabutin, rifampin and rifapentine
High clinical utility to support pharmacokinetic and drug-drug interaction studies
Rugged and efficient method for rifamycin antibiotics, 100% batch success rate
Acknowledgments
This work was supported by UM1AI06701 and P01 AI074340 (both to C.V.F.) from the National Institutes of Allergy and Infectious Diseases. The authors thank Timothy Mykris and John Weinhold for their assistance in validation of the assay and routine sample analysis.
Footnotes
Publisher's Disclaimer: This is a PDF file of an unedited manuscript that has been accepted for publication. As a service to our customers we are providing this early version of the manuscript. The manuscript will undergo copyediting, typesetting, and review of the resulting proof before it is published in its final citable form. Please note that during the production process errors may be discovered which could affect the content, and all legal disclaimers that apply to the journal pertain.
References
- 1.World Health Organization (WHO) Global tuberculosis report 2013 2013 [Google Scholar]
- 2.Blumberg H, Burman W, Chaisson R, Daley C, Etkind S, Friedman L, Fujiwara P, Grzemska M, Hopewell P, Iseman M. American Thoracic Society/Centers for Disease Control and Prevention/Infectious Diseases Society of America: treatment of tuberculosis. American Journal of Respiratory and Critical Care Medicine. 2003;167:603. doi: 10.1164/rccm.167.4.603. [DOI] [PubMed] [Google Scholar]
- 3.Treatment of tuberculosis: guidelines. World Health Organization; 2010. Stop TB Initiative. [PubMed] [Google Scholar]
- 4.Burman WJ, Gallicano K, Peloquin C. Comparative pharmacokinetics and pharmacodynamics of the rifamycin antibacterials. Clinical Pharmacokinetics. 2001;40:327–41. doi: 10.2165/00003088-200140050-00002. [DOI] [PubMed] [Google Scholar]
- 5.Perucca E, Grimaldi R, Frigo G, Sardi A, Mönig H, Ohnhaus E. Comparative effects of rifabutin and rifampicin on hepatic microsomal enzyme activity in normal subjects. European Journal of Clinical Pharmacology. 1988;34:595–99. doi: 10.1007/BF00615223. [DOI] [PubMed] [Google Scholar]
- 6.Keung AC-F, Owens RC, Eller MG, Weir SJ, Nicolau DP, Nightingale CH. Pharmacokinetics of rifapentine in subjects seropositive for the human immunodeficiency virus: a phase I study. Antimicrobial Agents and Chemotherapy. 1999;43:1230–33. doi: 10.1128/aac.43.5.1230. [DOI] [PMC free article] [PubMed] [Google Scholar]
- 7.Jereb J, Goldberg S, Powell K, Villarino E, LoBue P. Recommendations for use of an Isoniazid-Rifapentine regimen with direct observation to treat latent Mycobacterium tuberculosis Infection. MMWR Morb Mortal Wkly Rep. 2011;60:1650–53. [PubMed] [Google Scholar]
- 8.Sterling TR, Villarino ME, Borisov AS, Shang N, Gordin F, Bliven-Sizemore E, Hackman J, Hamilton CD, Menzies D, Kerrigan A. Three months of rifapentine and isoniazid for latent tuberculosis infection. New England Journal of Medicine. 2011;365:2155–66. doi: 10.1056/NEJMoa1104875. [DOI] [PubMed] [Google Scholar]
- 9.Luetkemeyer AF, Rosenkranz SL, Lu D, Marzan F, Ive P, Hogg E, Swindells S, Benson CA, Grinsztejn B, Sanne IM. Relationship between weight, efavirenz exposure, and virologic suppression in HIV-infected patients on rifampin-based tuberculosis treatment in the AIDS Clinical Trials Group A5221 STRIDE Study. Clinical Infectious Diseases. 2013;57:586–93. doi: 10.1093/cid/cit246. [DOI] [PMC free article] [PubMed] [Google Scholar]
- 10.U.S. Food and Drug Administration (FDA) Guidance for Industry. Bioanalytical Methods Validation. 2001 http://www.fda.gov/cder/guidance/4252fnl.htm.
- 11.Matuszewski B, Constanzer M, Chavez-Eng C. Strategies for the assessment of matrix effect in quantitative bioanalytical methods based on HPLC-MS/MS. Analytical Chemistry. 2003;75:3019–30. doi: 10.1021/ac020361s. [DOI] [PubMed] [Google Scholar]
- 12.Fast DM, Kelley M, Viswanathan C, O’Shaughnessy J, King SP, Chaudhary A, Weiner R, DeStefano AJ, Tang D. Workshop report and follow-up—AAPS workshop on current topics in GLP bioanalysis: assay reproducibility for incurred samples—implications of Crystal City recommendations. The AAPS journal. 2009;11:238–41. doi: 10.1208/s12248-009-9100-9. [DOI] [PMC free article] [PubMed] [Google Scholar]
- 13.Timmerman P, Luedtke S, van Amsterdam P, Brudny-Kloeppel M, Lausecker B, Fischmann S, Globig S, Sennbro C-J, Jansat JM, Mulder H. Incurred sample reproducibility: views and recommendations by the European Bioanalysis Forum. Bioanalysis. 2009;1:1049–56. doi: 10.4155/bio.09.108. [DOI] [PubMed] [Google Scholar]
- 14.Mueller D, Gutteck U, Rentsch K. Quantification of Ethambutol, Isoniazid, Pyrazinamide, Rifabutin and Rifampicin in Serum using LC-MS/MS. Therapeutic Drug Monitoring. 2011;33:522–22. [Google Scholar]
- 15.Balbão MS, Bertucci C, Bergamaschi MM, Queiroz RHC, Malfará WR, Dreossi SAC, de Paula Mello L, Queiroz MEC. Rifampicin determination in plasma by stir bar-sorptive extraction and liquid chromatography. Journal of pharmaceutical and biomedical analysis. 2010;51:1078–83. doi: 10.1016/j.jpba.2009.11.001. [DOI] [PubMed] [Google Scholar]
- 16.Fox D, O’Connor R, Mallon P, McMahon G. Simultaneous determination of efavirenz, rifampicin and its metabolite desacetyl rifampicin levels in human plasma. Journal of pharmaceutical and biomedical analysis. 2011;56:785–91. doi: 10.1016/j.jpba.2011.07.041. [DOI] [PubMed] [Google Scholar]
- 17.Hartkoorn RC, Khoo S, Back DJ, Tjia JF, Waitt CJ, Chaponda M, Davies G, Ardrey A, Ashleigh S, Ward SA. A rapid and sensitive HPLC–MS method for the detection of plasma and cellular rifampicin. Journal of Chromatography B. 2007;857:76–82. doi: 10.1016/j.jchromb.2007.07.005. [DOI] [PubMed] [Google Scholar]
- 18.Srivastava A, Waterhouse D, Ardrey A, Ward SA. Quantification of rifampicin in human plasma and cerebrospinal fluid by a highly sensitive and rapid liquid chromatographic–tandem mass spectrometric method. Journal of pharmaceutical and biomedical analysis. 2012;70:523–28. doi: 10.1016/j.jpba.2012.05.028. [DOI] [PMC free article] [PubMed] [Google Scholar]
- 19.Le Guellec C, Gaudet M-L, Lamanetre S, Breteau M. Stability of rifampin in plasma: consequences for therapeutic monitoring and pharmacokinetic studies. Therapeutic drug monitoring. 1997;19:669–74. doi: 10.1097/00007691-199712000-00011. [DOI] [PubMed] [Google Scholar]
Associated Data
This section collects any data citations, data availability statements, or supplementary materials included in this article.