

Abstract
The distal serpin subcluster contains genes encoding α1-antichymotrypsin (ACT), protein C inhibitor (PCI), kallistatin (KAL), and the KAL-like protein that are expressed in hepatocytes but only the act gene is expressed in astrocytes. We show here that the tissue-specific expression of these genes associates with astrocyte- and hepatocyte-specific chromatin structures. In hepatocytes, we identified twelve DNase I-hypersenitive sites (DHS) that were distributed throughout the entire subcluster, with the promoters of expressed genes accessible to restriction enzyme digestion. In astrocytes, only six DHSs were located exclusively in the 5′ flanking region of the act gene, with its promoter also accessible to restriction enzyme digestion. The acetylation of histone H3 and H4 has been found throughout the subcluster in both cell types but this acetylation did not correlate with the expression pattern of these serpin genes. Analysis of histone modifications at the promoters of the act and pci genes revealed that methylation of histone H3 on lysine 4 correlates with their expression pattern in both cells types. In addition, inhibition of methyltransferase activity resulted in suppression of ACT and PCI mRNA expression. We propose that lysine 4 methylation of histone H3 correlates with the tissue-specific expression pattern of these serpin genes.
Keywords: astrocytes, serpin, α1-antichymotrypsin, chromatin, tissue-specific
INTRODUCTION
The tissue-specific expression of individual genes in mammalian cells depends upon a variety of trans-activating nuclear factors that interact with a mosaic of cis-acting regulatory elements. These factors are necessary for the remodeling of chromatin, the formation of preinitiation complexes, and the subsequent transcription of the target genes. Therefore, the expression of a discrete set of tissue-specific factors in a given cell type determines the cell’s expression profile.
A cluster of human genes encoding eleven members of the serine proteinase inhibitor (serpin) family has been mapped to an approximately 370 kb region of chromosome 14q32.1 (Rollini and Fournier 1997; Namciu et al. 2004). In fact, two serpin subclusters containing six genes were originally described but recently five new serpin genes were identified (Namciu et al. 2004). The proximal subcluster contains the genes encoding corticosteroid binding globulin, α1-antitrypsin and the antitrypsin-related pseudogene whereas the genes coding for α1-antichymotrypsin (ACT), protein C inhibitor (PCI), kallistatin (KAL), and the KAL-like protein are located within the distal subcluster. Interestingly, every gene located within these two subclusters is expressed in hepatocytes, with hepatocyte nuclear factor-1 (HNF-1) and HNF-4 both being critical, but not sufficient for the expression of genes located in the proximal subcluster (Rollini and Fournier 1999a). In addition to hepatic expression, some of these genes are also expressed in other tissues. For example, the pci gene which encodes a protein whose main function is inhibition of activated protein C, is expressed in kidney, prostate, testis, seminal vesicles, and epididymal glands (Suzuki and Hayashi 2000). Kallistatin, an important inhibitor of kallikrein, is expressed in platelets, neutrophils, lymphocytes, monocytes, and endothelial cells; whereas the act gene is expressed in lung epithelium, brain astrocytes, and brain endothelium (Chai et al. 1994) (Cichy et al. 1995) (Pasternack et al. 1989). While the expression pattern of these genes is known in various tissues, the molecular mechanisms controlling the expression of individual serpin genes in extra-hepatic tissues are not understood.
In the central nervous system, astrocytes are the primary source of ACT, and ACT expression is upregulated by IL-1, tumor necrosis factor α (TNF), oncostatin M (OSM), and IL-6/soluble IL-6R complexes in these cells (Das and Potter 1995; Kordula et al. 1998; Kordula et al. 2000). The transcription of ACT is significantly upregulated in the affected brain regions of Alzheimer’s disease patients, and this serpin has been shown to be one of the amyloid-associated factors found in the β-amyloid (βAP) plaques of Alzheimer’s disease patients (Abraham et al. 1988; Pasternack et al. 1989). In addition, depending on the ratio of ACT to βAP, ACT either stimulates the formation of βAP fibrils or destabilizes preformed fibrillar forms of βAP in vitro (Fraser et al. 1993; Ma et al. 1994). Recently, ACT was shown to enhance formation of βAP deposits in a double transgenic mouse model of Alzheimer’s disease, indicating that the enhanced expression of this serpin may be one of the pathological factors contributing to the development of Alzheimer’s disease (Nilsson et al. 2001).
The pathological consequences of enhanced ACT expression in Alzheimer’s disease make the elucidation of the mechanisms controlling their astrocyte-specific expression critical.
MATERIALS AND METHODS
Cell culture
Human cortical astrocyte cultures were established exactly as described previously (Kordula et al. 1998). Human hepatoma HepG2, astrocytoma U373-MG and cervical carcinoma HeLa cells were obtained from American Type Culture Collection (Rockville, MD) and grown in Dulbecco’s modified Eagle’s medium supplemented with 10% fetal calf serum, antibiotics, sodium pyruvate, and non-essential amino acids.
Cytokines and cell stimulation
Cells were stimulated with 25 ng/ml OSM, 5 ng/ml TNFα, 50 ng/ml IL-6 (all from R&D, Systems, Inc., Minneapolis, MN), 10 ng/ml PMA, 40 mM AdOx (both from Sigma, Chemical Co., St. Louis, MO) or 10 ng/ml IL-1 (a gift from Immunex Corp., Seattle, WA). One μM dexamethasone (Sigma Chemical Co., St. Louis, MO) was also added to enhance cytokine action.
RNA preparation and Northern blot analysis
Total RNA was prepared using the phenol extraction method. Briefly, cells were lysed directly in 10 cm dishes with 850 μl of lysis buffer containing 50 mM Tris pH 8.0, 2% SDS, 1% DEPC. Lysates were transferred to 1.5 ml tubes, 500 μl of phenol was added and mixed vigorously. Samples were passed ten times through 20G needles, centrifuged, the aqueous phase was recovered, 500 μl of phenol was added, and the samples were mixed vigorously. The samples were centrifuged, the aqueous phase was recovered, and treated with 500 μl of phenol/chloroform (1:1). This step was repeated with 500 μl of chloroform. The RNA was precipitated overnight with 1/3 volume of 8M LiCl, samples were centrifuged, and pelleted RNA was washed twice with 70% ethanol. Five μg samples of RNA were subjected to formaldehyde gel electrophoresis using standard procedures (Sambrook 1989) and transferred to Hybond-XL membranes (Amersham Biosciences, Piscataway, NJ) according to the manufacturer’s instructions. The filters were prehybridized at 68°C for 3 h in 0.5 M sodium phosphate buffer pH 7.2, 7% SDS and 1 mM EDTA, and hybridized in the same solution with cDNA fragments labeled by random priming (Feinberg and Vogelstein 1983). After the hybridization, nonspecifically bound radioactivity was removed by four washes in 40 mM phosphate buffer, 1% SDS and 1 mM EDTA at 68°C for 20 min.
Synthetic oligonucleotides
The following oligonucleotides were synthesized to generate the 5′ flanking regions of the kal and pci genes by PCR using Taq polymerase: SGkallR, 5′-CAGGGATCCACTGATTACTGGGGAGAG-3′; SGkallL, 5′-CCAGGATCCCTGGTCAAACCAG-3′; PCItop, 5′-TTTGGGATCCTCTCTCAGGAGTGCCCA T G-3′; PCIbot, CGGGGGATCCACTCACCTCTGCTGC. The second exons of both the pci and kal genes were amplified by PCR using the following primers: PCIexIItop, 5′-ACCATCTAGATCTTCCTCCTCTTGTGCC-3′; PCIexIIbot, 5′-AGTGTCTAGAGT GTTGGTGTCTTTGCCATG-3′; Lkall, 5′-GAGGAAGCTTCTTATCGACTACCTGCT CC-3′; Rkall, 5′-TTTGAAGCTTATGTAATTCACCAGCACC-3′. The probes used for Southern blotting were generated by PCR using the following oligonucleotides; SG1L, 5′-CATAAGCTTCCCATGAAGAAAGGCACC-3′; SG1R, 5′-GACTCTAGAATCAGA GGGTGGG-3′; SG2L, 5′-AAAGGATCCTGTGTAATTGAAAGAGC-3′; SG2R, 5′-GCAAAGCTTGTCCGTTCTATC-3′; SG5L, 5′-GCAGAATCCGAAACAGGTTGA GAGATGTAC-3′; SG5R, 5′-GAGCAGATCTCATCCTAGGGGA-3′; SG6L, 5′-CACACCAGGTCCATTCTCC-3′; SG6R, 5′-GCTTTGTGAAGGTGGTGACCT-3′; SG7L, 5′-GTTTGGATCCATTATTGGTG-3′; SG7R, 5′-GATGCTCTCTGGGAAGCGC-3′; SG8L, 5′-GATGGAAGCAGCTTTACAC-3′; SG8R, 5′-GATCCTGAATGCTTCCCT C-3′; SG9L, 5′-CAATCAGACTCTTCAGAGG-3′; SG9R, 5′-TCTGCAAGTGTGAA AGTC-3′; SG11L, 5′-GGATTGACTCACCCAGTG-3′; SG11R, 5′-GGAGCACCTTC CCATATTAC-3′. The following oligonucleotides were used in chromatin immunoprecipitation experiments: proACT (5′-TTGAGTAGGTCTAACAAGCC-3′ and 5′-CCTCAGGGAGCTGGATGTAG-3′); proPCI (5′-GCCACCTCCACTGTGTGCAC-3′ and PCIbot) and proDRA (5′-TCCAATGAACGGAGTATCTTGTGTC-3′ and 5′-ATGTGGGGTGTAATAGAGTCTGACC-3′).
Plasmid construction
The BAC clone RP11-986E7 containing the distal cluster of serpin genes was obtained from ResGen (Huntsville, AL) and used as a template for PCR. Plasmids pPCI(−421)CAT and pKAL(−693)CAT were generated by inserting the BamHI-digested PCR fragments into the BamHI/BglII sites of the ptkΔEH reporter plasmid. Plasmid pPCIExII and pKALExII were obtained by insertion of the XbaI and HindIII digested PCR products, respectively, into XbaI or HindIII sites of pUC19. Plasmid pACT(−352)CAT has previously been described (Kordula et al. 1998).
Transient transfections
Cells were transfected in 12 well clusters using FuGENE6 transfection reagent (Roche, Indianapolis, IN), according to the supplier’s instructions. Plasmids (200 ng of the CAT reporter plasmid and 100 ng of β-galactosidase expressing plasmid pCH110) and 0.6 μl of FuGENE6 diluted in 50 μl of serum free medium were used for each well containing cells growing in 500 μl of culture medium. One day after transfection cells were stimulated, cultured another 24 h, and harvested. Protein extracts were prepared by freeze thawing (Gorman 1985), and protein concentration was determined by the BCA method (Sigma Chemical Co., St. Louis, MO). Chloramphenicol acetyltransferase (CAT) and β-galactosidase assays were performed as described (Delegeane et al. 1987; Seed and Sheen 1988). The CAT activities were normalized to the internal control (β-galactosidase activity) and are mean values ± S.E.M. (3 determinations).
Isolation of nuclei and DNase I-hypersensitive site mapping
Nuclei were isolated and treated with increasing concentrations of DNase I exactly as described (Rollini and Fournier 1999b). DNA was isolated using a DNA isolation kit from Gentra Systems (Minneapolis, MN) according to the manufacturer’s instructions. Purified genomic DNA (10 μg per gel lane) was digested with the appropriate restriction enzyme, separated in 0.8% agarose gel, and transferred to Hybond-XL membranes (Amersham Biosciences, Piscataway, NJ). Membranes were hybridized to random primer-labeled PCR fragments in 500 mM sodium phosphate pH 7.2, 7% SDS, 1mM EDTA and 10 μg/ml herring DNA at 68°C. After the hybridization, nonspecifically bound radioactivity was removed by two washes in 40 mM phosphate buffer, 1% SDS and 1 mM EDTA at 68°C for 20 min. The probes and restriction digests used to map DHSs in the entire distal serpin subcluster are listed in Table I.
TABLE I.
Strategy of DNaseI hypersensitive sites (DHS) identification.
| PROBE | LOCATION (kb) | SIZE OF PROBE (bp) | ENZYME USED | ORIGINAL FRAGMENT (kb) | DIGESTED FRAGMENT (kb) | POSITION OF DHS (kb) | TISSUE SPECIFICITY |
|---|---|---|---|---|---|---|---|
| PRA7 | −9.6 | 359 | HindIII | 8.1 | 3.8 2.5 1.2 0.8 |
−13.1 −11.7 −10.4 −10.0 |
A*/H* A*/H A*/H A*/H |
| PRA6 | −17.4 | 459 | HindIII | 8.1 | 6.9/7.3 5.6 4.3 |
−10.4/−10.0 −11.7 −13.1 |
A*/H A*/H A*/H* |
| SG1 | −19.1 | 495 | XbaI | 10.2 | --- | --- | --- |
| SG2 | −29.6 | 598 | HindIII | 4.0 | 1.9 1.6 |
−30.9 −30.6 |
H H |
| SG5 | +1.2 | 484 | BglII | 10.1 | 3.0 1.7 |
−1.3 −0.004 |
A/H A/H |
| SG6 | −35.5 | 481 | HindIII | 8.3 | 4.0 3.8 |
−39.0 −38.8 |
A/H A/H |
| SG7 | −46.1 | 455 | HindIII | 3.5 | --- | --- | --- |
| SG7 | −46.0 | 455 | BamHI | 11.1 | --- | --- | --- |
| SG7 | −46.0 | 455 | BamHI/AflII | 6.2 | 4.8 | −50.4 | H |
| SG8 | +13.0 | 420 | BamHI | 4.1 | --- | --- | --- |
| SG9 | +9.3 | 437 | BglII | 5.1 | --- | --- | --- |
| SG11 | +4.2 | 540 | NcoI | 4.3 | --- | --- | --- |
| ExPCI | −25.0 | 953 | BglII | 10.9 | 6.4 4.5 |
−30.6 −28.6 |
H H |
The specificity of DHS’s is indicated: A; astrocytes, H; hepatocytes. Asterisks indicate sites observed with very low concentration of DNase I which are very easily accessible for digestion. Location of the probe is represented as a single number that indicates position of the more distant 5′ end of the probe relatively to the transcription start site of the ACT gene.
Enzyme accessibility assay
Nuclei were isolated as described above for DHS mapping. Purified nuclei (2 OD260) were resuspended in 300 mM sucrose, 1x restriction enzyme buffer, 100 μg/ml bovine serum albumin, and incubated with selected restriction enzymes (400 units) at 37°C for 1 hour. Then, DNA was isolated and analyzed as described above for DHS mapping.
Chromatin immunoprecipitation
Cells were treated with cytokines for 1 hour, chromatin was crosslinked by the addition of formaldehyde to 1% followed by a 10 minute long incubation at 37°C. Subsequently, the cells were washed with ice-cold PBS containing 125 mM glycine and 1 mM PMSF. Chromatin was sonicated and immunoprecipitated using specific antibodies exactly as described in the chromatin immunoprecipitation protocol from Upstate Inc. (Waltham, MA). The following antibodies were used: anti-acetyl-histone H3, anti-acetyl-histone H4, anti-dimethyl-histone H3 (Lys4), anti-dimethyl-histone H3 (Lys9), anti-phospho-histone H3 (Ser28) (all from Upstate Inc., Waltham, MA) and anti-acetyl-histone H4 (Lys5), anti-acetyl-histone H4 (Lys8), anti-acetyl-histone H4 (Lys12) and anti-acetyl-histone H3 (Lys14) (all from Abcam Inc., Cambridge, MA).
RESULTS
The ACT gene is the only gene from the distal serpin subcluster that is expressed in both human astrocytes and astrocytoma cells
It has been shown that human hepatocytes and hepatoma cells express all the genes located within the distal serpin subcluster (Baumann et al. 1984; Tone et al. 1987; Chai et al. 1993). In contrast, human astrocytes and astrocytoma cells have only been reported to express ACT mRNA (Abraham et al. 1993; Kasza et al. 2001), whereas to date the expression of the pci and kal genes has not been analyzed. To investigate the expression and regulation of these genes we treated human astrocytes and astrocytoma cells with IL-1, OSM and TNF, and then measured the expression of mRNA from the genes localized within the distal subcluster by Northern blotting. In fact, ACT mRNA was expressed in both astrocytes and astrocytoma cells, with expression levels greatly increasing in response to IL-1, TNF, and OSM as previously reported (Fig. 1A) (Kordula et al. 1998; Kordula et al. 2000). In contrast, the pci and kal genes were not expressed in cytokine-treated or untreated astrocytes and astrocytoma cells (Fig. 1B and C). As expected, all three genes were expressed in hepatoma cells, and the levels of ACT mRNA were strongly increased in response to the cytokines of the IL-6 family including OSM and IL-6 itself. From these results we concluded that a tissue-specific mechanism exists that controls hepatocyte- and astrocyte-specific expression of genes from the distal serpin subcluster.
Fig. 1. Tissue-specific expression of genes from the distal serpin subcluster in astrocytes and hepatic cells.

Human primary astrocytes, hepatoma HepG2 and astrocytoma U373-MG cells were treated with IL-1 (10 ng/ml) and OSM (25 ng/ml), IL-6 (50 ng/ml), TNF (5 ng/ml) or PMA (10/ng/ml). RNA was isolated after 18 hours and subjected to Northern blot analysis using ACT cDNA (A), PCI exon II (B), and KAL exon II as probes. Bottom panel shows 28S RNA stained with ethidium bromide on the membrane. (D) Human astrocytes were transfected with plasmids pPCI(−421)CAT, pKAL(−693)CAT, pACT(−352)CAT and β-galactosidase expression vector as an internal control for transfection efficiency. One day post transfection the cells were stimulated with indicated cytokines, cultured for another 24 hours, and harvested. CAT activities were normalized to β-galactosidase activities, and are mean values ± S.E.M (3 independent experiments).
The PCI promoter can function in astrocytes
The lack of PCI and KAL mRNA expression in astrocytes and astrocytoma cells can be explained by several different mechanisms. One simple mechanism would involve the presence of transcription factor dependent cis-elements within the pci and kal promoters that are active in hepatocytes but not in astrocytes. To test this hypothesis we amplified the 5′ flanking regions of the pci and kal genes, linked them to a cat reporter gene, and tested these constructs in transient transfection experiments of astrocytes and hepatoma cells (Fig. 1D). As expected, both promoters drove the transcription of the reporter gene in hepatoma cells and were not significantly regulated by cytokines which reflected the expression pattern of endogenous genes. The pci promoter was also active in astrocytes whereas the kal promoter had only limited transcriptional activity in these cells. For comparison we used the ACT reporter plasmid (lacking the IL-1 enhancer), and found the previously reported pattern of regulation (Kordula et al. 1998). We conclude that astrocytes express all factors necessary for transcription from the pci promoter and, therefore, some other mechanism must determine the expression pattern of the distal serpin cluster genes in astrocytes and astrocytoma cells.
A long-range DNase I-hypersenistive site (DHS) map of the distal serpin subcluster
Although the pci promoter was functional in astrocytes the endogenous pci gene was not expressed. Two mechanisms can explain these observations. Either a tissue-specific silencer is down-regulating the expression of the pci gene in astrocytes (but not in hepatocytes) or the pci gene is localized within inaccessible chromatin in astrocytes. The existence of the first mechanism seems unlikely since the pci gene silencer would have to function in most cell types not expressing the pci gene. Therefore, we hypothesized that the pci and kal genes are packaged into inaccessible chromatin in astrocytes and astrocytoma cells. In contrast, both of these genes and the act gene should be localized to accessible chromatin in hepatocytes. To test this hypothesis we used DNase I to probe the chromatin structure at the distal serpin subcluster. DNase I is very useful for studying chromatin structure since actively transcribed genes are, in general, found in enzyme-accessible chromatin regions whereas the majority of inactive genes are located in enzyme-resistant regions (Gross and Garrard 1988; Fedor 1992). In addition, there are specific sites in the mammalian genome that are hypersensitive to digestion by DNase I (DHS). These sites are mostly free from nucleosomes and easily accessible to transactivators (Elgin 1988). Nuclei from astrocytes, hepatoma HepG2, astrocytoma U373-MG, and cervical carcinoma HeLa cells were prepared, incubated with increasing amounts of DNase I, DNA was purified, digested with appropriate restriction enzymes, and analyzed via Southern blotting. An example of such an experiment is shown in Fig. 2B., where two DHSs were mapped at −13.1 kb and −11.7 kb from the transcription start site of the act gene in hepatoma and astrocytoma cells. In contrast, these two DHSs were absent in non-expressing HeLa cells. Fig. 2C shows another example with two DHSs that mapped to −30.6 kb and −28.6 kb (the first intron of the pci gene) being present in hepatoma cells but not in astrocytoma cells. Similar mapping experiments were performed throughout the entire distal serpin subcluster, as summarized in table I.
Fig. 2. DNase I-hypersensitive site map of the distal serpin subcluster in astrocytes, hepatoma, astrocytoma and carcinoma cells.

(A) The map is drawn to scale, with position +1 defined as the transcription start site of the act gene. Exons are indicated as black boxes, a gray box represents IL-1 enhancer, the kal, pci, and act genes are also shown. Arrows indicate DHSs. Nuclei from astrocytes, hepatoma HepG2, astrocytoma U373-MG, and carcinoma HeLa cells were digested with increasing concentrations of DNase I, DNA was purified and digested with HindIII. DNA samples were analyzed by Southern blotting using the PRA7 “IL-1 enhancer” probe (B) or the SG2 “pci promoter” probe (C). The description and location of probes is listed in table I.
We have identified twelve DHSs in HepG2 cells, six of which were also present in astrocytes and U373-MG cells, while all of these DHSs were totally absent in non-expressing HeLa cells (Fig. 2A). The distribution of DHSs in hepatoma cells clearly demonstrates that the entire distal subcluster is enzyme accessible in these cells. In addition, the DHSs were found localized close to the transcription start sites of all three genes indicating strong chromatin remodeling at these regions. In contrast, all six DHSs found in astrocytes and astrocytoma cells were mapped to the region between the act gene and its IL-1-responsive enhancer.
These data support our hypothesis that the pci and kal genes reside within inaccessible chromatin in astrocytoma cells but in easily accessible chromatin in hepatoma cells. However, the 5′ flanking region of the act gene is easily accessible in all these cell types. These tissue-specific chromatin structures most likely determine the expression pattern of genes located in the distal subcluster.
The DNA at the promoter of the act gene and its IL-1-responsive enhancer is accessible in both hepatoma and astrocytoma cells prior to cytokine stimulation
The presence of expression-associated DHSs in the 5′ flanking region of the act gene in astrocytes, astrocytoma and hepatoma cells suggests that the DNA at both the promoter and the IL-1-responsive enhancer of this gene is accessible. Moreover, this accessibility is likely to be further increased after cytokine treatment since cytokines increase the expression of the act gene in both cell types. To test this presumption we applied an enzyme-accessibility assay and analyzed both the promoter and the IL-1-responsive enhancer of the act gene. Nuclei were purified from control or cytokine-treated cells and incubated with the appropriate restriction enzyme. Subsequently, DNA was purified, digested with another restriction enzyme, and analyzed by Southern blotting. The IL-1-responsive enhancer (Fig. 3A) and the act promoter (Fig. 3B) were easily accessible in cell types that express ACT, but not in non-expressing HeLa cells. Furthermore, treatment with IL-1 or IL-6 had no effect on this accessibility. The accessibility at the IL-1 enhancer was similar in both hepatoma and astrocytoma cells even though this enhancer is not functional in hepatoma cells due to an IkBα-dependent (inhibitor of NF-kB) inhibitory mechanism that blocks its activity in hepatic cells (Kiss et al.). We conclude that the 5′ flanking region of the act gene is already remodeled in cell types that express ACT mRNA, and cytokine treatment does not result in any changes that can be monitored using an enzyme-accessibility assay.
Fig. 3. Enzyme-accessibility at the IL-1 enhancer and promoter of the ACT gene in hepatoma, astrocytoma, and carcinoma cells.

Nuclei from hepatoma HepG2, astrocytoma U373-MG, and carcinoma HeLa cells were digested with SacI (A) or PstI (B) as described in materials and methods section, DNA was purified and subsequently digested with NcoI. DNA samples were then analyzed by Southern blotting using the short enhancer (A) and promoter (B) probes indicated on the diagram.
Tissue specific differences in DNA accessibility within the pci gene but not the act gene
Since the enzyme accessibility at the 5′ flanking region of the act gene was similar in both hepatoma and astrocytoma cells we tested if this was also true for the transcribed region of the act gene. In addition, we performed enzyme accessibility assays within the pci gene which is transcribed in hepatoma cells but not in astrocytoma cells. In fact, we found substantial differences between the enzyme accessibility of the first intron of the pci gene in hepatoma and astrocytoma cells (Fig. 4). In hepatoma cells the DNA was easily accessible for digestion near the first exon and barely accessible 2.5 kb downstream in the middle of first intron; however, both of these sites were barely accessible in astrocytoma cells (Fig. 4A). These findings correlate with the observed expression pattern of the pci gene. In contrast to the pci gene, a comparable level of enzyme accessibility was found within the second intron of the act gene in both hepatoma and astrocytoma cells (Fig. 4B). Once again this pattern correlates with the expression of ACT in the two cell types. In addition, enzyme accessibility changes were not detected in either cell type after cytokine-treatment.
Fig. 4. Enzyme accessibility within the transcribed regions of the act and pci genes.

Nuclei from hepatoma HepG2 and astrocytoma U373-MG cells were digested with SacI as described in materials and methods section, DNA was purified and subsequently digested with BglII. DNA samples were analyzed by Southern blotting using the PCI exon II probe (A) or the ACT intron II probe (B) as indicated on the diagram. Asterisks (*) indicate double digest control samples (purified DNA was digested with SacI and either BglII or NcoI).
Tissue specific histone modifications within the distal serpin subcluster
The accessibility of DNA to enzyme digestion at the promoters of expressed genes is believed to correlate with increased histone acetylation executed by transcription factor-recruited coactivators. Therefore, we analyzed the acetylation of histones bound to both promoters of the pci and act genes. Surprisingly, both histones H3 and H4 located at the act and pci promoters were equally acetylated in both hepatoma and astrocytoma cells even though the pci gene is not expressed in astrocytoma cells (Fig. 5A). Furthermore, cytokine treatment of the cells did not significantly change the level of this acetylation. In contrast, neither histone H3 nor H4 were acetylated in non-expressing HeLa cells (Fig. 5A), and these cells also possessed inaccessible chromatin structure at the distal serpin subcluster (Fig. 3 and 4). We conclude that cells expressing at least one of the genes located within the distal subcluster are characterized by the presence of acetylated histones H3 and H4; however, this acetylation cannot be directly correlated with tissue-specific expression pattern characteristic for these cells.
Fig. 5. The histone code within the distal serpin subcluster.

HepG2, U373-MG, and HeLa cells were stimulated with IL-1 or OSM for 1 hour, chromatin was prepared, and equal amounts of chromatin were immunoprecipitated with specific antibodies as described in materials and methods section. Subsequently, DNA was purified and the act, pci and hla-dra gene promoter regions were amplified by PCR in the presence of 32P dCTP. PCR products were separated in 12% native polyacrylamide gels, and exposed to phosphorimager screens. Input represents 2% of chromatin used for immunoprecipitation. Ab indicates nonspecific polyclonal antibodies. ProACT, proPCI and proDRA mark the PCR products derived from the act, pci and hla-dra promoters, respectively.
(A) Total acetylation of histone H3 (Ac-H3) and H4 (Ac-H4).
(B) Specific modifications of histone H3: dimethyl-(K4) (mK4H3), dimethyl-(K9) (mK9H3), acetyl-(K14) (AcK14H3), phospho-(S28) (pS28H3); and histone H4: acetyl-(K5) (AcK5H4), acetyl-(K8) (AcK8H4), and acetyl-(K12) (AcK12H4).
Besides acetylation, several other histone modifications have been described including methylation, phosphorylation, and ubiquitination. These modifications provide unique histone code at any given promoter, and may serve as a recognition signal for transcription to occur by providing specific signals/binding sites for different components of the transcriptional machinery. We have analyzed the histone code at the act and pci promoter as well as at the non-expressed hla-dra gene promoter (major histocapability class II gene) in both astrocytoma and hepatoma cells (Fig. 5B). As shown in Fig. 5B, histones present at the act and pci promoter were acetylated on several lysine residues in hepatoma and astrocytoma cells while the hla-dra promoter did not contain acetylated histones. More importantly, the only histone modification that strongly correlated with tissue-specific transcriptional activity of studied genes was methylation of histone H3 on lysine 4 which was found at both the act and pci promoters in hepatoma cells but only at the act promoter in astrocytoma cells. We conclude that methylation of lysine 4 of histone H3 combined with the acetylation of both histone H3 and H4 correlates with the transcriptional activity of genes located within the distal serpin subcluster.
Inhibition of methyltransferase activity reduces expression of genes from the distal serpin subcluster
Since the methylation of lysine 4 on histone H3 correlated with the expression of serpin genes we tested whether methyltransferase activity was required for serpin gene expression. HepG2 cells were treated with adenosine dialdehyde (AdOx), a potent methyltransferase inhibitor, and expression of the act and pci genes was analyzed by Northern blotting. The basal expression and cytokine induced expression of the act gene was strongly inhibited by AdOx while the basal expression of the pci gene was slightly diminished (Fig. 6A). Simultaneously, AdOx decreased methylation of histone H3 on lysine 4 at both the act and pci promoters as determined by CHIP analysis (Fig. 6B). Hence, we conclude that methyltransferase activity is needed for transcription of genes from the distal serpin subcluster.
Fig. 6. Inhibition of methyltransferase activity suppresses serpin expression.

Human hepatoma HepG2 cells were pretreated with 40 mM AdOx for 24 hours, and subsequently treated with IL-1 (10 ng/ml) or OSM (25 ng/ml). (A) RNA was isolated after 18 hours and subjected to Northern blot analysis using ACT cDNA, PCI exon II, and GAPDH cDNA as probes. Numbers represent results of densitometric analysis.
(B) Chromatin was prepared as described in materials and methods and immunoprecipitated with anti-dimethyl-histone H3 (K4) or nonspecific antibodies (Ab). PCR products were separated in 12% native polyacrylamide gels, and exposed to phosphorimager screens. Input represents 2% of chromatin used for immunoprecipitation.
DISCUSSION
The tissue specific expression of the distal serpin subcluster correlates with DHS distribution
All four genes located within the distal serpin subcluster are expressed in hepatic cells whereas only ACT has been shown to be synthesized and secreted by astrocytes (Abraham et al. 1988; Namciu et al. 2004). Here we present data indicating that the pci and kal genes are not expressed in primary human astrocytes or astrocytoma U373-MG cells. These results correlate with the tissue-specific pattern of gene expression observed by others using microarray analysis (http://expression.gnf.org/cgi-bin/index.cgi) (Su et al. 2002). The expression of serpin genes is not simply determined by regulatory elements located within their promoters since their expression did not correlate to that of corresponding reporter constructs. These results suggested that the tissue-specific chromatin structures of the distal serpin subcluster may determine transcriptional activity of the serpin genes not only in expressing versus non-expressing cells, but also between different expressing cell types. In fact our DHS mapping allows us to conclude the following: i) the distal serpin subcluster is not accessible for DNase I cleavage in non-expressing cells suggesting presence of compact inaccessible chromatin; ii) the entire subcluster is accessible for DNase I cleavage in hepatic cells with the presence of DHSs in close vicinity to all the promoters; iii) only the portion of the subcluster containing the act gene with its 5′ flanking region is accessible for DNase I cleavage in astrocytes; iv) the six DHSs found in astrocytes were also present in hepatic cells. These observations clearly indicate that the tissue-specific expression of these genes is regulated on the level of chromatin organization.
Tissue specificity in hepatocytes and astrocytes
It is widely accepted that transcription factors belonging to four conserved families HNF-1, HNF-3, HNF-4, and CAAT enhancer binding proteins (C/EBP) determine the expression of liver specific genes (Rollini and Fournier 1999a). It has also been shown that HNF-1 and HNF-4 are indispensable for the expression of serpin genes from the proximal serpin subcluster in hepatocytes (Rollini and Fournier 1999a). In contrast, the transcription factors that determine astrocyte-specific expression have not been well defined. Glial fibrillary acidic protein (GFAP) is a known marker of astrocytes and the 2.2 kb 5′ flanking region of the gfap gene supports astrocyte-specific expression of transgenes in transgenic mice (Brenner et al. 1994). This fragment was shown to contain several elements including an AP-1 binding element that is important for transcription in astrocytes (Sarid 1991).
The six DHSs found in astrocytes within the distal serpin subcluster were also present when hepatoma cells were analyzed. This similar distribution of DHSs suggests that they may result from the cell type specific binding of a transcription factor(s) that is/are present in both cell types. However, HNF-1, HNF-3, HNF-4, and C/EBPα (a predominant member of the C/EBP family found in non-stimulated hepatic cells) are not expressed in astrocytes. The lack of these liver-specific factors in astrocytes suggests that another transcription factor(s) present in both cell types is(are) responsible for the formation of the six DHSs. In fact, preliminary experiments have indicated that AP-1 is a good candidate to be the transcription factor responsible for formation of these six sites in astrocytes. This prediction is based on several observations; i) functional AP-1 binding elements are found in both the IL-1-responsive enhancer and an additional element located approximately 1.5 kb downstream of this enhancer ((Kordula et al. 2000) and data not shown), ii) AP-1 components are expressed in both cell types but the levels of AP-1 found in astrocytes and astrocytoma cells are approximately 10–20 fold higher than in hepatoma cells (Kiss, D. L. unpublished data), and iii) AP-1 is likely necessary for expression of GFAP which is an astrocyte specific marker (Sarid 1991).
The other six DHSs found exclusively in hepatic cells, are most likely formed as a result of HNFs and/or C/EBP binding. Subsequently, the open chromatin structure of this region, which contains the kal and pci genes, allows for the transcription of these genes in hepatocytes.
Accessible chromatin is found at the IL-1-responsive enhancer and at the promoters of expressed genes but not within the transcribed regions
DHSs are associated with drastic changes in chromatin structure; however, more discrete changes cannot be seen using this technique. Therefore, we used an enzyme accessibility assay to analyze the IL-1-responsive enhancer and both the promoters and transcribed regions of the act and pci genes. As predicted, the promoter of the act gene was accessible in both hepatoma and astrocytoma cells but not in non-expressing HeLa cells. However, this promoter accessibility in expressing cells was not increased by cytokine treatment, as one would predict. It is important to note that in contrast to the closely related α1-antitrypsin gene, which was shown to be fully active only after several days of cytokine treatment (Koj et al. 1991; Soutoglou and Talianidis 2002), the act gene is a “fast” cytokine-responding gene. Therefore, it is likely that the act promoter is already in a remodeled state in non-stimulated cells and hence ready to bind cytokine-activated transcription factors including STAT3 and STAT1 (Kordula et al. 1998). Since the DNA was easily accessible just below the first short exon of the pci gene the same “open” chromatin structure seems to exist at the PCI promoter in hepatoma cells. In contrast, this region of DNA was not accessible in astrocytoma cells not expressing the pci gene.
In addition, the transcribed regions of both the act and pci genes were barely accessible in expressing cells, which supports similar findings for other genes (Kim and Dean 2003). Therefore, it is puzzling how efficient transcription of these genes can be achieved when DNA is tightly bound by nucleosomes. The accessibility of the IL-1-responsive enhancer in both cell types was expected even though this enhancer does not function in hepatic cells. We have recently proposed an IkBα-dependent mechanism thateffectively blocks activity of this enhancer in hepatic cells (Kiss et al.).
Histone code and tissue-specific expression of distal serpin subcluster genes
The modification of histone tails, particularly their acetylation, has been shown to correlate with the presence of “open” chromatin structure and subsequent effective transcription (Strahl and Allis 2000; Peterson 2002). Our data clearly demonstrate that acetylation of both histone H3 and H4 at both the act and pci promoter was apparent in expressing cells (Fig. 5B). The high level of C/EBPα expression could account for recruitment of histone acetyltransferases in hepatocytes since expression of C/EBPα has recently been shown to specifically enhance acetylation of histone H3 but not H4 in pituitary cells (Zhang et al. 2001). However, presence of acetylated histones at the pci promoter in astrocytoma cells that do not transcribe this gene is puzzling. In contrast, a total lack of acetylation on both histones H3 and H4 was found in non-expressing HeLa cells. This discrepancy in the acetylation pattern between the non-transcribed regions in astrocytoma and carcinoma cells suggests that an additional silencing mechanism exists in HeLa cells. This is further confirmed by a total lack of DNA accessibility at the distal serpin subcluster in HeLa cells (Fig. 2).
Our data suggest that there are two steps necessary to activate gene expression from the distal serpin subcluster in expressing cells (Fig. 7). The first step involves the acetylation of histone H3 and H4, and this modification likely prevents the silencing of the entire subcluster in cells which are destined to transcribe some of the genes from the distal subcluster. This may be achieved by recruitment of SWI/SNF complex via its bromodomain and subsequent remodeling as proposed during activation of the interferon-β gene (Agalioti et al. 2002). However, our data clearly demonstrate that the acetylation of histones H3 and H4 is not enough to ensure tissue-specific gene transcription from the distal serpin subcluster (Fig. 5A). In contrast to histone H3 and H4 acetylation, methylation of Lys4 of histone H3 correlated with tissue–specific transcription of the pci and act genes. In addition, inhibition of methyltransferase activity resulted in strong inhibition of serpin expression (Fig. 6). Therefore, we speculate that Lys4 methylation of histone H3 is a second step required for transcription to occur. This observation is in agreement with the general view that Lys4 methylation is associated with transcriptional activity (Litt et al. 2001) (Schneider et al. 2004). However, two models have been recently proposed for recruitment of histone methyltransferase (HMT) to the site of transcription. In the first model HMTs are recruited by phosphorylated polymerase II, and therefore act at late steps of transcriptional initiation (Ng et al. 2003; Xiao et al. 2003). In the alternative model, HMT is recruited by transcription factors in early steps of transcriptional initiation before recruitment of polymerase II (Song and Ghosh 2004). Our experimental system does not allow distinguishing between these two models; however, the second model could explain the mechanism of tissue-specific expression of serpin genes, once the identity of tissue specific factor(s) that recruit the HMT(s) is/are identified. Taken together we propose a two step model for tissue specific gene expression with broad histone H3 and H4 acetylation that prevents gene silencing followed by the tissue-specific methylation of histone H3 on Lys4 that allows expression of specific genes.
Fig. 7. Model of the tissue-specific expression of genes from the distal serpin subcluster.
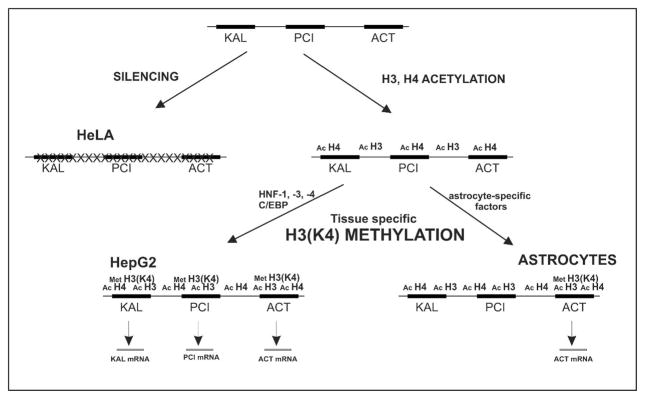
The kal, pci, and act genes are represented by black boxes. Acetylation of histones H3 and H4 across the entire serpin subcluster prevents silencing that otherwise takes place and leads to “closed” chromatin formation and the lack of expression observed in HeLa cells. Subsequently, HMT is recruited to the regions destined for transcription and this modification leads to tissue-specific gene expression.
Acknowledgments
We would like to thank Dr. Joseph Fontes for helpful discussions and critical reading of the manuscript. This work was supported by an NINDS grant NS044118 and Faculty Development Grant from CSU (both to T.K.).
Abbreviations
- ACT
α1-antichymotrypsin
- AdOx
adenosine dialdehyde
- AP-1
activating protein 1
- CAT
chloramphenicol acetyltransferase
- C/EBP
CAAT enhancer binding protein
- CNS
central nervous system
- DHS
DNase I-hypersensitive sites
- GFAP
glial fibrillary acidic protein
- HMT
histone methyltransferase
- HNF
hepatocyte nuclear factor
- IL
interleukin
- KAL
kallistatin
- NF-kB
nuclear factor kB
- OSM
oncostatin M
- PCI
protein C inhibitor
- STAT
signal transducer and activator of transcription
- TNF
tumor necrosis factor α
References
- Abraham CR, Selkoe DJ, Potter H. Immunochemical identification of the serine protease inhibitor alpha 1- antichymotrypsin in the brain amyloid deposits of Alzheimer’s disease. Cell. 1988;52:487–501. doi: 10.1016/0092-8674(88)90462-x. [DOI] [PubMed] [Google Scholar]
- Abraham CR, Kanemaru K, Mucke L. Expression of cathepsin G-like and alpha 1-antichymotrypsin-like proteins in reactive astrocytes. Brain Res. 1993;621:222–232. doi: 10.1016/0006-8993(93)90110-9. [DOI] [PubMed] [Google Scholar]
- Agalioti T, Chen G, Thanos D. Deciphering and transcriptional histone acetylation code for human gene. Cell. 2002;111:381–392. doi: 10.1016/s0092-8674(02)01077-2. [DOI] [PubMed] [Google Scholar]
- Baumann H, Jahreis GP, Sauder DN, Koj A. Human keratinocytes and monocytes release factors which regulate the synthesis of major acute phase plasma proteins in hepatic cells from man, rat, and mouse. J Biol Chem. 1984;259:7331–7342. [PubMed] [Google Scholar]
- Brenner M, Kisseberth WC, Su Y, Besnard F, Messing A. GFAP promoter directs astrocyte-specific expression in transgenic mice. J Neurosci. 1994;14:1030–1037. doi: 10.1523/JNEUROSCI.14-03-01030.1994. [DOI] [PMC free article] [PubMed] [Google Scholar]
- Chai KX, Chen L-M, Chao J, Chao L. Kallistatin: anovel human serine proteinase inhibitor: molecular cloning, tissue distribution, and expression in Escherichia coli. J Biol Chem. 1993;268:24498–24505. [PubMed] [Google Scholar]
- Chai KX, Ward DC, Chao J, Chao L. Molecular cloning, sequence analysis, and chromosomal localization of human protease inhibitor 4 (kallistatin) gene PI4. Genomics. 1994;23:370–378. doi: 10.1006/geno.1994.1513. [DOI] [PubMed] [Google Scholar]
- Cichy J, Potempa J, Chawla RK, Travis J. Regulation of alpha 1-antichymotrypsin synthesis in cells of epithelial origin. FEBS Lett. 1995;359:262–266. doi: 10.1016/0014-5793(95)00064-g. [DOI] [PubMed] [Google Scholar]
- Das S, Potter H. Expression of the Alzheimer amyloid-promoting factor antichymotrypsin is induced in human astrocytes by IL-1. Neuron. 1995;14:447–456. doi: 10.1016/0896-6273(95)90300-3. [DOI] [PubMed] [Google Scholar]
- Delegeane AM, Ferland LH, Mellon PL. Tissue-specific enhancer of the human glycoprotein hormone alpha- subunit gene: dependence on cyclic AMP-inducible elements. Mol Cell Biol. 1987;7:3994–4002. doi: 10.1128/mcb.7.11.3994. [DOI] [PMC free article] [PubMed] [Google Scholar]
- Elgin SCR. The formation and function of DNase I hypersensitive sites in the process of gene activation. J Biol Chem. 1988;263:19259–19262. [PubMed] [Google Scholar]
- Fedor MJ. Chromatin structure and gene expression. Curr Opin Cell Biol. 1992;4:436–443. doi: 10.1016/0955-0674(92)90009-2. [DOI] [PubMed] [Google Scholar]
- Feinberg AP, Vogelstein B. A technique for radiolabeling DNA restriction endonuclease fragments to high specific activity. Anal Biochem. 1983;132:6–13. doi: 10.1016/0003-2697(83)90418-9. [DOI] [PubMed] [Google Scholar]
- Fraser PE, Nguyen JT, McLachlan DR, Abraham CR, Kirschner DA. Alpha 1-antichymotrypsin binding to Alzheimer A beta peptides is sequence specific and induces fibril disaggregation in vitro. J Neurochem. 1993;61:298–305. doi: 10.1111/j.1471-4159.1993.tb03568.x. [DOI] [PubMed] [Google Scholar]
- Gorman C. In: DNA Cloning: A Practical Approach. Glover D, editor. IRL Press; 1985. pp. 143–190. [Google Scholar]
- Gross DS, Garrard WT. Nuclease hypersensitive sites in chromatin. Annu Rev Biochem. 1988;57:159–197. doi: 10.1146/annurev.bi.57.070188.001111. [DOI] [PubMed] [Google Scholar]
- Kasza A, Rogowski K, Kilarski W, Sobota R, Bernas T, Dobrucki J, Travis J, Koj A, Bugno M, Kordula T. Differential effects of oncostatin M and leukaemia inhibitory factor expression in astrocytoma cells. Biochem J. 2001;355:307–314. doi: 10.1042/0264-6021:3550307. [DOI] [PMC free article] [PubMed] [Google Scholar]
- Kim A, Dean A. A human globin enhancer causes both discrete and widespread alterations in chromatin structure. Mol Cell Biol. 2003;23:8099–8109. doi: 10.1128/MCB.23.22.8099-8109.2003. [DOI] [PMC free article] [PubMed] [Google Scholar]
- Kiss DL, Xu W, Gopalan S, Buzanowska K, Wilczynska KM, Rydel RE, Kordula T. Duration of α1-antichymotrypsin gene activation by IL-1 is determined by efficiency of IkBα resynthesis in primary human astrocytes. J Neurochem. 2005;92:730–738. doi: 10.1111/j.1471-4159.2004.02900.x. [DOI] [PMC free article] [PubMed] [Google Scholar]
- Koj A, Rokita H, Kordula T, Kurdowska A, Travis J. Role of cytokines and growth factors in the induced synthesis of proteinase inhibitors belonging to acute phase proteins. Biomed Biochim Acta. 1991;50:421–425. [PubMed] [Google Scholar]
- Kordula T, Bugno M, Rydel RE, Travis J. Mechanism of interleukin-1- and tumor necrosis factor alpha-dependent regulation of the alpha 1-antichymotrypsin gene in human astrocytes. J Neurosci. 2000;20:7510–7516. doi: 10.1523/JNEUROSCI.20-20-07510.2000. [DOI] [PMC free article] [PubMed] [Google Scholar]
- Kordula T, Rydel RE, Brigham EF, Horn F, Heinrich PC, Travis J. Oncostatin M and the interleukin-6 and soluble interleukin-6 receptor complex regulate alpha1-antichymotrypsin expression in human cortical astrocytes. J Biol Chem. 1998;273:4112–4118. doi: 10.1074/jbc.273.7.4112. [DOI] [PubMed] [Google Scholar]
- Litt MD, Simpson M, Recillas-Targa F, Prioleau MN, Felsenfeld G. Transitions in histone asetylation reveal boundaries of three separately regulated neighboring loci. Embo J. 2001;20:224–235. doi: 10.1093/emboj/20.9.2224. [DOI] [PMC free article] [PubMed] [Google Scholar]
- Ma J, Yee A, Brewer HB, Jr, Das S, Potter H. Amyloid-associated proteins alpha 1-antichymotrypsin and apolipoprotein E promote assembly of Alzheimer beta-protein into filaments [see comments] Nature. 1994;372:92–94. doi: 10.1038/372092a0. [DOI] [PubMed] [Google Scholar]
- Namciu SJ, Friedman RD, Marsden MD, Sarausad LM, Jasoni CL, Fournier REK. Sequence organization and matrix attachment regions of the human serine protease inhibitor gene cluster at 14q32.1. Mammalian Genome. 2004;15:162–178. doi: 10.1007/s00335-003-2311-y. [DOI] [PubMed] [Google Scholar]
- Ng HH, Robert F, Young RA, Struhl K. Targeted recruitment of Set1 histone methylase by elongating Pol II provides a localized mark and memory of recent transcriptional activity. Mol Cell. 2003;11:709–719. doi: 10.1016/s1097-2765(03)00092-3. [DOI] [PubMed] [Google Scholar]
- Nilsson LN, Bales KR, DiCarlo G, Gordon MN, Morgan D, Paul SM, Potter H. Alpha-1-antichymotrypsin promotes beta-sheet amyloid plaque deposition in a transgenic mouse model of Alzheimer’s disease. J Neurosci. 2001;21:1444–1451. doi: 10.1523/JNEUROSCI.21-05-01444.2001. [DOI] [PMC free article] [PubMed] [Google Scholar]
- Pasternack JM, Abraham CR, Van Dyke BJ, Potter H, Younkin SG. Astrocytes in Alzheimer’s disease gray matter express alpha 1- antichymotrypsin mRNA. Am J Pathol. 1989;135:827–834. [PMC free article] [PubMed] [Google Scholar]
- Peterson CL. Chromatin remodeling: nucleosomes bulging at the seams. Curr Biol. 2002;12:R245–R247. doi: 10.1016/s0960-9822(02)00782-0. [DOI] [PubMed] [Google Scholar]
- Rollini P, Fournier RE. A 370-kb cosmid contig of the serpin gene cluster on human chromosome 14q32.1: molecular linkage of the genes encoding alpha 1-antichymotrypsin, protein C inhibitor, kallistatin, alpha 1- antitrypsin, and corticosteroid-binding globulin. Genomics. 1997;46:409–415. doi: 10.1006/geno.1997.5077. [DOI] [PubMed] [Google Scholar]
- Rollini P, Fournier RE. The HNF-4/HNF-1alpha transactivation cascade regulates gene activity and chromatin structure of the human serine protease inhibitor gene cluster at 14q32.1. Proc Natl Acad Sci U S A. 1999a;96:10308–10313. doi: 10.1073/pnas.96.18.10308. [DOI] [PMC free article] [PubMed] [Google Scholar]
- Rollini P, Fournier RE. Long-range chromatin reorganization of the human serpin gene cluster at 14q32.1 accompanies gene activation and extinction in microcell hybrids. Genomics. 1999b;56:22–30. doi: 10.1006/geno.1998.5680. [DOI] [PubMed] [Google Scholar]
- Sambrook J, Fritsch EF, Maniatis T. Molecular Cloning: A Laboratory Manual. Cold Spring Harbor Laboratory; 1989. [Google Scholar]
- Sarid J. Identification of a cis-acting positive regulatory element of the glial fibrillary acidic protein gene. J Neurosci Res. 1991;28:217–228. doi: 10.1002/jnr.490280209. [DOI] [PubMed] [Google Scholar]
- Schneider R, Bannister AJ, Myers FA, Thorne AW, Crane-Robinson C, Kouzarides T. Histone H3 lysine 4 methylation patterns in higher eucaryotic genes. Nat Cell Biol. 2004;6:73–77. doi: 10.1038/ncb1076. [DOI] [PubMed] [Google Scholar]
- Seed B, Sheen JY. A simple phase-extraction assay for chloramphenicol acyltransferase activity. Gene. 1988;67:271–277. doi: 10.1016/0378-1119(88)90403-9. [DOI] [PubMed] [Google Scholar]
- Song MR, Ghosh A. FGF2-induced chromatin remodeling regulates CNTF-mediated gene expression and astrocyte differentiation. Nat Neurosci. 2004;7:229–235. doi: 10.1038/nn1192. [DOI] [PubMed] [Google Scholar]
- Soutoglou E, Talianidis I. Coordination of PIC assembly and chromatin remodeling during differentiation-induced gene activation. Science. 2002;295:1901–1904. doi: 10.1126/science.1068356. [DOI] [PubMed] [Google Scholar]
- Strahl BD, Allis CD. The language of covalent histone modifications. Nature. 2000;403:41–45. doi: 10.1038/47412. [DOI] [PubMed] [Google Scholar]
- Su AI, Cooke MP, Ching KA, Hakak Y, Walker JR, Wiltshire T, Orth AP, Vega RG, Sapinoso LM, Moqrich A, Patapoutian A, Hampton GM, Schultz PG, Hogenesch JB. Large-scale analysis of the human and mouse transcriptomes. Proc Natl Acad Sci USA. 2002;99:4465–4470. doi: 10.1073/pnas.012025199. [DOI] [PMC free article] [PubMed] [Google Scholar]
- Suzuki K, Hayashi T. cis-elements required for expression of human protein C inhibitor gene in HepG2 cells and its androgen-dependent expression in rat reproductive organs. Semin Thromb Hemost. 2000;26:75–83. doi: 10.1055/s-2000-9807. [DOI] [PubMed] [Google Scholar]
- Tone M, Kikuno R, Kume-Iwaki A, Hashimoto-Gotoh T. Structure of human alpha 2-plasmin inhibitor deduced from the cDNA sequence. J Biochem. 1987;102:1033–1041. doi: 10.1093/oxfordjournals.jbchem.a122141. [DOI] [PubMed] [Google Scholar]
- Xiao T, Hall H, Kizer KO, Shibata Y, Hall MC, Borchers CH, Strahl BD. Phosphorylation of RNA polymerase II CTD regulates H3 methylation in yeast. Genes Dev. 2003;17:654–663. doi: 10.1101/gad.1055503. [DOI] [PMC free article] [PubMed] [Google Scholar]
- Zhang W-H, Srihari R, Day RN, Schaufele F. CCAAT/Enhancer-binding protein alpha alters histone H3 acetylation at large subnuclear domains. J Biol Chem. 2001;276:40373–40376. doi: 10.1074/jbc.C100505200. [DOI] [PubMed] [Google Scholar]