
Figure 2. The effect of metformin on the lipogenic proteins.
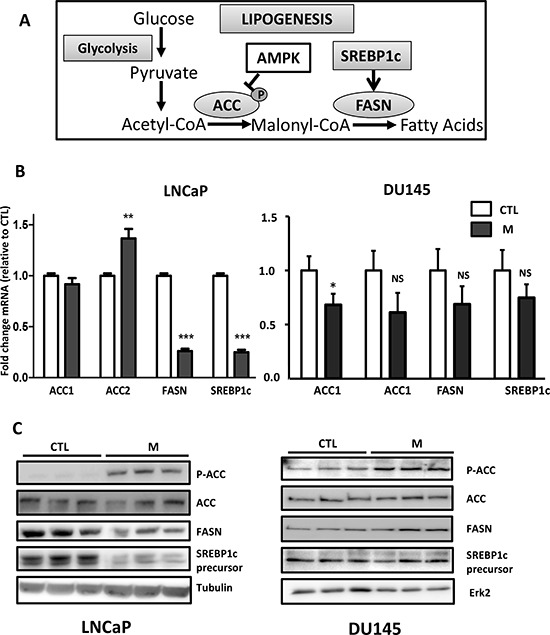
(A) A simplified schematic representation of lipogenesis. ACC: acetyl-CoA carboxylase, FASN: fatty acid synthase, AMPK: AMP activated protein kinase. (B) The cells were treated with 5 mM metformin (M) for 24 h, and the mRNA levels of ACC, FASN and SREBP1c were determined as described in the Materials and Methods section. **p < 0.01; ***p < 0.005. (C) An immunoblot of the indicated proteins in the cells treated with 5 mM metformin for 24 h (M). The blots are representative of three independent experiments.