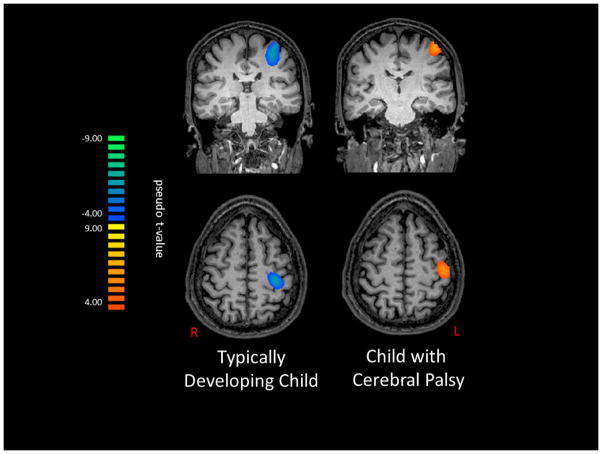
Figure 4.
Noise-normalized beamformer out image of the beta (18–34 Hz) response from 25 to 225 ms post-stimulation for a representative typically-developing (TD) child (left) and a child with cerebral palsy (CP; right). The map on the left shows voxels with pseudo-z values < −4.0, whereas as that on the right shows pseudo-z values > 4.0. As can be discerned, both the children with CP and the TD children exhibited activity clustered around the central sulcus and the postcentral gyrus, near the motor hand-knob feature in the hemisphere contralateral to stimulation. As shown, the TD children had a desynchronized response (blue) to the external tactile stimulation, while the children with CP had a synchronized response (orange). The images are displayed following the radiological convention (R=L).

