Abstract
Within single islets of Langerhans, the endocrine portion of the pancreas, intracellular metabolites, as well as insulin secretion, oscillates with a period of ~5 min. In vivo, pulsatile insulin oscillations are also observed with periods ranging from 5 – 15 minutes. In order for oscillations of insulin to be observed in vivo, the majority of islets in the pancreas must synchronize their output. It is known that populations of islets can be synchronized via entrainment of the individual islets to low amplitude glucose oscillations that have periods close to islets’ natural period. However, the range of glucose periods and amplitudes that can entrain islets has not been rigorously examined. To find the range of glucose periods that can entrain islets, a microfluidic system was utilized to produce and deliver a chirped glucose waveform to populations of islets while their individual intracellular [Ca2+] ([Ca2+]i) oscillations were imaged. Waveforms with amplitudes of 0.5, 1, and 1.5 mM above a median value of 11 mM were applied while the period was swept from 20 - 2 min. Oscillations of [Ca2+]i resonated the strongest when the period of the glucose wave was within 2 min of the natural period of the islets, typically close to 5 min. Some examples of 1:2 and 2:1 entrainment were observed during exposure to long and short glucose periods, respectively. These results shed light on the dynamic nature of islet behavior and may help to understand dynamics observed in vivo.
Introduction
The conventional view of glucose-stimulated insulin secretion includes metabolism of the sugar leading to an increase in the ATP/ADP ratio, closure of K+ATP channels, depolarization of the cell membrane, opening of voltage-dependent Ca2+ channels, and finally the secretion of insulin via Ca2+-dependent processes.1 Many of these factors are known to oscillate with periods of ~5 min including glucose and oxygen consumption, pyruvate kinase activity, NADH, ATP, intracellular Ca2+ ([Ca2+]i), and insulin secretion.2–5 Using mathematical modelling, these oscillations have been shown to result from oscillations in glucose metabolism.6
Oscillations of in vivo insulin levels with a similar (5 min) or slightly longer (10 – 12 min) period have been observed in rodents,7,8 dogs,9 monkeys,10 and humans11 indicating a synchronization of the thousands (rodents) or ~1 million (human) islets in the pancreas. These oscillations in hormone release are essential for proper insulin action in the liver12 and proper glucose uptake by peripheral tissues,13,14 underlying the importance of understanding the dynamics regulating this behaviour.
Recently, we have demonstrated that negative feedback of insulin onto glucose levels results in synchronization of an islet population producing ~5 min oscillations in the average [Ca2+]i and insulin secretion from the islet population.15 One of the key features of this model is that the negative feedback produces glucose oscillations, which then entrains all islets to the glucose oscillations, resulting in a synchronized population. Entrainment is a fundamental feature of nonlinear oscillators and it is defined here as the forcing of an oscillator to a periodic input.16 The oscillator response is determined by the amplitude and period of the forcing signal. Entrainment also depends upon the natural period (Tn) of the oscillator and its responsiveness to the forcing signal.17,18 In general, as the period of the forcing signal moves away from the Tn of the oscillator, larger amplitudes of the forcing signal are required for entrainment.
Entrainment can occur in numerous locking modes, generalized as n:m, indicating the number of oscillations of the forcing signal (n) to the number of oscillations of the entrained system (m).16 Several reports have shown 1:1 entrainment of insulin secretion pulses or [Ca2+]i by application of glucose pulses with a period close to the Tn of islets (~5 min).19–25 For example, we have used glucose oscillations with a 5 min period (Tglucose = 5 min) to entrain oscillations of [Ca2+]i and insulin secretion from single22,23 or groups24 of islets in a 1:1 manner. Recently, we demonstrated a range of Tglucose where islets were entrained in a 1:1 manner.15 In a different report, it was shown that islets can also undergo 1:2 entrainment, where a glucose wave with Tglucose = 10 min forced two oscillations of [Ca2+]i, NADPH, and mitochondrial membrane potential (Tn ~5 min).25 In the same report, entrainment of islets at a 3:7 mode was shown, demonstrating that it is possible to entrain at higher order modes, although the authors stated that it was difficult to confirm they were truly entrained at this higher mode.
In the examples above where 1:1 or 1:2 entrainment was observed, a single Tglucose was applied for the duration of the experiment. This type of experiment is beneficial in that one can observe the islet’s response for a long interval ensuring that the islet is truly entrained. The disadvantage of this type of experiment is that it is low throughput since only a single Tglucose is tested during each experiment. In this report, we set out to test if a higher throughput method could be used to test the entire range of Tglucose that can entrain islets. To perform this experiment, we used a microfluidic system to deliver a “chirped” glucose waveform, where Tglucose was swept over a period of time, while maintaining constant amplitude. The results indicated the islets entrained at a 1:1 mode when Tglucose ranged from 3 – 11 min, depending on the Tn of the islets. We also observed that the range of glucose periods that entrained the islets depended on the amplitude of the glucose waveform; lower amplitude glucose waves entrained a smaller range of periods while higher amplitudes entrained a larger range. When examining individual islets, higher order harmonics were occasionally observed, but not every islet showed this behaviour. The range of Tglucose that entrained islets was similar to what has been observed from application of a single glucose period, indicating that this method is viable for rapidly determining the entrainment region of islets. This method will be useful in investigating the dynamic nature of islets of Langerhans, which may lead to understanding the dynamics of pulsatile insulin secretion observed in vivo.
Materials and methods
Chemicals and reagents
NaCl, MgCl2, tricine, dimethyl sulfoxide (DMSO), fluorescein, and penicillin-streptomycin were purchased from Sigma (St. Louis, MO). CaCl2, KCl, and NaOH were purchased from EMD Chemicals (Gibbstown, NJ). Glucose (dextrose) and Cosmic Calf Serum were from Fisher Scientific (Pittsburgh, PA). Fura-2 acetoxymethyl ester (Fura-2 AM), Fura-2 calcium imaging calibration kit, and Pluronic F-127 were from Invitrogen (Carlsbad, CA). RPMI 1640 was from Mediatech (Manassas, VA). Collagenase P was purchased from Roche (Indianapolis, IN). Sylgard 184 elastomer kit for fabrication of polydimethylsiloxane (PDMS) microfluidic chips was from Dow Corning (Midland, MI). All solutions were prepared in Milli-Q (Millipore, Bedford, MA) 18 MΩ deionized water. The balanced salt solution (BSS) used in all experiments was composed of 125 mM NaCl, 2.4 mM CaCl2, 1.2 mM MgCl2, 5.9 mM KCl, 25 mM tricine, and made to pH 7.4 with either 3 or 13 mM of glucose.
Preparation of islets
Islets of Langerhans were isolated from male CD-1 mice (25 – 40 g) as described previously.15 The protocol for isolation of islets was in compliance with institutional guidelines and approval was obtained from Florida State University’s Animal Care and Use Committee (protocol 1235). Isolated islets were incubated in RPMI-1640 media containing 11 mM glucose, L-glutamine, 10% Cosmic Calf Serum, 1% penicillin/streptomycin, and 0.1% gentamicin at 37 °C and 5% CO2. For dye loading, 2.0 μL of 2.5 mM fura-2 AM in DMSO and Pluronic F-127 was added to 2 mL of RPMI 1640 with 11 mM glucose and L-glutamine. Groups of 5 – 10 islets were incubated in this solution for 40 min at 37 °C and 5% CO2 and were then removed and placed in the microfluidic device where they were rinsed with BSS containing 3 mM glucose for 5 min before experiments commenced.
Microfluidic device operation and fluorescence detection
A microfluidic device was fabricated using conventional photolithography techniques. The PDMS-glass hybrid device consisted of channels with dimensions of 250 x 40 μm (width x height) and was used to produce glucose oscillations in a similar manner as described earlier.15 The device was placed on the stage of a Nikon Eclipse Ti inverted fluorescence microscope (Nikon Instruments, Melville, NY) equipped with a 10X, 0.5 NA objective. Fura-2 was excited sequentially at 340 and 380 nm for 150 ms each, using a light source equipped with a shutter and integrated filter wheel (Lambda XL, Sutter Instrument Novato, CA). Image pairs were collected every 5 s. Emission light was passed through a 510 ± 20 nm emission filter, and was captured on a Cascade CCD from Photometrics (Tuscon, AZ). Image acquisition and filter wheel positioning was automated using NIS Elements software (Nikon Instruments). The ratio of fluorescence intensity that was excited at 340 nm to that at 380 nm (F340/F380) for all islets were obtained and converted to [Ca2+]i using predetermined calibration values that were found by standard methods.26
Experimental protocol and data analysis
Groups of islets were stimulated with a basal glucose concentration of 3 mM followed by constant 11 mM glucose. Tn was calculated from the [Ca2+]i oscillations observed during exposure to the constant 11 mM glucose. A chirped waveform was then applied at amplitudes of 0.5, 1, or 1.5 mM. The linear chirp waveform delivered to the islets was determined from the equation:
where y(t) was the glucose concentration (in mM) as a function of time, t (in min); A was the amplitude of the glucose wave (in mM); P0 and P1 were the initial and final periods of the glucose wave (in min), respectively; T was the duration of the chirp signal (in min). For all experiments, T was kept constant at 60 min.
For data analysis, [Ca2+]i traces from islets were averaged and a linear regression was used to fit the data. To ensure the results were representative, the islets used in the analyses were from different mice. The linear fit of the [Ca2+]i was subtracted from the data to remove the offset of the average [Ca2+]i above baseline prior to producing spectrograms via a custom LabVIEW program (National Instruments, Austin, TX) using a short-time Fourier transform algorithm. Briefly, 256 points from the average and subtracted [Ca2+]i trace were subjected to a short-time Fourier transform using a Hanning window that binned the output into 512 frequency bins. The window was then moved by 5 data points and another 256 points were analysed. The results were plotted in MATLAB (MathWorks, Natick, MA). For data representation, all frequencies were converted to periods (in min). In any figures that show [Ca2+]i traces, the non-processed traces are shown.
Results and discussion
A recent report demonstrated 1:2 entrainment of the metabolic oscillator within an islet when a glucose wave with a 10 min period was applied.25 In the same report, an example of an islet entrained at a 3:7 mode was provided when a 10 min glucose wave was applied. A further examination of the various modes that islets may be entrained would be useful for understanding the dynamics of hormone secretion.
The use of chirped forcing signals to examine frequency-dependent behaviour in systems has been shown in several reports, for example, finding the membrane resonance of pacemaker neurons27 and finding resonant frequencies of micromechanical oscillators.28 The use of a chirped wave would allow faster testing of the range of glucose periods that can entrain islets and may allow the observation of higher order entrainment modes.
Microfluidic system
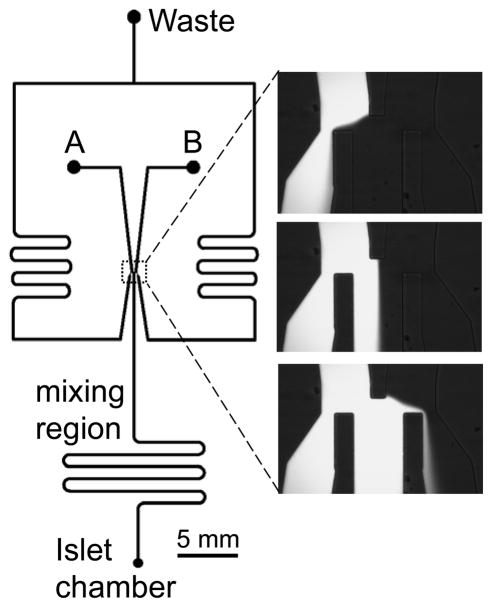
The microfluidic system we used for performing these assays was similar to those we have developed for applying glucose waves with a constant period to islets of Langerhans.15,23 The two inputs of the device were connected to syringes that contained BSS with 3 and 15 mM glucose (Fig. 1). The height of one of the syringes was controlled using a stepper motor while the other syringe was connected, via a pulley and a fixed length of cord, to the first syringe. This system allowed a coupled movement of the two syringes; as the height of the first syringe was moved, the height of the other syringe moved in an equal, but opposite, direction, ensuring a constant total flow rate into the device. The two input solutions were directed to a flow splitting region where the central outlet channel was directed to the islets and the two side channels were connected to waste. The two glucose solutions entered the central channel in a ratio determined from the two input flow rates, which was controlled by the height of the two solutions. As an example, equal syringe heights produced equal flow rates from the two syringes and therefore, the two solutions entered the central channel in a 1:1 ratio. The heights of the syringes were calibrated to the flow rate ratio prior to experiments using fluorescein.15,23
Fig. 1. Microfluidic device design.
The design of the microfluidic chip is shown on the left side of the figure. The points labelled “A” and “B” were used as inputs for BSS containing 3 and 13 mM glucose, respectively. The flow rates from these two inputs were set by the heights of their respective solutions above the microfluidic system. At the flow-splitting region, outlined by the dashed box, the input solutions were split to three outlets; the two outlets on the side were sent to a “Waste” reservoir while the centre outlet was sent to the “Islet chamber”. The ratio of the two solutions entering the middle outlet was dictated by the flow rate ratio of the two input solutions. Because the two input solutions were connected via a pulley and fixed length of cord, the total flow rate entering the centre channel remained constant. On the right side of the figure are photographs taken of the flow-splitting region when fluorescein and buffer were being input to the system. The top image shows when the buffer had a higher flow rate than fluorescein; the middle image shows when the two solutions had equal flow rates; the bottom image shows when fluorescein had a higher flow rate than the buffer solution. The two solutions entering the centre outlet mixed to homogeneity prior to delivery to the islet chamber.
The solutions that entered the central channel mixed to homogeneity prior to entering the islet chamber. The mixing time for the solutions must be long enough for mixing to complete, yet as small as possible to ensure minimal attenuation of the waveforms being delivered. A total flow rate of 1.5 μL min−1 was used, which enabled a 30 s mixing time, enough for complete mixing of the two solutions, while minimizing dispersion. Using a similar approach as we have described before,22 we determined the shortest waveform period that the device could generate without significant amplitude attenuation and found that it was 20 s. During the islet experiments, we were always well above this value, the shortest Tglucose applied was 2 min, therefore, there was minimal dispersion of the glucose waves in the device prior to delivery to the islet chamber.
Chirp at 1 mM glucose amplitude
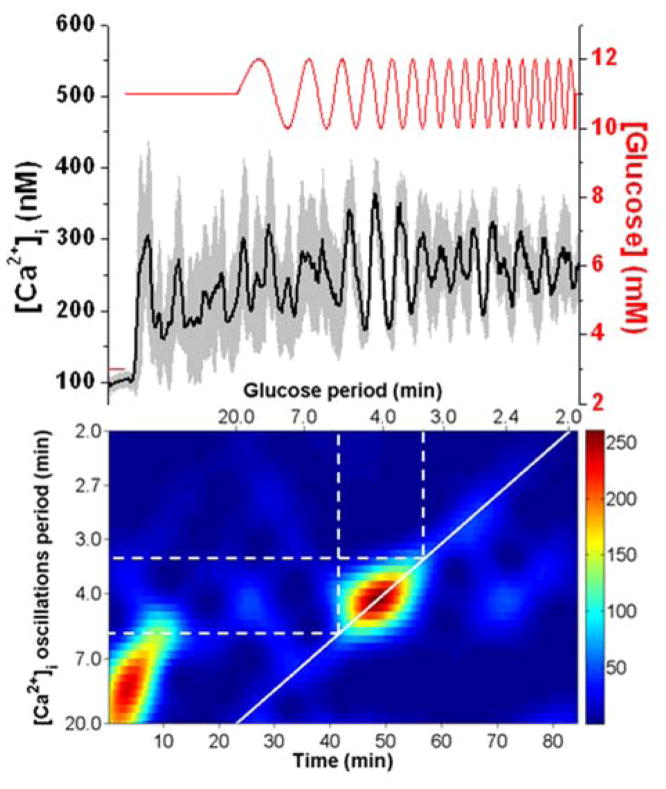
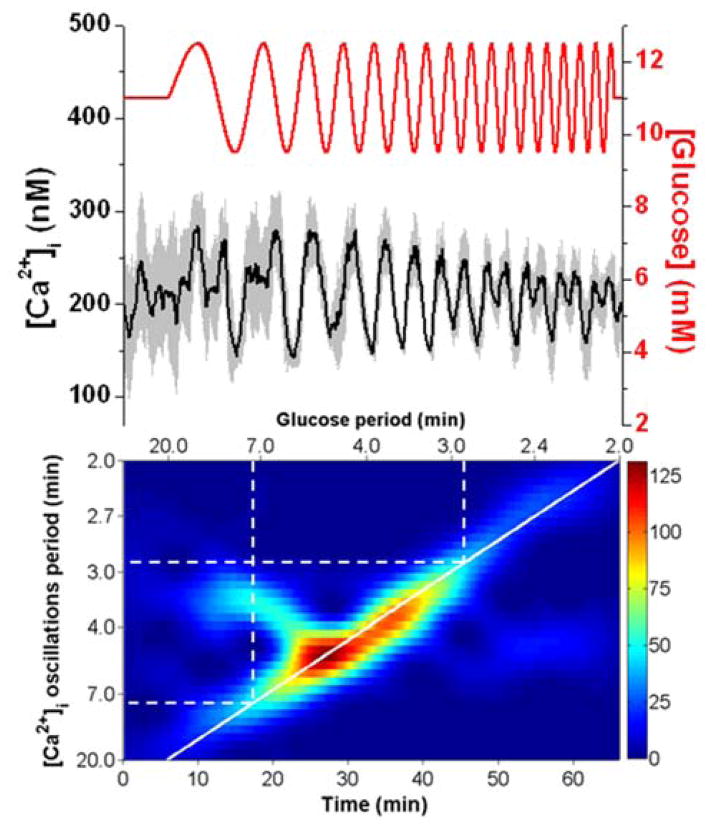
In the first set of experiments, a linear chirp was applied where Tglucose was swept from 20 to 2 min with a constant 1 mM amplitude. At the top of Fig. 2, the average [Ca2+]i from 7 islets (black line) exposed to a chirped glucose waveform is shown with the glucose level (red line) superimposed. The glucose level corresponds to the right y-axis, while the [Ca2+]i corresponds to the left y-axis. A spectrogram is shown below the [Ca2+]i trace and details the periods of the [Ca2+]i oscillations on the left y-axis as a function of time (bottom x-axis) or as a function of the applied Tglucose (top x-axis). The scale bar adjacent to the spectrogram indicates the magnitude of the spectrogram peaks with red corresponding to the highest and blue corresponding to the lowest. The thick solid white line overlaid on the spectrogram corresponds to how Tglucose was swept in time. This line enables an easy evaluation for when the [Ca2+]i periods matched the glucose periods, as expected for 1:1 entrainment.
Fig. 2. Entrainment of islets using a 20 to 2 min chirped glucose waveform at 1 mM amplitude.
The top shows the average [Ca2+]i response (black line) from 7 islets with error bars corresponding to ± 1 SD. The applied glucose concentration (red line) is shown on the right y-axis. The spectrogram of the average [Ca2+]i trace is shown on the bottom with the experimental time scale on the bottom x-axis, the period of the glucose wave on the top x-axis, and the measured [Ca2+]i oscillation period on the left y-axis. The scale bar for the spectrogram is shown on the right of the figure with red being the largest magnitude and blue being the smallest. The solid white line corresponds to how the period of the applied glucose wave was swept in time. The dashed white lines are used to indicate the region of entrainment from 5.4 to 3.4 min.
As seen in the spectrogram, a large magnitude event occurred during the first 10 min of the experiment, which is attributed to the initial response of the islets to the change from 3 to 11 mM glucose. This initial synchronization of a group islets to a change in glucose level has been observed elsewhere as well.24,29 The 11 mM glucose was then applied continuously from 3 – 23 minutes and the islets oscillated at their individual Tn, resulting in an average [Ca2+]i that was elevated, but had no major frequency components as seen in the spectrogram. The average Tn of the seven islets was 4 min.
At 23 min, the chirp was initiated and a clear resonance of the average [Ca2+]i oscillations were observed from 41 – 56 min. As shown by the dashed white lines in the spectrogram, these times corresponded to when the glucose period was swept from 5.4 - 3.4 min. The resonance can also be observed in the average [Ca2+]i trace, with strong coherent oscillations in the population during this time. We interpret this result as the islet population being entrained in a 1:1 manner by the various glucose periods that were applied during this time, resulting in a synchronized response by the population. After this time, the average [Ca2+]i was no longer entrained to the glucose periods.
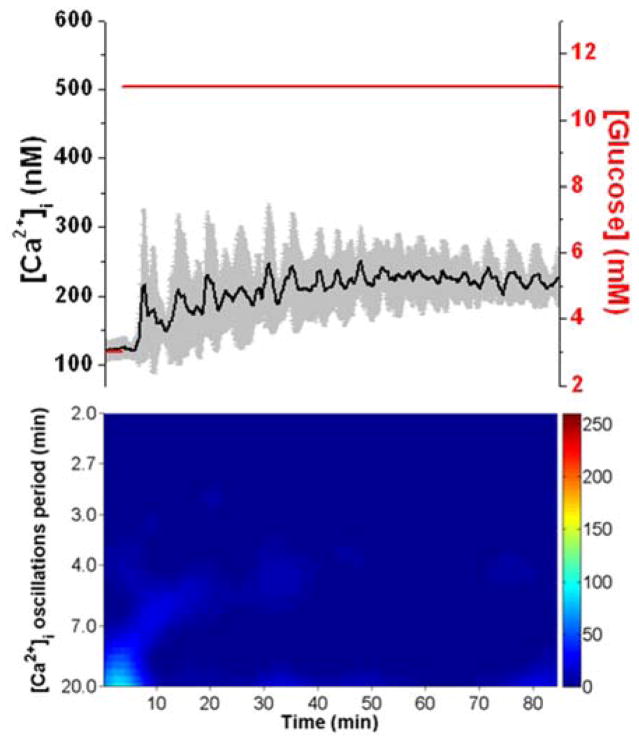
As a control experiment, the response of 7 islets exposed to a constant glucose level for the duration of the experiment is shown in Fig. 3. Again, the average [Ca2+]i with its corresponding spectrogram is shown. As can be seen, there were no major components in the spectrogram. These results indicate that without the glucose waveform, the islet population never synchronized.
Fig. 3. Response to constant glucose level.
The top shows the average (black line) and ± 1 SD of the [Ca2+]i for 7 islets exposed to a constant glucose level (red) throughout the experiment. The spectrogram of the average [Ca2+]i is shown below and does not show any major frequency component. The scale of the spectrogram is the same as that in Fig. 2.
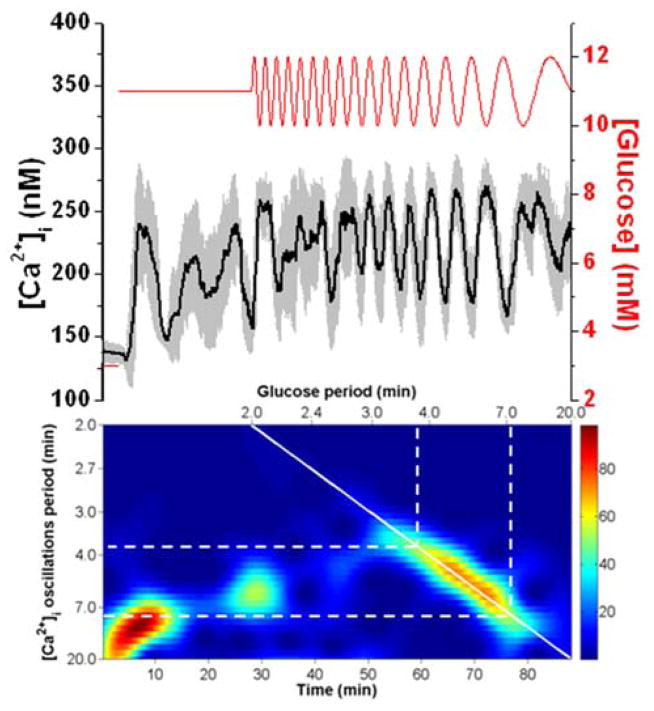
In another set of experiments, a chirped waveform was applied in the opposite direction as Fig. 2, where Tglucose was swept from 2 to 20 min, again with 1 mM amplitude. At the top of Fig. 4 is the average [Ca2+]i trace from 7 islets, while the spectrogram is shown on the bottom. The chirped waveform was started 25 min after the glucose level was switched to 11 mM. Similar to Fig. 2, a large 1:1 resonance was observed with periods of the [Ca2+]i oscillations from 3.7 – 7.6 min, slightly longer than those observed in the experiment shown in Fig. 2. One explanation for this slight discrepancy in the periods that were entrained was that the average Tn of the islets shown in Fig. 2 was 4 min, while the average Tn for the islets in Fig. 4 was 8 min. In both cases, the islets entrained within ~2 min of Tn. From 25 – 30 min, there was a response observed in the spectrogram that corresponded to delivery of glucose periods from 2.2 - 2 min and produced [Ca2+]i oscillation periods from 7 - 5 min. While it is possible that this pertains to 3:1 entrainment, it is more likely an artefact of the change in the glucose level from constant to oscillatory.
Fig. 4. A chirped glucose wave from 2 to 20 min with 1 mM amplitude.
The experiment shown is the application of a chirped waveform with the period of the glucose increasing from 2 to 20 min. The average ± 1 SD [Ca2+]i from 7 islets and its corresponding spectrogram are shown on the top and bottom, respectively. The lines on the spectrogram are similar to those described for Fig. 2.
Chirp with other amplitudes
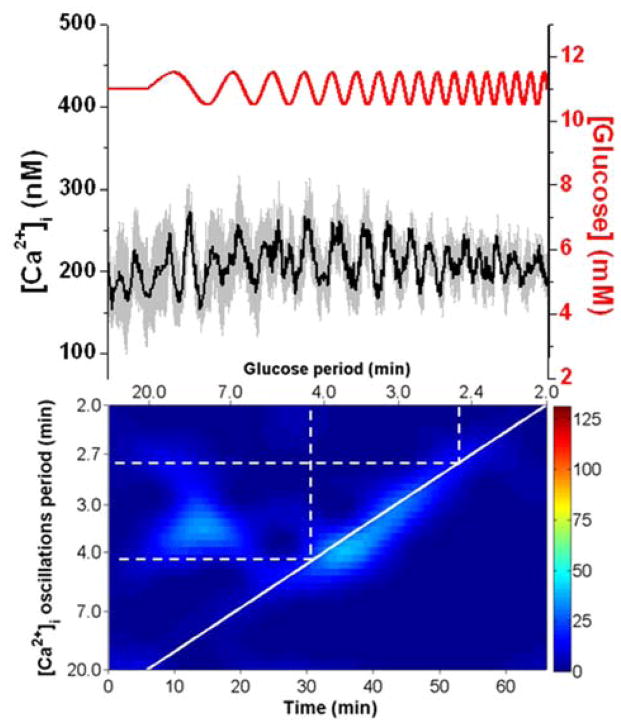
Chirping with 1.5 and 0.5 mM amplitude glucose waves (Fig. 5 and 6, respectively) were used in an attempt to observe how the amplitude of the forcing signal affected the entrainment region. It is expected that higher amplitude forcing signals will result in a larger range of glucose periods that can entrain.16 Islets exposed to the 1.5 mM amplitude waveform showed 1:1 entrainment when Tglucose was swept from 7.2 - 2.9 min. The average Tn for this group of islets was 5.3 min. This range of glucose oscillations was indeed larger than the ranges we found that were entrained using 1 mM amplitude. Groups of islets tested with a lower amplitude chirp signal were more difficult to entrain. A 0.5 mM amplitude chirp (Fig. 6) resulted in a low magnitude resonance across the 1:1 entrainment region when Tgluocse was swept from 4.2 - 2.6 min. The average Tn was 3.3 min. These results are consistent with the expected effects of the amplitude of the forcing signal on the range of periods that can be entrained. We did not examine other amplitudes because there was a chance that the nadir of the forcing signal wave would turn off the oscillator instead of merely modifying it.
Fig. 5. Entrainment of islets using a chirped glucose waveform at 1.5 mM amplitude.
The average ± 1 SD [Ca2+]i from 6 islets is shown at the top of the figure. The data is shown starting with a glucose concentration of 11 mM for 6 min followed by a 60 min chirped wave. Similar to Fig. 2, the period of the waveform was swept from 20 - 2 min, but a 1.5 mM amplitude was used. The islets were entrained 1:1 between 7.2 and 2.9 min (dashed white lines).
Fig. 6. A chirped glucose wave at 0.5 mM amplitude.
The average ± 1 SD [Ca2+]i from 5 islets is shown in the upper trace. A chirped glucose wave was applied that swept the periods from 20 - 2 min with 0.5 mM amplitude. The entrained region was observed between 4.2 – 2.6 min.
Observation of other entrainment regions (n:m)
While 1:1 entrainment was readily observed in most experiments, higher order entrainment modes were more rarely found. We attribute this to the averaging of the [Ca2+]i traces across multiple islets. Initially, we attempted to analyse the data from single islets; however, the spectrograms showed the initial Tn and then a slight drift to the entrainment period. This subtle change in the spectrogram complicated the analysis. By averaging multiple islets, the individual Tn’s were averaged out and only the entrained periods were observed. Of course, this averaging also removed some information, including the observation of n:m entrainment regions.
For example, Fig. 7A details the [Ca2+]i and spectrogram from a single islet that was included in the averaging used to produce Fig. 2. As can be seen, the islet was oscillating during the constant glucose period with a period of ~4 min. As the chirped wave was initiated, the [Ca2+]i oscillations shifted to the 1:1 entrainment region from ~27 – 45 min. After this time, the spectrogram shows that the frequency switched from 1:1 to 2:1 entrainment (the lower white line shown in the spectrogram). This splitting can be seen in the [Ca2+]i trace; at 45 min, two [Ca2+]i oscillations begin to combine, and then appear as single oscillations for every two glucose oscillations through the end of the experiment, corresponding to 2:1 entrainment. We observed 2:1 entrainment in 4/7 islets exposed to 1 mM glucose amplitude oscillations, 4/6 islets exposed to 1.5 mM glucose oscillations, and 0/5 islets exposed to 0.5 mM glucose oscillations. In Fig. 7B, another example of unique behaviour from a single islet is shown. In contrast to that shown in Fig. 7A, this islet entrained 1:1 for almost the entire duration of the experiment, from 13 – 65 min, corresponding to glucose periods from 9.8 - 2.0 min. The islet had a small Tn (~3 min), which may have allowed it to respond to the small glucose periods at the end of the experiment.
Fig. 7. Single islet entrainment data.
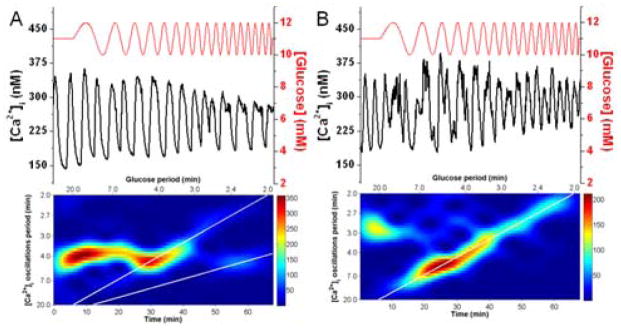
Two [Ca2+]i traces and their corresponding spectrograms from single islets are shown where the glucose period was swept from 20 - 2 min at a 1 mM amplitude. In (A) the islet had a Tn ~4 min and was entrained 1:1 from 27 - 45 min as seen by the [Ca2+]i oscillation period following the upper white line. The lower white line corresponds to 2:1 entrainment and the islet follows this line from 55 – 62 min. The spectrogram in (B) shows that the islet had a Tn ~3 min and upon application of the chirped wave, followed the 1:1 line from 13 – 65 min, corresponding to glucose periods of 9.8 - 2.0 min.
Conclusions
In general, islets were entrained to a 1:1 mode when glucose periods were within a range of ± 2 min of Tn. The range of periods that entrained islets were in proportion to the amplitude of the forcing signal with slightly larger and smaller ranges observed with 1.5 and 0.5 mM amplitude waves, respectively. When individual islets were examined, both 1:2 and 2:1 modes were observed, which confirms a previously reported observation of 1:2 entrainment of islets.25 As has been previously indicated,25 other entrainment modes in islets have been observed, but these are rare and difficult to confirm. For example, we observed numerous other locking modes when applying a constant glucose period to single islets, including 3:1, 5:3, 3:2, 4:3, 3:4, 2:3, 2:5, and 1:3, but these were very rare and so could not be confirmed that they were truly entrained.
It is feasible that the chirped waveform did not allow the islets to entrain at higher order modes due to the limited observation window at each period. In the future, modifications to the chirp rate or an exponentially modified chirp signal could be used to test this theory. However, within the caveats of this experiment, we found that a chirped wave was an efficient means to observe the dynamic behavior of islets. The results shown here could also be used as an opportunity to test the dynamic response of mathematical models of islets. Periodic inputs to cells have been shown to be an effective way to build and discern differences in mathematical models,30,31 and it would be expected that islet models exposed to chirped glucose waves would produce similar responses to what we have observed.
Acknowledgments
This work was supported in part by a grant from the National Institutes of Health (R01 DK080714).
References
- 1.Newsholme P, Gaudel C, McClenaghan NH. Adv Exp Med Biol. 2010;654:91–114. doi: 10.1007/978-90-481-3271-3_6. [DOI] [PubMed] [Google Scholar]
- 2.Longo EA, Tornheim K, Deeney JT, Varnum BA, Tillotson D, Prentki M, Corkey BE. J Biol Chem. 1991;266:9314–9319. [PubMed] [Google Scholar]
- 3.Gilon P, Shepherd RM, Henquin JC. J Biol Chem. 1993;268:22265–22268. [PubMed] [Google Scholar]
- 4.Kennedy RT, Kauri LM, Dahlgren GM, Jung SK. Diabetes. 2002;(Suppl 1):S152–161. doi: 10.2337/diabetes.51.2007.s152. [DOI] [PubMed] [Google Scholar]
- 5.Merrins MJ, Van Dyke AR, Mapp AK, Rizzo MA, Satin LS. J Biol Chem. 2013;288:33312–33322. doi: 10.1074/jbc.M113.508127. [DOI] [PMC free article] [PubMed] [Google Scholar]
- 6.Bertram R, Sherman A, Satin LS. Am J Physiol Endocrinol Metab. 2007;293:E890–E900. doi: 10.1152/ajpendo.00359.2007. [DOI] [PubMed] [Google Scholar]
- 7.Nunemaker CS, Wasserman DH, McGuinness OP, Sweet IR, Teague JC, Satin LS. Am J Physiol Endocrinol Metab. 2006;290:E523–E529. doi: 10.1152/ajpendo.00392.2005. [DOI] [PubMed] [Google Scholar]
- 8.Matveyenko AV, Veldhuis JV, Butler PC. Am J Physiol Endocrinol Metab. 2008;295:E569–E574. doi: 10.1152/ajpendo.90335.2008. [DOI] [PMC free article] [PubMed] [Google Scholar]
- 9.Pørksen N, Munn S, Steers J, Vore S, Veldhuis J, Butler P. Am J Physiol Endocrinol Metab. 1995;269:E478–E488. doi: 10.1152/ajpendo.1995.269.3.E478. [DOI] [PubMed] [Google Scholar]
- 10.Goodner CJ, Hom FG, Koerker DJ. Science. 1982;215:1257–1260. doi: 10.1126/science.7036347. [DOI] [PubMed] [Google Scholar]
- 11.Song SH, McIntyre SS, Shah H, Veldhuis VD, Hayes PC, Butler PC. J Clin Endocrinol Metab. 2000;85:4491–4499. doi: 10.1210/jcem.85.12.7043. [DOI] [PubMed] [Google Scholar]
- 12.Matveyenko AV, Liuwantara D, Gurlo T, Kirakossian D, Dalla Man C, Cobelli C, White MF, Copps KD, Volpi E, Fujita S, Butler PC. Diabetes. 2012;61:2269–2279. doi: 10.2337/db11-1462. [DOI] [PMC free article] [PubMed] [Google Scholar]
- 13.Matthews DR, Naylor BA, Jones RG, Ward GM, Turner RC. Diabetes. 1983;32:617–621. doi: 10.2337/diab.32.7.617. [DOI] [PubMed] [Google Scholar]
- 14.Paolisso G, Scheen AJ, Giugliano D, Sgambato S, Albert A, Varricchio M, D’Onofrio F, Lefèbvre PJ. J Clin Endocrinol Metab. 1991;72:607–615. doi: 10.1210/jcem-72-3-607. [DOI] [PubMed] [Google Scholar]
- 15.Dhumpa R, Truong TM, Wang X, Bertram R, Roper MG. Biophys J. 2014;106:2275–2282. doi: 10.1016/j.bpj.2014.04.015. [DOI] [PMC free article] [PubMed] [Google Scholar]
- 16.Pikovsky A, Rosenblum M, Kurths J. In: Synchronization: A universal concept in nonlinear sciences. Chirikov B, Moss F, Cvitanović P, Swinney H, editors. Cambridge University Press; New York: 2001. [Google Scholar]
- 17.Roenneberg T, Dragovic Z, Merrow M. Proc Natl Acad Sci U S A. 2005;102:7742–7747. doi: 10.1073/pnas.0501884102. [DOI] [PMC free article] [PubMed] [Google Scholar]
- 18.Fendler B, Zhang M, Satin L, Bertram R. Biophys J. 2009;97:722–729. doi: 10.1016/j.bpj.2009.05.016. [DOI] [PMC free article] [PubMed] [Google Scholar]
- 19.Ritzel RA, Veldhuis JD, Butler PC. Am J Physiol Endocrinol Metab. 2006;290:E750–E756. doi: 10.1152/ajpendo.00381.2005. [DOI] [PubMed] [Google Scholar]
- 20.Pørksen N, Juhl C, Hollingdal M, Pincus SM, Sturis J, Veldhuis JD, Schmitz O. Am J Physiol Endocrinol Metab. 2000;278:E162–E170. doi: 10.1152/ajpendo.2000.278.1.E162. [DOI] [PubMed] [Google Scholar]
- 21.Sturis J, Pugh WL, Tang J, Ostrega DM, Polonsky JS, Polonsky KS. Am J Physiol. 1994;267:E250–E259. doi: 10.1152/ajpendo.1994.267.2.E250. [DOI] [PubMed] [Google Scholar]
- 22.Zhang X, Grimley A, Bertram R, Roper MG. Anal Chem. 2010;82:6704–6711. doi: 10.1021/ac101461x. [DOI] [PMC free article] [PubMed] [Google Scholar]
- 23.Yi L, Wang X, Dhumpa R, Schrell AM, Mukhitov N, Roper MG. Lab Chip. 2015;15:823–832. doi: 10.1039/c4lc01360c. [DOI] [PMC free article] [PubMed] [Google Scholar]
- 24.Zhang X, Daou A, Truong TM, Bertram R, Roper MG. Am J Physiol Endocrinol Metab. 2011;301:E742–E747. doi: 10.1152/ajpendo.00248.2011. [DOI] [PMC free article] [PubMed] [Google Scholar]
- 25.Pedersen MG, Mosekilde E, Polonsky KS, Luciani DS. Biophys J. 2013;105:29–39. doi: 10.1016/j.bpj.2013.05.036. [DOI] [PMC free article] [PubMed] [Google Scholar]
- 26.Grynkiewicz G, Poenie M, Tsien RY. J Biol Chem. 1985;260:3440–3450. [PubMed] [Google Scholar]
- 27.Tohidi V, Nadim F. J Neurosci. 2009;29:6427–6435. doi: 10.1523/JNEUROSCI.0545-09.2009. [DOI] [PMC free article] [PubMed] [Google Scholar]
- 28.Zalautdinov M, Aubin KL, Pandey M, Zehnder AT, Rand RH, Craighead HG, Parpia JM, Houston BH. Appl Phys Lett. 2003;83:3281–3283. [Google Scholar]
- 29.Zhang M, Fendler B, Peercy B, Goel P, Bertram R, Sherman A, Satin L. Biophys J. 2008;95:4676–4688. doi: 10.1529/biophysj.107.125088. [DOI] [PMC free article] [PubMed] [Google Scholar]
- 30.Mettetal JT, Muzzey D, Gómez-Uribe C, van Oudenaarden A. Science. 2008;319:482–484. doi: 10.1126/science.1151582. [DOI] [PMC free article] [PubMed] [Google Scholar]
- 31.Jovic A, Howell B, Cote M, Wade SM, Mehta K, Miyawaki A, Neubig RR, Linderman JJ, Takayama S. PLoS Comput Biol. 2010;6:e1001040. doi: 10.1371/journal.pcbi.1001040. [DOI] [PMC free article] [PubMed] [Google Scholar]


