

Abstract
Homeostatic regulation of REM sleep plays a key role in neural plasticity and deficits in this process are implicated in the development of many neuropsychiatric disorders. Little is known, however, about the molecular mechanisms that underlie this homeostatic regulation process. This study examined the hypothesis that, during selective REM sleep deprivation (RSD), increased brain-derived neurotrophic factor (BDNF) expression in REM sleep regulating areas is critical for the development of homeostatic drive for REM sleep, as measured by an increase in the number of REM sleep transitions. Rats were assigned to RSD, non-sleep deprived (BSL), or total sleep deprivation (TSD) groups. Physiological recordings were obtained from cortical, hippocampal, and pontine EEG electrodes over a 6-hour period, in which sleep deprivation occurred during the first 3 hours. In the RSD, but not the other conditions, homeostatic drive for REM sleep increased progressively. BDNF protein expression was significantly greater in the pedunculopontine tegmentum (PPT) and subcoeruleus nucleus (SubCD) in the RSD as compared to the TSD and BSL groups, areas that regulate REM sleep, but not in the medial preoptic area, which regulates non-REM sleep. There was a significant positive correlation between RSD-induced increases in number of REM sleep episodes and increased BDNF expression in the PPT and SubCD. These increases positively correlated with levels of homeostatic drive for REM sleep. These results, for the first time, suggest that selective RSD-induced increased expression of BDNF in the PPT and SubCD are determinant factors in the development of the homeostatic drive for REM sleep.
Keywords: Brainstem, BDNF, homeostatic regulation, selective REM sleep deprivation, pedunculopontine tegmentum, dorsal subcoeruleus nucleus
1. Introduction
Rapid eye movement (REM) sleep in mammals is regulated so that daily amounts are relatively invariant and any losses are promptly and precisely compensated [1]. REM sleep rebound following REM sleep deprivation (RSD) is a well-documented phenomenon, and studies have shown that the increase in REM sleep during recovery is in fact directly proportional to the amount of REM sleep lost in RSD [2–4]. Additionally, during selective RSD there are progressively more frequent attempts at transitioning into REM sleep, an indication of the strong homeostatic drive for REM sleep [4]. These findings are consistent with the belief that homeostatic regulatory processes control daily amounts of REM sleep. A number of studies have suggested that the mechanism that regulates REM sleep homeostasis is critical for the development, maturation, and plasticity of the brain and deficits in this regulation are associated with a number of neurological and psychiatric disorders [5–13]. Despite the functional significance of REM sleep homeostatic regulation, our understanding of the cellular and molecular mechanisms of this regulation remains incomplete.
Over the last decade, considerable progress has been made in identifying specific cell types and brain areas involved in the generation of REM sleep, including cholinergic cells in the pedunculopontine tegmentum (PPT) as well as glutamatergic cells in the medial pontine reticular formation (mPRF) and dorsal subcoeruleus nucleus (SubCD) [6, 7, 14–16]. It has also been demonstrated that the generation of REM sleep involves kainate receptor mediated activation of PPT cholinergic cells and subsequently the activation of intracellular cAMP-dependent PKA signaling [17, 18]. However, the REM sleep homeostatic regulatory mechanism within this REM sleep generating network has yet to be identified.
It has been shown that during selective RSD, not only does the homeostatic drive for REM sleep increase, but both the total percentage of time spent in non-REM sleep and cortical slow-wave activity (SWA; electroencephalogram power between 0.5 and 4 Hz) increase progressively as well [4]. It has been demonstrated that increases in non-REM sleep and SWA after total sleep deprivation (TSD) occur only after postnatal day 20, precisely the time at which sleep deprivation begins to induce BDNF expression in the brain [19, 20]. Increased endogenous BDNF has also been shown to be responsible for increased SWA during recovery non-REM sleep after TSD [21]. Therefore, the present study evaluated the hypothesis that during selective RSD, locally increased BDNF expression in the REM sleep regulating areas of the brainstem is critical for the development of homeostatic drive for REM sleep. The results of this study demonstrate, for the first time, that RSD-induced BDNF expression in the PPT and SubCD is critical for the homeostatic regulation of REM sleep.
2. Materials and methods
2.1. Subjects and housing
Experiments were performed on adult male Wistar rats (Charles River, Wilmington, MA) weighing between 200 and 300 gm. The rats were housed individually at 24°C with free access to food and water. Lights were on from 7:00 a.m. to 7:00 p.m. (light cycle) and off from 7:00 p.m. to 7:00 a.m. (dark cycle). Experiments were performed in accordance with the NIH Guide for the Care and Use of Laboratory Animals and were approved by the Institutional Animal Care and Use Committees (Boston University: protocol # AN-14084 and The University of Tennessee: protocol #2311-1214-UTK). Additional care was taken to ensure that any potential discomfort was eliminated, and the numbers of animals used were minimized. To reduce additional stress that might be imposed by experimental handling, animals were gently handled daily for 15–20 min between 9:00 a.m. and 10:00 a.m. Habituation handling began one week prior to surgery and continued until the recording sessions.
2.2. Surgical procedures for electrode implantation
All surgical procedures were performed stereotaxically under aseptic conditions. Animals were anesthetized with pentobarbital (40 mg/kg, i.p; Ovation Pharmaceuticals, Deerfield, IL, USA), placed in the stereotaxic apparatus, and secured using blunt rodent ear bars, as described elsewhere [22]. To record behavioral states of vigilance, cortical electroencephalogram (EEG), dorsal neck muscle electromyogram (EMG), hippocampal EEG (to record theta wave activity), and pontine EEG (to record P-wave activity) recording electrodes were chronically implanted in the rats, as described previously [23]. All electrodes were secured to the skull with dental acrylic, and the electrodes were then crimped to mini-connector pins and brought together in a plastic connector. Upon completion of the surgical procedure, animals were administered saline (5 cc, s.c.) to prevent dehydration, ampicillin (50 mg/rat, i.m.; Bristol-Myers Squibb Company, Princeton, NJ, USA) to control potential post-surgical infection, and buprenorphine (0.05 mg/kg, s.c; Ben Venue Laboratories, Bedford, OH, USA) to control potential post-operative pain.
2.3. Polygraphic recordings and sleep deprivation setup
To record cortical, hippocampal, and pontine EEG and neck muscle EMG in free-moving conditions, each head plug was mated to a commutator. Signals from the commutator went to a polygraph (Grass Model 15 Neurodata Amplifier System, Astro-Med, Inc., West Warwick, RI, USA), located in the next room, via its electrode board (located inside the recording chamber). To allow rats to move freely inside the recording cage while maintaining the head plug connection, a counterbalanced connecting cable and a mechanical pulley system (attached to the roof of the recording chamber) were used. In a separate room, polygraphic signs of the rat were continuously observed on a computer monitor to identify ongoing wake-sleep stages [24–26].
For selective REM sleep deprivation (RSD), the beginning of each REM sleep episode was identified by observation of ongoing polygraphic records. From the room adjacent to the rat, the experimenter pressed a mechanical lever within 2–3 seconds of REM sleep onset, the animal’s head was gently lifted and the animal was awakened. A detailed description and validation of this selective REM sleep deprivation method is described in an earlier publication [25]. One of the important advantages of this REM sleep deprivation method is that it successfully eliminates >75% of REM sleep without significantly reducing non-REM sleep. To interrupt sleep episodes during total sleep deprivation (TSD) protocols, rats were subjected to gentle arousing stimuli (tapping on the cage and/or slight movement of the cage) within 3–5 seconds of the onset of polygraphic signs of non-REM sleep. Animals were subjected to the arousing stimuli as often as necessary to maintain wakefulness (W) within the entire TSD period. During this TSD protocol, animals never exhibited appearance of REM sleep episodes.
2.4. Adaptation recording session
After 3–7 days of post-surgical recovery time, rats were habituated to the experimenter, the sound-attenuating recording cage (76.2 × 45.7 × 45.7 cm), and free-moving polygraphic recording (Grass Model 15 Neurodata Amplifier System, Astro-Med, Inc., West Warwick, RI, USA) conditions for 7–10 days. During periods of recovery and habituation, rats were housed under the same 12:12 h light/dark cycle with free access to food and water. Rats were polygraphically recorded during these habituation sessions, which took place between 10:00 a.m. and 4:00 p.m. – a time when rats are normally sleeping. These 6-h habituation sessions were used as the baseline recordings for electrode testing and monitoring of daily variations in wake-sleep activity. The last day of these adaptation-recording sessions was determined when, for 3 consecutive days, day-to-day variation in the percentage of time spent in REM sleep was less than 5% of the total amount of time spent in REM sleep. Study animals were equal in terms of their wake-sleep variables and P-wave activity at baseline, as evidenced by the final 6-h baseline recording session, during which there was no significant group effect on the total percentages of time spent in W, non-REM sleep, and REM sleep, nor was there any significant group effect on P-wave density.
2.5. Experimental design
On the day after the last adaptation recording session, when day-to-day variation in the total amount of REM sleep had stabilized, experimental recording sessions began. During the experimental recording session, each animal was connected to the polygraphic recording system at 9:55 a.m. In the next room, polygraphic signs of the wake-sleep cycle were continuously observed on a computer monitor (between 10:00 a.m. and 4:00 p.m.).
2.5.1. Experiment 1: Wake-sleep activity during spontaneous sleep, RSD, TSD, and recovery sleep
The 30 rats were randomly divided into three groups. The experimental design of these studies is summarized in Fig. 1A. Group 1 (n = 10 rats): these animals were recorded for a 6-h session (between 10:00 a.m. and 4:00 p.m.) of undisturbed wake-sleep (hereafter, group 1 is labeled as “BLS”; baseline sleep). The experimental protocol for group 2 (n = 10 rats) was almost identical to the protocol described above for the BLS group, except that for group 2 animals, from 10:00 a.m. to 1:00 p.m., REM sleep episodes were selectively terminated at the beginning (within 3–5 s) of each episode while the animals were connected to the polygraphic recording system (hereafter, group 2 is labeled as “RSD”; selective REM sleep deprivation). The experimental protocol for group 3 (n = 10 rats) animals was similar to the protocol described above for the RSD group, except that for group 3, from 10:00 a.m. to 1:00 p.m., animals were kept awake while the animals were connected to the polygraphic recording system (hereafter, group 3 is labeled as “TSD”; total sleep deprivation). After 7–10 days from the end of Experiment 1, these 30 rats were used for Experiment 2. During the 7–10 day interval, rats were recorded for wake-sleep activity, and showed wake-sleep activity comparable to their baseline.
Figure 1.
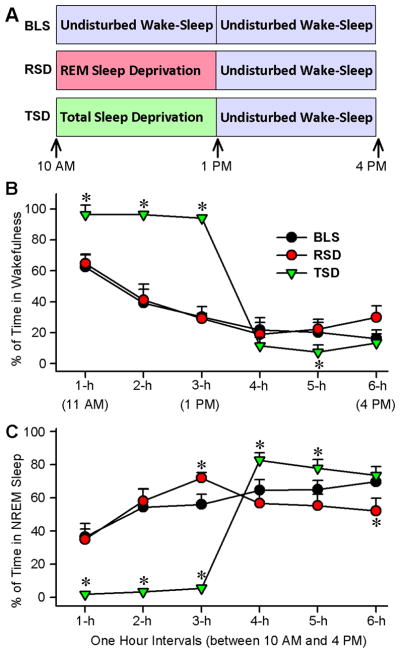
Experimental designs for REM sleep and total sleep deprivation and its effects on wakefulness and non-REM (NREM) sleep. A, Experimental protocols for baseline sleep (BLS; control), selective REM sleep deprivation (RSD), and total sleep deprivation (TSD) groups of rats. The BLS group rats were allowed to have 6 h (between 10:00 A.M. and 4:00 P.M.) of undisturbed wake-sleep cycle with REM sleep. The RSD group rats REM sleep episodes were selectively terminated from the ongoing wake-sleep cycle for 3 h (between 10:00 A.M. and 1:00 P.M.), after which they were allowed to have 3 h (1:00 P.M. and 4:00 P.M.) of undisturbed wake-sleep with REM sleep. The TSD group rats had all sleep episodes terminated from ongoing wake-sleep cycle for 3 h (between 10:00 A.M. and 1:00 P.M.), after which they were allowed to have 3 h (1:00 P.M. and 4:00 P.M.) of undisturbed wake-sleep with REM sleep. B, Percentage of time spent (mean ± SE) in wakefulness during consecutive 1 h intervals across 6 h recording session. Note that compared with the BLS group (control wake-sleep), the TSD group rats spent significantly more time in wakefulness during the first 3 hours and then significantly less time during the fifth hour. Also note that the amount of time spent in wakefulness, in all 1 h intervals of 6 h recordings, are comparable between the BLS and RSD group rats. C, Percentage of time spent (mean ± SE) in non-REM sleep during consecutive 1 h intervals across 6 h recording session. Note that compared with the BLS group, the TSD group rats spent significantly less time in non-REM sleep during the first 3 hours and then significantly more time during the 4th and 5th hours. Compared with the BLS group, RSD group spent time in non-REM sleep significantly more during the third hour and significantly less during the 6th hour. Asterisk indicates the level of statistical significance (Bonferroni posttests) of the differences relative to BLS (*p<0.001).
2.5.2. Experiment 2: Brain-derived neurotrophic factor (BDNF) levels during spontaneous sleep, RSD, TSD, and recovery sleep
A total of 90 rats (60 naïve and 30 rats from experiment 1) were randomly divided into three groups (BLS, RSD, and TSD), as described above in experiment 1 (30 rats/group), which were then divided into 5 subgroups (6 animals/subgroup). Group 1 (BLS): These animals were recorded for undisturbed wake-sleep activity for a length of time ranging between 2 and 6 hours (between 10 a.m. to 4 p.m.). After each hour, rats from one of the five subgroups (BLS-2h, BLS-3h, BLS-4h, BLS-5h, and BLS-6h) were quickly euthanized with CO2. The brains were then rapidly chilled on dry ice for further molecular processing for the quantification of BDNF levels in different areas of the brain. Group 2 (RSD): The experimental protocol and five subgroups for these animals (RSD-2h, RSD-3h, RSD-4h, RSD-5h, and RSD-6h) are almost identical to those of Group 1, except that for group 2 animals, from 10 a.m. to 1 p.m., REM sleep episodes were selectively terminated at their beginning while the animals remained connected to the recording system. Group 3 (TSD): The experimental protocol and subgroups for these animals (TSD-2h, TSD-3h, TSD-4h, TSD-5h, and TSD-6h) are almost identical to those of Group 1, except that from 10 a.m. to 1 p.m., Group 3 animals were deprived of total sleep.
2.6. Determination of behavioral states
For the determination of possible effects on wake-sleep activity, polygraphic data were captured online in a computer using “Gamma” software (Grass product group, Astro-Med, Inc., West Warwick, RI, USA). From this captured data, three behavioral states were distinguished and scored visually using “SleepSign for Animal” software (Kissei Comtec Co., LTD, Tokyo, Japan): W, non-REM sleep, and REM sleep. The physiological criteria for the identification of these wake-sleep states were described in detail in earlier publications [18, 25]. In this study, the behavioral states of W, non-REM sleep, and REM sleep were scored in successive 5-s epochs. This epoch duration allowed us to quantify short periods of REM sleep (3–5 sec) in rats during which REM sleep was selectively terminated [25]. The polygraphic measures provided the following dependent variables that were quantified for each animal: (1) percentage of time spent in W, non-REM sleep, and REM sleep for consecutive 1-h intervals across the 6-h recording session; (2) latencies to the onset of non-REM and REM sleep; (3) total number of REM sleep episodes for consecutive 1-h intervals across the 6-h recording session; and (4) total number of REM sleep P-waves for consecutive 1-h intervals across the 6-h recording session. In this study, P-wave spikes were visually identified and isolated from the background activities as described in our earlier publications [27, 28]. The number of REM sleep episodes in the BLS group was defined as how many times the animal entered into REM sleep that lasted at least 3 sec. In the RSD group, the number of REM sleep episodes was considered to be the number of times REM sleep was terminated using head-lifting or gentle arousing methods.
2.7. Analysis of cortical EEG power spectra
For power spectral analysis, cortical EEG signals were amplified and bandpass filtered (0.5 – 40 Hz) with a polygraph and Gamma software, as described previously [29, 30]. The amplified and filtered data was digitized at a sampling frequency of 256 Hz and subjected to a Fast Fourier transformation (0.5 – 40 Hz with an interval of 0.2 Hz; using SleepSign software) to calculate the cortical EEG power during the 6-h recording session (bin width of 5 second). Since slow-wave activity (SWA) is defined as the EEG power between 0.5 and 4 Hz (delta frequency), the next step of analysis focused on the power of two frequency ranges: delta (0.5 – 4.0 Hz) and total frequency (0.5 – 40 Hz). Finally, SWA (0.5 – 4.0 Hz) was expressed as the percentage of total power (0.5 – 40 Hz) for a consecutive 1-h interval across the 6-h recording session.
2.8. Tissue collection and quantification of BDNF
Immediately at the end of each experimental recording session, rats were sacrificed with CO2, and the brains were quickly removed and frozen using dry ice. In order to minimize possible variations due to differences in the sleep-wake state at the time of death, all animals were awakened by shaking their cages and kept awake for 1 min before they were sacrificed. To rule out any diurnal factors contributing to the different levels of BDNF in the different groups, comparable subgroups in the BLS, RSD, and TSD groups of rats were sacrificed at a fixed time of day. The frozen brains were cut in the transverse plane in 300 μm thick sections with a Vibratome (series 3000; Technical Products International, Inc.; St. Louis, MO, USA). Under a dissecting microscope, the pedunculopontine tegmentum (PPT), medial pontine reticular formation (mPRF), dorsal subcoeruleus nucleus (SubCD), ventro-lateral periaqueductal gray (vlPAG), medial preoptic area (mPOA), and frontal cortex (F-CTX) were dissected on an ice-chilled petri-dish, as described earlier [22, 24, 31]. The dissected brain parts (PPT, mPRF, SubCD, vlPAG, mPOA, and F-CTX) were separately stored in pre-chilled micro-centrifuge tubes at −80°C until further processing. Thus, the amount of BDNF was measured from mixed tissue collected from both hemispheres. The brain tissues were homogenized in cold lysis buffer. The homogenates were centrifuged and the resulting supernatants were then diluted 5-fold with DPBS and used for the enzyme-linked immunosorbent assay (ELISA; Emax Immunoassay systems kit; Promega, WI, USA). The amount of BDNF (BDNF/mg total protein) was determined using a standard ELISA technique, as previously described [26, 32]. The descriptions for the spatial and anatomical areas of the brain from which these tissues were collected were described previously [24, 26, 33].
2.9. Statistical analysis
To determine the effects of RSD and TSD on the behavioral and physiological measures of wake-sleep activity, the percentages of time spent in W, non-REM sleep, and REM sleep, as well as the number of REM sleep episodes, number of P-waves, and percentages of SWA were statistically analyzed using two-way ANOVAs followed by Bonferroni post-hoc tests, with time as a repeated-measure variable (six levels corresponding to the six 1-h epochs of the 6-h wake-sleep recording) and treatment as a between-subjects variable (3 levels corresponding to the 3 different treatments, BLS, RSD, and TSD). To rule out the possibility that the baseline total percentages of time spent in W, non-REM sleep, REM sleep, and number of P-waves among the three groups of rats were different, the values in the final 6-h baseline recording session were subjected to one-way ANOVA. For the BDNF data, one-factor ANOVAs and post-hoc tests (Bonferroni’s multiple comparison test) were used to compare the levels of BDNF in the PPT, mPRF, SubCD, vlPAG, mPOA, and F-CTX among BLS, RSD, and TSD groups. To assess the relative correlations among selective RSD-induced changes at 2 h and 3 h intervals in the cortical SWA and amounts of BDNF in the PPT, mPRF, SubCD, vlPAG, mPOA, and F-CTX, Pearsons correlations, which assume a Gaussian distribution, were calculated (regression analysis). Similar regression analyses were also performed between the levels of BDNF and number of REM sleep episodes, to assess the relationship between the levels of BDNF in the different areas of the brain (PPT, mPRF, SubCD, vlPAG, mPOA, and F-CTX) and REM sleep pressure. All statistical analyses were performed using Graphpad Prism statistical software (v5.0; Graphpad Software, La Jolla, CA, USA).
3. Results
During the baseline recording session (between 10:00 a.m. and 4:00 p.m.), all three groups (BLS, RSD, and TSD) of rats were allowed to have unrestricted wake-sleep activity. In order to understand the homeostatic regulatory mechanisms of REM sleep, during the first 3 hours (between 10:00 a.m. and 1:00 p.m.) of experimental recording session (between 10:00 a.m. and 4:00 p.m.), the RSD group of rats were partially deprived of REM sleep using a selective REM sleep deprivation method. This was done for a relatively short period of time (3 hours) without disturbing spontaneous non-REM sleep and wakefulness. During the identical circadian phase (between 10:00 a.m. and 1:00 p.m.), the TSD group of rats were deprived of total sleep (which includes both non-REM and REM sleep) and the BLS group of rats (control wake-sleep group) were allowed to have unrestricted wake-sleep activity. During the last 3 hours (between 1:00 p.m. and 4:00 p.m.) of this experimental recording session, all three groups of rats were allowed to have unrestricted amounts of wake-sleep activity. The BLS, RSD, and TSD protocols are illustrated in Figure 1A. During the baseline recording session, the total percentages of time spent in W, non-REM sleep and REM sleep, total number of REM sleep episodes, and total number of REM sleep P-waves were not significantly different (one-factor ANOVA) among the BLS, RSD, and TSD groups of animals. Thus, during the identical circadian phase of baseline recording conditions, the groups were initially equal in terms of these wake-sleep variables. To determine the effects of the RSD and TSD protocols, 6 1-h values of these wake-sleep variables during the identical circadian periods of 6 h experimental recording session were compared among the BLS, RSD, and TSD groups.
3.1. Effects of REM sleep deprivation and total sleep deprivation on wakefulness and non-REM sleep
A two-way ANOVA on the total percentage of time spent in W during the experimental recording session revealed significant main effects of treatment (F(2,135) = 82; p < 0.001), time (F(5,135) = 430; p < 0.001), and a significant treatment x time interaction (F(10,135) = 97; p < 0.001). The results of post hoc analysis (Bonferroni posttests) of total percentage of time spent in W during the experimental recording sessions are presented in Figure 1B. Post hoc analysis revealed that the total percentage of time spent in W in the RSD group were not significantly different during the second and third hours of selective RSD periods compared with an identical circadian time period of the BLS group. Similar comparisons between RSD and BLS groups during the recovery REM sleep period revealed that the total percentage of time spent in W were significantly different only during the sixth hour (t = 4.2; p <0.001). These results demonstrated that, except during the sixth hour of recovery REM sleep period, this short-term selective REM sleep deprivation protocol did not increase W. Contrary to the RSD group, in the TSD group, the total percentage of time spent in W increased during the first (55% increase; t = 10; p <0.001), second (146% increase; t = 18; p <0.001), and third (213% increase; t = 20; p <0.001) hours, and decreased during the fifth (64% decrease; t = 3.9; p <0.001) hours of experimental recording sessions, compared with an identical circadian time period of the BLS group.
A two-way ANOVA on the total percentage of time spent in non-REM sleep during experimental recording session revealed a significant main effect of treatment (F(2,135) = 51; p < 0.001), time (F(5,135) = 250; p < 0.001), and a significant treatment x time interaction (F(10,135) = 120; p < 0.001). The results of post hoc analysis (Bonferroni posttests) of total percentage of time spent in non-REM sleep during the experimental recording sessions are presented in Figure 1C. Post hoc analysis revealed that, during the experimental recording session, the total percentage of time spent in non-REM sleep in the RSD group increased significantly during the third hour (19% increase; t = 3.4; p <0.001) and decreased significantly during the sixth hours (26% decrease; t = 5.6; p <0.001), compared with an identical circadian time period of the BLS group. Unlike in the RSD group, in the TSD group of rats, the total percentage of time spent in non-REM sleep were significantly decreased during the first (95% decrease; t = 11; p <0.001), second (94% decrease; t = 16; p <0.001), and third (90% decrease; t = 17; p <0.001) hours of experimental recording session, compared with an identical circadian time period of the BLS group. These results suggest that, in the TSD group, the use of this short-term (3 hours) total sleep deprivation protocol eliminated more than 90% of total non-REM sleep. During the recovery sleep period of this experimental recording session, similar post hoc tests revealed that the total percentage of time spent in non-REM sleep in the TSD group was significantly higher during the fourth (28% more; t = 5.8; p <0.001) and fifth (20% more; t = 4.1; p <0.001) hours, compared with the BLS group. These results indicate that this 3 h TSD protocol was successful in inducing rebound non-REM sleep, which lasted for 2 hours.
3.2. Effects of REM sleep deprivation and total sleep deprivation on REM sleep
A two-way ANOVA on the total percentages of time spent in REM sleep during experimental recording session revealed a significant main effect of treatment (F(2,135) = 170; p < 0.001), time (F(5,135) = 490; p < 0.001), and a significant treatment x time interaction (F(10,135) = 71; p < 0.001). The results of post hoc analysis (Bonferroni posttests) of total percentage of time spent in REM sleep during the experimental recording sessions are presented in Figure 2A. Post hoc analysis revealed that the total percentage of time spent in REM sleep in the RSD group were significantly less during the second (89% less; t = 9.8; p <0.001) and third (89% less; t = 12; p <0.001) hours, compared with an identical circadian time period of the BLS group. This result demonstrated that, during the second and third hours, this short-term (3 hours) selective REM sleep deprivation method effectively eliminated more than 89% of total REM sleep. During the recovery sleep period (between 1:00 p.m. and 4:00 p.m.), when rats were allowed to have unrestricted wake-sleep activity, the total percentages of time spent in REM sleep in the RSD group were significantly higher during the fourth (71% more; t = 12; p <0.001), fifth (47% more; t = 12; p <0.001), and sixth (29% more; t = 12; p <0.001) hours of the 6-h recording session compared with an identical circadian time period of the BLS group. These results show that there was rebound REM sleep effect after 3 h of selective REM sleep deprivation. Unlike the RSD group, the TSD group of rats did not exhibit any REM sleep episodes during the first three hours of experimental recording. These results suggested that, in the TSD rats, the use of this short-term (3 hours) total sleep deprivation protocol eliminated 100% of total REM sleep. During the experimental recording session, the total percentage of time spent in REM sleep in TSD group was significantly less during the fourth hour (59% less; t = 10; p <0.001) and then returned to the normal level during the fifth and sixth hours, compared with the BLS group. These results indicated that, unlike the RSD protocol, 3-h of the TSD protocol did not induce rebound REM sleep.
Figure 2.

Effects of REM sleep and total sleep deprivation on REM sleep and cortical slow-wave activity (SWA). A, Percentage of time spent (mean ± SE) in REM sleep during consecutive 1 h intervals across 6 h recording session. Note that compared with the BLS group, the RSD and TSD groups of rats spent little or to time in REM sleep during the first 3 h. Also note that during the recovery sleep period, RSD group, but not the TSD group, spent significantly more time in REM sleep. B, Number of REM sleep episodes (mean ± SE) during consecutive 1 h intervals across 6 h recording session. Note that the numbers of REM sleep episodes during the second and third hours are significantly higher in the RSD than in the BLS group. C, Number of P-waves (mean ± SE) during consecutive 1 h intervals across 6 h recording session. Note that during the first 3 hours, both the RSD and TSD groups exhibited almost no P-waves and then during the recovery sleep period P-waves are more only in the RSD animals. D, SWA (mean ± SE; expressed as the percentage of total power) during consecutive 1 h intervals across 6 h recording session. In the RSD group SWA increased with increased duration of RSD. Also note that in the TSD group SWA decreased during TSD and increased during the first hour of recovery sleep.
A two-way ANOVA on the number of REM sleep episodes during experimental recording session indicate a significant main effect of treatment (F(2,135) = 330; p < 0.001), time (F(5,135) = 110; p < 0.001), and a significant treatment x time interaction (F(10,135) = 100; p < 0.001). The results of post hoc analysis (Bonferroni posttests) of the number of REM sleep episodes during the experimental recording session are presented in Figure 2B. In the RSD group, during the first three hours of this 6 h experimental recording session, REM sleep episodes were selectively terminated as soon as they appeared. Post-hoc analysis indicated that, in the RSD group, the numbers of REM sleep episodes were significantly higher during the second (179% higher; t = 8.9; p <0.001), third (323% higher; t = 25; p <0.001), and fourth (171% higher; t = 13; p <0.001) hours of the 6-h experimental recording session, compared with an identical circadian time period of the BLS group. This increase in the appearance of REM sleep episodes in the RSD group compared with the BLS group was much higher during the third hour (323% more) than during the second hour (179% more) of this experimental recording session. These results suggest that during this selective REM sleep deprivation there were progressively more frequent attempts at transitions into REM sleep, which is an indication of a strong homeostatic drive for REM sleep. During the fourth hour, when the RSD group of animals were allowed to have undisturbed REM sleep, the mean total number of REM sleep episodes was lower than the total number of REM sleep episodes during the third hour of the REM sleep deprivation period. However, during this one hour of post REM sleep deprivation period, the mean number of REM sleep episodes remained significantly higher (171% higher) than the mean number of REM sleep episodes during the fourth hour of the BLS group. Collectively, these results suggest that this short-term (3-h) selective REM sleep deprivation protocol was successful in activating an REM sleep homeostatic process. Unlike in the RSD group, in the TSD group, during the identical circadian period, the number of REM sleep episodes was significantly lower during the second (t = 5; p <0.001) and third (t = 7.8; p <0.001) hours of the 6-h experimental recording session, compared with identical time periods of the BLS group. These results suggested that this short-term TSD protocol was not effective in activating an REM sleep homeostatic process.
Having documented the changes in the total percentage of time spent in REM sleep and the total numbers of REM sleep episodes, next, the total number of REM sleep P-waves were compared among the RSD, TSD and BLS groups. The P-wave in the rat is the equivalent of the pontine component of the phasic ponto-geniculo-occipital (PGO) wave in the cat and nonhuman primates [13, 34]. The PGO/P-wave is also present in humans, occurring immediately before and during REM sleep [35, 36]. The P-wave occurs during REM sleep as a singlet and in clusters containing a variable number of waves (3–5 waves/burst) at a frequency range of 30–60 spikes/min [27, 28]. This wave is generated by the phasic activation of a group of glutamatergic cells in the dorsal part of the subcoeruleus nucleus (SubCD) in the pons [13, 28]. These P-wave generating neurons discharge high-frequency (>500 Hz) spike bursts (3–5 spikes/burst) on the background of tonically increased firing rates (30–40 Hz).
A two-factor ANOVA on the total number of P-waves revealed significant main effects of treatment (F(2,135) = 370; p < 0.001), time (F(5,135) = 870; p < 0.001), and a significant treatment x time interaction (F(10,135) = 210; p < 0.001). The results of post hoc analysis (Bonferroni posttests) of total number of REM sleep P-waves during the experimental recording sessions are presented in Figure 2C. Post hoc analysis revealed that the total number of REM sleep P-waves in the RSD group was significantly less during the second (90.81% less; t = 13; p <0.001) and third (88.18% less; t = 15; p <0.001) hours, compared with an identical circadian time period of the BLS group. Considering the fact that during the second and third hours, in the RSD group of rats, about 89% of the total percentage of time spent in REM sleep were reduced, and P-waves are present mainly during the period of REM sleep, it is not surprising that during this RSD period, the total number of P-waves was significantly lower. During the recovery sleep period, when rats were allowed to have unrestricted REM sleep, the total number of REM sleep P-waves in the RSD group was significantly higher during the fourth (166.67% more; t = 30; p <0.001), fifth (107.55% more; t = 21; p <0.001), and sixth (52.82% more; t = 11; p <0.001) hours of the 6-h experimental recording session compared with an identical circadian time period of the BLS group. These results indicated that, during recovery REM sleep after 3 h of selective REM sleep deprivation, there was an increase in the total number of P-waves with the increase in the total percentage of time spent in REM sleep. In the TSD group, P-waves were absent during the 3 h of total sleep deprivation. During the recovery sleep period, the total number of P-waves was also significantly lower during the fourth hour (37.78% less; t = 6.5; p <0.001).
3.3. Effects of selective REM sleep deprivation and total sleep deprivation on cortical SWA
Having documented the changes in homeostatic pressure after selective REM sleep deprivation and total sleep deprivation, we examined the changes in SWA, a known marker of sleep pressure in mammals. In the present study, SWA (0.5 – 4.0 Hz) is expressed as the percentage of total power (0.5 – 40 Hz) for a consecutive 1-h interval across the 6-h recording session. A two-way ANOVA on the percentage change in SWA during the experimental recording session revealed a significant main effect of treatment (F(2,135) = 120; p < 0.001), time (F(5,135) = 95; p < 0.001), and a significant treatment x time interaction (F(10,135) = 150; p < 0.001). The results of post hoc analysis (Bonferroni posttests) of total percentage of SWA during the experimental recording sessions are presented in Figure 2D. During the experimental recording session, in the RSD group, SWA increased significantly during the second (33.33% increase; t = 8.9; p <0.001) and third hour (92.11% increase; t = 19.0; p <0.001) of the selective REM sleep deprivation period, compared with an identical circadian time period of the BLS group. This increased SWA in the RSD group reduced during the recovery sleep period, but remained significantly higher than the BLS group during the fourth (68.57% higher; t = 13.0; p <0.001) hour. These results indicate that the SWA increased with increased duration of selective REM sleep deprivation and then slowly reduced to its baseline level during the recovery sleep period. On the contrary, in the TSD group, during total sleep deprivation, SWA decreased significantly during the first (133.33% decrease; t = 13.0; p <0.001), second (100% decrease; t = 10.0; p <0.001) and third hours (80.95% decrease; t = 8.8; p <0.001) of experimental recording compared with an identical circadian time period of the experimental recording session in the BLS group. But, during the recovery sleep period, SWA increased during the fourth (51.43% increase; t = 9.6; p <0.001) hour compared with an identical circadian time period of the BLS group. These results indicated that SWA decreased during this short-term total sleep deprivation and then there was rebound SWA during the first hour of recovery sleep.
3.4. Effects of selective REM sleep deprivation and total sleep deprivation on the PPT, SubCD, mPRF, vlPAG, mPOA, and F-CTX levels of BDNF protein
For the induction and maintenance of spontaneously occurring REM sleep and P-waves, PPT, mPRF, vlPAG, and SubCD have been identified as the four most important regions in the brainstem [1, 6, 15, 16, 26]. In this study, we quantified the temporal changes in the levels of BDNF protein in these REM sleep and P-wave regulating areas in response to homeostatic regulation of REM sleep. In addition to these brainstem areas, the temporal changes in BDNF protein were also measured in two other regions of the brain: (1) in the mPOA, known to be involved in the regulation of non-REM sleep, and (2) in the F-CTX, a region where SWA activities are normally recorded. We measured the levels of BDNF protein in the PPT, mPRF, vlPAG, SubCD, mPOA, and F-CTX in three different groups (BLS, RSD, and TSD) at five different time intervals (2 h, 3 h, 4 h, 5 h, and 6 h).
In the PPT, the levels of BDNF in the three different groups were significantly different (one-way ANOVA) at intervals 2 h (F(2,15) = 100; p < 0.001), 3 h (F(2,15) = 769; p < 0.001), 4 h (F(2,15) = 119; p < 0.001), 5 h (F(2,15) = 85.5; p < 0.001), and 6 h (F(2,15) = 21.7; p < 0.001). To determine the changes in the levels of BDNF with the RSD and TSD protocols, BDNF levels of the RSD and TSD groups at the five different time intervals were compared (Bonferroni’s multiple comparison test) with corresponding time intervals of the BLS group (Fig. 3A). These tests revealed that in the RSD group, the levels of BDNF were significantly higher at 2 h (t = 13, p <0.001), 3 h (t = 33.3, p <0.001), 4 h (t = 15.3, p <0.001), 5 h (t = 13.1, p <0.001), and 6 h (t = 6.56, p <0.001). Similar comparisons revealed that the BDNF levels in the TSD group were significantly higher at 4 h (t = 6.06, p <0.001), 5 h (t = 6.14, p <0.001), and 6 h (t = 2.72, p <0.05). These results demonstrated that the levels of BDNF increased with increased duration of selective RSD, but not with the TSD. These results also indicated that, during the first hour of recovery sleep after TSD, the BDNF levels increased and then slowly decreased. However, during the recovery sleep period, the levels of BDNF were higher in the RSD than in the TSD group in all time intervals (4 h, 5 h, and 6 h). One-way ANOVAs revealed that the BDNF levels in the SubCD of three different groups are significantly different at intervals 2 h (F(2,15) = 58; p < 0.001), 3 h (F(2,15) = 236; p < 0.001), 4 h (F(2,15) = 140; p < 0.001), 5 h (F(2,15) = 62; p < 0.001), and 6 h (F(2,15) = 19; p < 0.001). Post hoc tests revealed that, in the RSD group (Fig. 3B), the levels of BDNF were significantly higher at 2 h (t = 10.4, p <0.001), 3 h (t = 19, p <0.001), 4 h (t = 16, p <0.001), 5 h (t = 11, p <0.001), and 6 h (t = 5.5, p <0.001). Similar comparisons revealed that the BDNF levels in the TSD group were significantly higher at 2 h (t = 2.97, p <0.05), 4 h (t = 3.1, p <0.05), and 5 h (t = 5.5, p <0.001). These results indicated that, like in the PPT, in the SubCD, the changes in BDNF levels in the RSD group were more robust than in the TSD group. Unlike in the PPT and SubCD, in the mPRF, the levels of BDNF in three different groups were significantly different only at the 3 h interval (F(2,15) = 31; p < 0.001). Post hoc comparisons revealed that at 3 h interval, the level of BDNF was significantly higher (t = 3.2, p <0.05) in the RSD group and significantly less (t = 4.7, p <0.001) in the TSD group (Fig. 3C). Unlike in the PPT, SubCD, and mPRF, the levels of BDNF in the vlPAG of three different groups were not significantly different (two-way ANOVAs and post hoc tests; Fig. 3D). These results indicate that this short-term RSD and TSD protocol had no effect on the levels of BDNF in the vlPAG.
Figure 3.

Effects of REM sleep and total sleep deprivation on the levels of BDNF protein in the pedunculopontine tegmentum (PPT; A), dorsal subcoeruleus nucleus (SubCD; B), medial pontine reticular formation (mPRF; C), ventro-lateral periaqueductal area (vlPAG; D), medial preoptic area (mPOA; E), and frontal cortex (F-CTX; F). Each bar represents the amount of BDNF protein (mean ± SE) in the specific brain area of 2 h, 3 h, 4 h, 5 h, or 6 h subgroups of baseline sleep (BLS), selective REM sleep deprivation (RSD), or total sleep deprivation (TSD) groups of animals (n = 6 rats/subgroup). Asterisks indicate the levels of statistical significance (Post hoc tests, Bonferroni’s multiple comparison test) of the differences relative to wake-sleep control (BLS): *p <0.05, **p <0.01, and ***p <0.001.
In the mPOA of the three different groups, the levels of BDNF were significant different (two-way ANOVAs) at 2 h (F(2,15) = 9.3; p < 0.01) and 3 h (F(2,15) = 19; p < 0.001) intervals. Post hoc comparisons revealed that the levels of BDNF in the mPOA decreased at 2 h (F(2,15) = 4.2; p < 0.01) and 3 h (F(2,15) = 5.1; p < 0.001) intervals in the TSD group but not in the RSD group (Fig. 3E). These results indicate that, in the mPOA, the levels of BDNF decreased during the period of total sleep deprivation. In the F-CTX, the levels of BDNF in the three different treatment groups were significantly different (two-way ANOVAs) at 2 h (F(2,15) = 40; p < 0.001), 3 h (F(2,15) = 24; p < 0.001), and 4 h (F(2,15) = 14; p < 0.001) intervals. Post hoc comparisons revealed that the levels of BDNF in the F-CTX of the RSD group significantly decreased at 2 h (t = 3.1, p <0.05) and 3 h (t = 5.2, p <0.001) and increased significantly at 4 h (t = 4.3, p <0.01) intervals (Fig. 3F). On the contrary, in the TSD group, the levels of BDNF in the F-CTX increased significantly at the 2 h (t = 5.7, p <0.001) interval. These results indicate that, in the F-CTX, BDNF levels decreased during the period of selective RSD and then there was a rebound during the first hour of the recovery sleep period. These results also indicate that the levels of BDNF in the F-CTX increased during the first two hours of TSD, reduced to normal level during the third hour of TSD, and then remained at their normal level throughout the period of recovery sleep.
3.5. Relationship between REM sleep deprivation-induced changes in SWA and levels of BDNF
As documented above, selective REM sleep deprivation changes both SWA and levels of BDNF in the REM sleep and non-REM sleep regulating areas of the brain. To determine the relationship between REM sleep deprivation-induced changes in SWA and BDNF, linear regression analyses were performed between changes in individual animals’ SWA and localized changes in the levels of BDNF in six different areas of the brain (PPT, SubCD, mPRF, vlPAG, mPOA, and F-CTX). The results of regression analyses between individual animals’ SWA and BDNF levels in the REM sleep regulating areas are presented in Figure 4A. These regression analyses revealed a significant positive relationship between SWA and BDNF level in the PPT (F(1,10) = 68.07; Rsqr = 0.87; p < 0.001), and SubCD (F(1,10) = 58.48; Rsqr = 0.85; p < 0.001). However, similar regression analyses did not reveal any significant relationship between individual animals’ SWA and BDNF level in the mPRF (F(1,10) = 1.50; Rsqr = 0.13; p = 0.25) and vlPAG (F(1,10) = 0.38; Rsqr = 0.04; p = 0.55).
Figure 4.

Relationships between selective REM sleep deprivation (RSD)-induced changes in cortical slow-wave activity (SWA) and amount of BDNF protein in the individual brain areas. A, Amount of BDNF protein in the REM sleep regulating areas in the brainstem for each animal in the 2 h and 3 h subgroups of RSD group is shown as a function of the percentage of cortical SWA. Plots of linear regression best fit (solid line; Pearson product-moment correlation) shows a significant positive relationship between percentage of SWA and amount of BDNF protein in the PPT (Rsqr = 0.87; p <0.001) and SubCD (Rsqr = 0.85; p <0.001) but not in the vlPAG (Rsqr = 0.04; p = 0.05) and mPRF (Rsqr = 0.13; p = 0.25). These data indicate that the RSD-induced increase in the amount of BDNF protein in the PPT and SubCD depends positively on the percentage of cortical SWA during the period of RSD. These data also indicate that the amount of BDNF protein in the vlPAG and mPRF did not vary as a function of SWA in the period of RSD. B, Amount of BDNF protein in the mPOA (a non-REM sleep regulating area) and F-CTX (SWA recording area) for each animal in the 2 h and 3 h subgroups of RSD group is shown as a function of the percentage of cortical SWA. Plot of linear regression best fit (solid line; Pearson product-moment correlation) shows a significant negative relationship between percentage of SWA and amount of BDNF protein in the F-CTX (Rsqr = 0.66; p <0.01) but not in the mPOA (Rsqr = 0.07; p = 0.40). These data indicate that the RSD-induced change in the amount of BDNF protein in the F-CTX depends negatively on the percentage of cortical SWA during the period of RSD. The amount of BDNF protein in the mPOA did not vary as a function of SWA in the period of RSD. Abbreviations: PPT, pedunculopontine tegmentum; SubCD, dorsal subcoeruleus nucleus; vlPAG, ventro-lateral periaqueductal area; mPRF, medial pontine reticular formation; mPOA, medial preoptic area; F-CTX, frontal cortex.
The results of regression analyses between individual animals’ SWA and BDNF levels in the mPOA, a well-known area for the regulation of non-REM sleep, and F-CTX, where SWA is normally recorded, are presented in Figure 4B. Like mPRF and vlPAG in the brainstem, the level of individual animals’ BDNF in the mPOA did not show any significant relationship with SWA (F(1,10) = 0.76; Rsqr = 0.07; p = 0.40). However, a similar regression analysis revealed a strong inverse relationship between individual animals’ SWA and BDNF level in the F-CTX (F(1,10) = 19.47; Rsqr = 0.66; p <0.01). This finding indicates that increased SWA might have decreased production of BDNF in the F-CTX.
3.6. Relationship between REM sleep deprivation-induced changes in BDNF and REM sleep pressure
In one of our earlier studies, we suggested that, during selective REM sleep deprivation, increased SWA might be involved in the development of homeostatic REM sleep pressure [4]. In this study, we have documented that selective REM sleep deprivation-induced increased SWA might also be involved in the regulation of BDNF in the PPT, SubCD, and F-CTX. Therefore, to identify any possible relationship between REM sleep deprivation-induced changes in BDNF and REM sleep pressure, linear regression analyses were performed between individual animals’ BDNF levels in six different areas of the brain (PPT, SubCD, mPRF, vlPAG, mPOA, and F-CTX) along with numbers of REM sleep episodes during the second and third hours of selective REM sleep deprivation. The results of linear regression analyses between individual animals’ BDNF levels in the REM sleep regulating areas and number of REM sleep episodes are presented in Figure 5A. These linear regression analyses revealed a significant positive relationship between number of REM sleep episodes and BDNF level in the PPT (F(1,10) = 103.79; Rsqr = 0.90; p < 0.001), and SubCD (F(1,10) = 82.94; Rsqr = 0.88; p < 0.001). Similar regression analyses did not reveal any significant relationship between individual animals’ number of REM sleep episodes and BDNF level in the mPRF (F(1,10) = 2.50; Rsqr = 0.12; p = 0.14) and vlPAG (F(1,10) = 0.00; Rsqr = 0.20; p = 0.96).
Figure 5.

Relationships between selective REM sleep deprivation (RSD)-induced changes in amount of BDNF protein in the individual brain areas and REM sleep drive, as measured by number of REM sleep episodes. A, Number of REM sleep episodes for each animal in the 2 h and 3 h subgroups of RSD group is shown as a function of the amount of BDNF protein in the REM sleep regulating areas in the brainstem. Plots of linear regression best fit (solid line; Pearson product-moment correlation) shows a significant positive relationship between number of REM sleep episodes and amount of BDNF protein in the PPT (Rsqr = 0.90; p <0.001) and SubCD (Rsqr = 0.88; p <0.001) but not in the vlPAG (Rsqr = 0.00; p = 0.96) and mPRF (Rsqr = 0.12; p = 0.14). These data indicate that the RSD-induced increase REM sleep pressure during the period of RSD depends positively on the amount of BDNF protein in the PPT and SubCD. These data also indicate that the homeostatic REM sleep pressure during the period of RSD did not vary as a function of amount of BDNF protein in the vlPAG and mPRF. B, Number of REM sleep episodes for each animal in the 2 h and 3 h subgroups of RSD group is shown as a function of the amount of BDNF protein in the mPOA and F-CTX. Plot of linear regression best fit (solid line; Pearson product-moment correlation) shows a significant negative relationship between number of REM sleep episodes and amount of BDNF protein in the F-CTX (Rsqr = 0.74; p <0.001) but not in the mPOA (Rsqr = 0.02; p = 0.62). These data indicate that the RSD-induced increased REM sleep pressure during the period of RSD depends negatively on the amount of BDNF protein in the F-CTX. These data also indicate that the increased REM sleep pressure during the period of RSD did not vary as a function of amount of BDNF protein in the mPOA. PPT, pedunculopontine tegmentum; SubCD, dorsal subcoeruleus nucleus; vlPAG, ventro-lateral periaqueductal area; mPRF, medial pontine reticular formation; mPOA, medial preoptic area; F-CTX, frontal cortex.
The results of linear regression analyses between individual animals’ number of REM sleep episodes and BDNF levels in the mPOA and F-CTX are presented in Figure 5B. Individual animals’ number of REM sleep episodes did not show any significant relationship with BDNF in the mPOA (F(1,10) = 0.26; Rsqr = 0.02; p = 0.62). However, similar linear regression analysis revealed a strong inverse relationship between individual animals’ number of REM sleep episodes and BDNF level in the F-CTX (F(1,10) = 31.95; Rsqr = 0.74; p <0.001). This finding indicates that, during selective REM sleep deprivation period, decreased production of BDNF in the F-CTX might be involved in increased homeostatic REM sleep pressure. However, it is more likely that the selective REM sleep deprivation might have decreased production of BDNF in the F-CTX.
4. Discussion
The results of the present study suggest the existence of a novel cellular and molecular mechanism underlying homeostatic regulation of REM sleep. The principal findings of this study are that: (1) during the period of short-term selective RSD, but not during the TSD, cortical SWA and homeostatic drive for REM sleep increased progressively; (2) during this selective RSD, the amounts of BDNF protein expression in the PPT and SubCD, but not in the mPRF, vlPAG, mPOA and F-CTX, increased progressively; (3) selective RSD-induced increases in cortical SWA of individual animals were positively correlated with their amounts of BDNF expression in the PPT and SubCD; (4) selective RSD-induced increases in the amounts of BDNF expression in the PPT and SubCD of individual animals were positively correlated with the level of homeostatic drive for REM sleep. The results presented here are the first to show that during selective RSD, increased BDNF expression in the PPT and SubCD is a critical molecular step for the development of homeostatic drive for REM sleep.
Over the last two decades, it has been shown that the homeostatic regulatory process of REM sleep is independent of the non-REM sleep homeostatic regulatory process [37–40]. Behavioral studies in both human and non-human animals have suggested that the homeostatic regulation of REM sleep is critical for the development, maturation, and plasticity of the brain [8, 12, 27, 41–45]. Some other studies have suggested that the deficits in the homeostatic regulation of REM sleep signs are associated with a number of neurological and psychiatric disorders [10, 46–51].
Over the last five decades sleep research has focused on identifying relevant brain structures, neuronal networks, and their transmitters that are involved in the generation and regulation of spontaneously occurring non-REM and REM sleep [14, 16]. In recent years, a number of studies on the regulation of sleep have focused on understanding the mechanisms for the homeostatic regulation of non-REM sleep [3, 21, 52, 53]. None of these previous studies, however, have appeared to focus on the cellular and molecular mechanism for the homeostatic regulation of REM sleep, despite its relevance to both basic and clinical neurosciences. Therefore, one goal of this study was to identify molecular mechanisms for the development of homeostatic drive for REM sleep, a critical step for the homeostatic regulation of REM sleep. To fulfill this goal in the present study, we have used a relatively new but an established method of selective RSD to activate behavioral and physiological processes of REM sleep homeostatic regulation [25]. The results of this study demonstrated that, during the period of selective RSD, our RSD protocol successfully reduced more than 89% of the total duration of normal REM sleep. During this selective RSD period, cortical SWA increased and the number of REM sleep episodes tripled. The finding of an increase in the number of REM sleep episodes is consistent with the results of other studies that have shown that during the RSD period the number of interventions required to prevent REM sleep increases dramatically [2, 4, 38, 54, 55]. These studies also have suggested that this increased REM sleep propensity is an indication that the homeostatic processes of REM sleep have been activated. The results of the present study also demonstrated that during the recovery sleep period, the total percentage of REM sleep was about 49% greater than the BLS group. These results indicated a rebound in REM sleep after a three-hour period of selective RSD. This increase in REM sleep rebound is also consistent with a number of studies that have shown increased total amount of REM sleep after variable periods of RSD [2, 4, 37, 38, 40, 54, 55]. In summary, the results of this study show that during selective RSD the number of attempts to enter REM sleep increased, and that during the recovery period the total amount of REM sleep increased to compensate for REM sleep deficits from the preceding selective deprivation period. Collectively these results are in agreement with the idea that three hours of selective RSD produced by the use of our selective RSD protocol will successfully activate the homeostatic regulatory processes of REM sleep.
In this study, the molecular changes that we observed using selective RSD protocol are part of REM sleep homeostatic regulatory processes. We acknowledge a well-known fact that circadian factors also influence regulation of sleep. Thus, this study was designed to minimize the influence of circadian factors that could affect the homeostatic regulatory processes of REM sleep. To activate homeostatic processes of REM sleep, spontaneous REM sleep episodes occurring between 10:00 AM and 1:00 PM were prematurely terminated. Earlier studies have suggested that a RSD protocol lasting for a maximum duration of 3 hours can rule out the possible circadian influence on the homeostatic regulatory processes [4, 37, 38, 56–58]. Thus, it is reasonable to suggest that the homeostatic responses observed in this study have not been affected by circadian control. In addition, carrying out the control study at the same circadian phase also helps to rule out the influences of circadian factors on the activated homeostatic processes that were examined in this study. Some studies have shown that, in the rat, housed in light/dark cycle similar to this study, the expression of REM sleep episodes is highest and NREM sleep homeostatic pressure is minimal at a time between 10:00 AM and 4:00 PM [38, 59]. Thus, the selected time window (between 10:00 AM and 1:00 PM) for this selective RSD experiment was ideal for the activation of REM sleep homeostatic processes. The results of this study have shown that during the deprivation protocol, the total percentage of time spent in wakefulness did not change, and the total percentage of time spent in NREM sleep did not decrease. These findings indicate that the RSD method used in this study is very selective. Thus, the observed changes in the physiological processes are selective homeostatic responses for the regulation of REM sleep. We also acknowledge that sleep deprivation is a stressful event. To determine that these physiological and molecular changes we observed using this short-term selective RSD are not simply due to stress, we have compared these physiological and molecular changes in a group of rats exposed to the TSD protocol, which is relatively more stressful [26]. The results of this study showed that the behavioral, physiological and molecular changes in the TSD group are very different than those changes observed in the RSD group. This is an indication that the physiological and molecular changes we saw using our selective RSD protocol are not simply due to the stress, but rather that those changes are selective homeostatic responses for the regulation of REM sleep.
The results of this study, for the first time, demonstrate that during the selective RSD, total amounts of BDNF protein in the PPT and SubCD increased progressively with increased SWA and homeostatic drive for REM sleep. These findings also showed that during this selective RSD, the total amounts of BDNF protein did not increase in the mPRF, vlPAG, and mPOA, indicating an anatomical specificity of this selective RSD effect. Interestingly, unlike during RSD, with TSD, the total amounts of BDNF did not increase in the PPT and SubCD, indicating that increased BDNF in the PPT and SubCD is a specific effect of selective RSD. Additionally, the results of our regression analysis revealed a strong positive correlation between homeostatic drive for REM sleep (number of REM sleep episodes during RSD) and amounts of BDNF in the PPT; in fact, 90.0% of the variance in homeostatic drive for REM sleep was explained by the amount of BDNF expression (Rsqr = .90). Similarly, the amount of BDNF protein expression in the SubCD was a strong predictor of the level of homeostatic drive for REM sleep, explaining 88.0% of the variance (Rsqr = .88). The theoretical basis for the observed relationships, combined with these strong statistical results, provide evidence consistent with a causal relationship between the amounts of homeostatic drive for REM and amounts of BDNF expression in the PPT and SubCD. The mechanisms for gamma frequency activity in the PPT involve N-type calcium channels during REM sleep, and in the SubCD involve sodium-dependent sub-threshold oscillations [60]. Interestingly, BDNF modulates both N-type calcium and voltage-gated sodium channels [61–63]. These findings suggest a possible mechanism by which BDNF may regulate the manifestation of REM sleep by the PPT and SubCD.
5. Conclusions
In conclusion, behavioral, physiological, and molecular data reported here demonstrated that selective RSD-induced increased expression of BDNF in the PPT and SubCD are crucial factors in the development of the homeostatic drive for REM sleep. Based on the results of this study, it seems reasonable to hypothesize that the REM sleep homeostatic regulation deficits that are seen in neuropsychiatric disorders may, in part, be caused by some abnormalities in BDNF synthesis.
Acknowledgments
This work is supported by National Institutes of Health Research Grant (MH59839). The content is solely the responsibility of the authors and does not necessarily represent the official views of the National Institutes of Health. We thank Dr. Ralph Lydic, Dr. Helen Baghdoyan, and Robert M. Craft for critical discussions and suggestions on the earlier version of this manuscript. We thank Ms. Chelsea Angel for her technical assistance.
References
- 1.Datta S, Maclean RR. Neurobiological mechanisms for the regulation of mammalian sleep-wake behavior: reinterpretation of historical evidence and inclusion of contemporary cellular and molecular evidence. Neurosci Biobehav Rev. 2007;31:775–824. doi: 10.1016/j.neubiorev.2007.02.004. [DOI] [PMC free article] [PubMed] [Google Scholar]
- 2.Dement W. The effect of dream deprivation. Science. 1960;131:1705–7. doi: 10.1126/science.131.3415.1705. [DOI] [PubMed] [Google Scholar]
- 3.Gvilia I, Xu F, McGinty D, Szymusiak R. Homeostatic regulation of sleep: a role for preoptic area neurons. J Neurosci. 2006;26:9426–33. doi: 10.1523/JNEUROSCI.2012-06.2006. [DOI] [PMC free article] [PubMed] [Google Scholar]
- 4.Shea JL, Mochizuki T, Sagvaag V, Aspevik T, Bjorkum AA, Datta S. Rapid eye movement (REM) sleep homeostatic regulatory processes in the rat: changes in the sleep-wake stages and electroencephalographic power spectra. Brain Res. 2008;1213:48–56. doi: 10.1016/j.brainres.2008.03.062. [DOI] [PMC free article] [PubMed] [Google Scholar]
- 5.Anderson KN, Bradley AJ. Sleep disturbance in mental health problems and neurodegenerative disease. Nat Sci Sleep. 2013;5:61–75. doi: 10.2147/NSS.S34842. [DOI] [PMC free article] [PubMed] [Google Scholar]
- 6.Brown RE, Basheer R, McKenna JT, Strecker RE, McCarley RW. Control of sleep and wakefulness. Physiol Rev. 2012;92:1087–187. doi: 10.1152/physrev.00032.2011. [DOI] [PMC free article] [PubMed] [Google Scholar]
- 7.Garcia-Rill E, Charlesworth A, Heister D, Ye M, Hayar A. The developmental decrease in REM sleep: the role of transmitters and electrical coupling. Sleep. 2008;31:673–90. doi: 10.1093/sleep/31.5.673. [DOI] [PMC free article] [PubMed] [Google Scholar]
- 8.Gottesmann C, Gottesman I. The neurobiological characteristics of rapid eye movement (REM) sleep are candidate endophenotypes of depression, schizophrenia, mental retardation and dementia. Prog Neurobiol. 2007;81:237–50. doi: 10.1016/j.pneurobio.2007.01.004. [DOI] [PubMed] [Google Scholar]
- 9.Hobson JA, Pace-Schott EF. The cognitive neuroscience of sleep: neuronal systems, consciousness and learning. Nat Rev Neurosci. 2002;3:679–93. doi: 10.1038/nrn915. [DOI] [PubMed] [Google Scholar]
- 10.Khatami R, Landolt HP, Achermann P, Adam M, Retey JV, Werth E, et al. Challenging sleep homeostasis in narcolepsy-cataplexy: implications for non-REM and REM sleep regulation. Sleep. 2008;31:859–67. doi: 10.1093/sleep/31.6.859. [DOI] [PMC free article] [PubMed] [Google Scholar]
- 11.Poe GR, Walsh CM, Bjorness TE. Cognitive neuroscience of sleep. Prog Brain Res. 2010;185:1–19. doi: 10.1016/B978-0-444-53702-7.00001-4. [DOI] [PMC free article] [PubMed] [Google Scholar]
- 12.Smith C. Sleep states and memory processes. Behav Brain Res. 1995;69:137–45. doi: 10.1016/0166-4328(95)00024-n. [DOI] [PubMed] [Google Scholar]
- 13.Datta S. Activation of phasic pontine-wave generator: a mechanism for sleep-dependent memory processing. Sleep Biol Rhythms. 2006;4:16–26. [Google Scholar]
- 14.Datta S. Cellular and chemical neuroscience of mammalian sleep. Sleep Med. 2010;11:431–40. doi: 10.1016/j.sleep.2010.02.002. [DOI] [PMC free article] [PubMed] [Google Scholar]
- 15.Pace-Schott EF, Hobson JA. The neurobiology of sleep: genetics, cellular physiology and subcortical networks. Nat Rev Neurosci. 2002;3:591–605. doi: 10.1038/nrn895. [DOI] [PubMed] [Google Scholar]
- 16.Baghdoyan HA, Lydic R. The Neurochemistry of sleep and wakefulness. In: Brady ST, Siegel GJ, Albers RW, Price DL, editors. Basic neurochemistry: principles of molecular, cellular, and medical neurobiology. Burlington: Academic Press; 2012. pp. 982–99. [Google Scholar]
- 17.Datta S, Desarnaud F. Protein kinase A in the pedunculopontine tegmental nucleus of rat contributes to regulation of rapid eye movement sleep. J Neurosci. 2010;30:12263–73. doi: 10.1523/JNEUROSCI.1563-10.2010. [DOI] [PMC free article] [PubMed] [Google Scholar]
- 18.Datta S, Spoley EE, Mavanji VK, Patterson EH. A novel role of pedunculopontine tegmental kainate receptors: a mechanism of rapid eye movement sleep generation in the rat. Neuroscience. 2002;114:157–64. doi: 10.1016/s0306-4522(02)00250-6. [DOI] [PubMed] [Google Scholar]
- 19.Gvilia I, Suntsova N, Angara B, McGinty D, Szymusiak R. Maturation of sleep homeostasis in developing rats: a role for preoptic area neurons. Am J Physiol Regul Integr Comp Physiol. 2011;300:R885–94. doi: 10.1152/ajpregu.00727.2010. [DOI] [PMC free article] [PubMed] [Google Scholar]
- 20.Hairston IS, Peyron C, Denning DP, Ruby NF, Flores J, Sapolsky RM, et al. Sleep deprivation effects on growth factor expression in neonatal rats: a potential role for BDNF in the mediation of delta power. J Neurophysiol. 2004;91:1586–95. doi: 10.1152/jn.00894.2003. [DOI] [PubMed] [Google Scholar]
- 21.Faraguna U, Vyazovskiy VV, Nelson AB, Tononi G, Cirelli C. A causal role for brain-derived neurotrophic factor in the homeostatic regulation of sleep. J Neurosci. 2008;28:4088–95. doi: 10.1523/JNEUROSCI.5510-07.2008. [DOI] [PMC free article] [PubMed] [Google Scholar]
- 22.Paxinos G, Watson C. The rat brain in stereotaxic coordinates. San Diego: Academic Press; 1997. [Google Scholar]
- 23.Datta S. Activation of pedunculopontine tegmental PKA prevents GABAB receptor activation-mediated rapid eye movement sleep suppression in the freely moving rat. J Neurophysiol. 2007;97:3841–50. doi: 10.1152/jn.00263.2007. [DOI] [PubMed] [Google Scholar]
- 24.Bandyopadhya RS, Datta S, Saha S. Activation of pedunculopontine tegmental protein kinase A: a mechanism for rapid eye movement sleep generation in the freely moving rat. J Neurosci. 2006;26:8931–42. doi: 10.1523/JNEUROSCI.2173-06.2006. [DOI] [PMC free article] [PubMed] [Google Scholar]
- 25.Datta S, Mavanji V, Ulloor J, Patterson EH. Activation of phasic pontine-wave generator prevents rapid eye movement sleep deprivation-induced learning impairment in the rat: a mechanism for sleep-dependent plasticity. J Neurosci. 2004;24:1416–27. doi: 10.1523/JNEUROSCI.4111-03.2004. [DOI] [PMC free article] [PubMed] [Google Scholar]
- 26.Datta S, Siwek DF, Huang MP. Improvement of two-way active avoidance memory requires protein kinase a activation and brain-derived neurotrophic factor expression in the dorsal hippocampus. J Mol Neurosci. 2009;38:257–64. doi: 10.1007/s12031-009-9206-7. [DOI] [PMC free article] [PubMed] [Google Scholar]
- 27.Datta S. Avoidance task training potentiates phasic pontine-wave density in the rat: A mechanism for sleep-dependent plasticity. J Neurosci. 2000;20:8607–13. doi: 10.1523/JNEUROSCI.20-22-08607.2000. [DOI] [PMC free article] [PubMed] [Google Scholar]
- 28.Datta S, Siwek DF, Patterson EH, Cipolloni PB. Localization of pontine PGO wave generation sites and their anatomical projections in the rat. Synapse. 1998;30:409–23. doi: 10.1002/(SICI)1098-2396(199812)30:4<409::AID-SYN8>3.0.CO;2-#. [DOI] [PubMed] [Google Scholar]
- 29.Huang MP, Radadia K, Macone BW, Auerbach SH, Datta S. Effects of eszopiclone and zolpidem on sleep-wake behavior, anxiety-like behavior and contextual memory in rats. Behav Brain Res. 2010;210:54–66. doi: 10.1016/j.bbr.2010.02.018. [DOI] [PMC free article] [PubMed] [Google Scholar]
- 30.Maclean RR, Datta S. The relationship between anxiety and sleep-wake behavior after stressor exposure in the rat. Brain Res. 2007;1164:72–80. doi: 10.1016/j.brainres.2007.06.034. [DOI] [PMC free article] [PubMed] [Google Scholar]
- 31.Datta S, Li G, Auerbach S. Activation of phasic pontine-wave generator in the rat: a mechanism for expression of plasticity-related genes and proteins in the dorsal hippocampus and amygdala. Eur J Neurosci. 2008;27:1876–92. doi: 10.1111/j.1460-9568.2008.06166.x. [DOI] [PMC free article] [PubMed] [Google Scholar]
- 32.Ulloor J, Datta S. Spatio-temporal activation of cyclic AMP response element-binding protein, activity-regulated cytoskeletal-associated protein and brain-derived nerve growth factor: a mechanism for pontine-wave generator activation-dependent two-way active-avoidance memory processing in the rat. J Neurochem. 2005;95:418–28. doi: 10.1111/j.1471-4159.2005.03378.x. [DOI] [PubMed] [Google Scholar]
- 33.Desarnaud F, Macone BW, Datta S. Activation of extracellular signal-regulated kinase signaling in the pedunculopontine tegmental cells is involved in the maintenance of sleep in rats. J Neurochem. 2011;116:577–87. doi: 10.1111/j.1471-4159.2010.07146.x. [DOI] [PMC free article] [PubMed] [Google Scholar]
- 34.Bizzi E, Brooks DC. FUNCTIONAL CONNECTIONS BETWEEN PONTINE RETICULAR FORMATION AND LATERAL GENICULATE NUCLEUS DURING DEEP SLEEP. Arch Ital Biol. 1963;101:666–80. [PubMed] [Google Scholar]
- 35.Lim AS, Lozano AM, Moro E, Hamani C, Hutchison WD, Dostrovsky JO, et al. Characterization of REM-sleep associated ponto-geniculo-occipital waves in the human pons. Sleep. 2007;30:823–7. doi: 10.1093/sleep/30.7.823. [DOI] [PMC free article] [PubMed] [Google Scholar]
- 36.Miyauchi S, Misaki M, Kan S, Fukunaga T, Koike T. Human brain activity time-locked to rapid eye movements during REM sleep. Exp Brain Res. 2009;192:657–67. doi: 10.1007/s00221-008-1579-2. [DOI] [PubMed] [Google Scholar]
- 37.Benington JH, Woudenberg MC, Heller HC. REM-sleep propensity accumulates during 2-h REM-sleep deprivation in the rest period in rats. Neurosci Lett. 1994;180:76–80. doi: 10.1016/0304-3940(94)90917-2. [DOI] [PubMed] [Google Scholar]
- 38.Vivaldi EA, Ocampo A, Wyneken U, Roncagliolo M, Zapata AM. Short-term homeostasis of active sleep and the architecture of sleep in the rat. J Neurophysiol. 1994;72:1745–55. doi: 10.1152/jn.1994.72.4.1745. [DOI] [PubMed] [Google Scholar]
- 39.Franken P. Long-term vs. short-term processes regulating REM sleep. J Sleep Res. 2002;11:17–28. doi: 10.1046/j.1365-2869.2002.00275.x. [DOI] [PubMed] [Google Scholar]
- 40.Ocampo-Garces A, Molina E, Rodriguez A, Vivaldi EA. Homeostasis of REM sleep after total and selective sleep deprivation in the rat. J Neurophysiol. 2000;84:2699–702. doi: 10.1152/jn.2000.84.5.2699. [DOI] [PubMed] [Google Scholar]
- 41.Bramham CR, Maho C, Laroche S. Suppression of long-term potentiation induction during alert wakefulness but not during ‘enhanced’ REM sleep after avoidance learning. Neuroscience. 1994;59:501–9. doi: 10.1016/0306-4522(94)90172-4. [DOI] [PubMed] [Google Scholar]
- 42.Guzman-Marin R, Suntsova N, Bashir T, Nienhuis R, Szymusiak R, McGinty D. Rapid eye movement sleep deprivation contributes to reduction of neurogenesis in the hippocampal dentate gyrus of the adult rat. Sleep. 2008;31:167–75. doi: 10.1093/sleep/31.2.167. [DOI] [PMC free article] [PubMed] [Google Scholar]
- 43.Karni A, Tanne D, Rubenstein BS, Askenasy JJ, Sagi D. Dependence on REM sleep of overnight improvement of a perceptual skill. Science. 1994;265:679–82. doi: 10.1126/science.8036518. [DOI] [PubMed] [Google Scholar]
- 44.McDermott CM, LaHoste GJ, Chen C, Musto A, Bazan NG, Magee JC. Sleep deprivation causes behavioral, synaptic, and membrane excitability alterations in hippocampal neurons. J Neurosci. 2003;23:9687–95. doi: 10.1523/JNEUROSCI.23-29-09687.2003. [DOI] [PMC free article] [PubMed] [Google Scholar]
- 45.Mueller AD, Pollock MS, Lieblich SE, Epp JR, Galea LA, Mistlberger RE. Sleep deprivation can inhibit adult hippocampal neurogenesis independent of adrenal stress hormones. Am J Physiol Regul Integr Comp Physiol. 2008;294:R1693–703. doi: 10.1152/ajpregu.00858.2007. [DOI] [PubMed] [Google Scholar]
- 46.Bonanni E, Maestri M, Tognoni G, Fabbrini M, Nucciarone B, Manca ML, et al. Daytime sleepiness in mild and moderate Alzheimer’s disease and its relationship with cognitive impairment. J Sleep Res. 2005;14:311–7. doi: 10.1111/j.1365-2869.2005.00462.x. [DOI] [PubMed] [Google Scholar]
- 47.Chaudhuri KR, Pal S, DiMarco A, Whately-Smith C, Bridgman K, Mathew R, et al. The Parkinson’s disease sleep scale: a new instrument for assessing sleep and nocturnal disability in Parkinson’s disease. J Neurol Neurosurg Psychiatry. 2002;73:629–35. doi: 10.1136/jnnp.73.6.629. [DOI] [PMC free article] [PubMed] [Google Scholar]
- 48.KNA, AJB Sleep disturbance in mental health problems and neurodegenerative disease. Nature and Science of Sleep. 2013;5:61–75. doi: 10.2147/NSS.S34842. [DOI] [PMC free article] [PubMed] [Google Scholar]
- 49.Montplaisir J, Petit D, Lorrain D, Gauthier S, Nielsen T. Sleep in Alzheimer’s disease: further considerations on the role of brainstem and forebrain cholinergic populations in sleep-wake mechanisms. Sleep. 1995;18:145–8. doi: 10.1093/sleep/18.3.145. [DOI] [PubMed] [Google Scholar]
- 50.Prinz PN, Larsen LH, Moe KE, Vitiello MV. EEG markers of early Alzheimer’s disease in computer selected tonic REM sleep. Electroencephalogr Clin Neurophysiol. 1992;83:36–43. doi: 10.1016/0013-4694(92)90130-a. [DOI] [PubMed] [Google Scholar]
- 51.Thorpy MJ, Adler CH. Parkinson’s disease and sleep. Neurol Clin. 2005;23:1187–208. doi: 10.1016/j.ncl.2005.05.001. [DOI] [PubMed] [Google Scholar]
- 52.Kalinchuk AV, McCarley RW, Porkka-Heiskanen T, Basheer R. Sleep deprivation triggers inducible nitric oxide-dependent nitric oxide production in wake-active basal forebrain neurons. J Neurosci. 2010;30:13254–64. doi: 10.1523/JNEUROSCI.0014-10.2010. [DOI] [PMC free article] [PubMed] [Google Scholar]
- 53.Leemburg S, Vyazovskiy VV, Olcese U, Bassetti CL, Tononi G, Cirelli C. Sleep homeostasis in the rat is preserved during chronic sleep restriction. Proc Natl Acad Sci U S A. 2010;107:15939–44. doi: 10.1073/pnas.1002570107. [DOI] [PMC free article] [PubMed] [Google Scholar]
- 54.Morden B, Mitchell G, Dement W. Selective REM sleep deprivation and compensation phenomena in the rat. Brain Res. 1967;5:339–49. doi: 10.1016/0006-8993(67)90042-x. [DOI] [PubMed] [Google Scholar]
- 55.Werth E, Cote KA, Gallmann E, Borbely AA, Achermann P. Selective REM sleep deprivation during daytime I. Time course of interventions and recovery sleep. Am J Physiol Regul Integr Comp Physiol. 2002;283:R521–6. doi: 10.1152/ajpregu.00462.2001. [DOI] [PubMed] [Google Scholar]
- 56.Benington JH, Heller HC. REM-sleep timing is controlled homeostatically by accumulation of REM-sleep propensity in non-REM sleep. Am J Physiol. 1994;266:R1992–2000. doi: 10.1152/ajpregu.1994.266.6.R1992. [DOI] [PubMed] [Google Scholar]
- 57.Borbely AA, Tobler I, Hanagasioglu M. Effect of sleep deprivation on sleep and EEG power spectra in the rat. Behav Brain Res. 1984;14:171–82. doi: 10.1016/0166-4328(84)90186-4. [DOI] [PubMed] [Google Scholar]
- 58.Brunner DP, Dijk DJ, Tobler I, Borbely AA. Effect of partial sleep deprivation on sleep stages and EEG power spectra: evidence for non-REM and REM sleep homeostasis. Electroencephalogr Clin Neurophysiol. 1990;75:492–9. doi: 10.1016/0013-4694(90)90136-8. [DOI] [PubMed] [Google Scholar]
- 59.Datta S, Hobson JA. The rat as an experimental model for sleep neurophysiology. Behav Neurosci. 2000;114:1239–44. doi: 10.1037//0735-7044.114.6.1239. [DOI] [PubMed] [Google Scholar]
- 60.Garcia-Rill E, Kezunovic N, D’Onofrio S, Luster B, Hyde J, Bisagno V, et al. Gamma band activity in the RAS-intracellular mechanisms. Exp Brain Res. 2014;232:1509–22. doi: 10.1007/s00221-013-3794-8. [DOI] [PMC free article] [PubMed] [Google Scholar]
- 61.Miki T, Hirai H, Takahashi T. Activity-dependent neurotrophin signaling underlies developmental switch of Ca2+ channel subtypes mediating neurotransmitter release. J Neurosci. 2013;33:18755–63. doi: 10.1523/JNEUROSCI.3161-13.2013. [DOI] [PMC free article] [PubMed] [Google Scholar]
- 62.Jeon D, Kim C, Yang YM, Rhim H, Yim E, Oh U, et al. Impaired long-term memory and long-term potentiation in N-type Ca2+ channel-deficient mice. Genes Brain Behav. 2007;6:375–88. doi: 10.1111/j.1601-183X.2006.00267.x. [DOI] [PubMed] [Google Scholar]
- 63.Dravid SM, Baden DG, Murray TF. Brevetoxin activation of voltage-gated sodium channels regulates Ca dynamics and ERK1/2 phosphorylation in murine neocortical neurons. J Neurochem. 2004;89:739–49. doi: 10.1111/j.1471-4159.2004.02407.x. [DOI] [PMC free article] [PubMed] [Google Scholar]