

Summary
Ionotropic glutamate receptors (iGluRs) are tetrameric ion channels that mediate excitatory neurotransmission. Recent structures of AMPA and NMDA receptors permit a comparative analysis of whole-receptor dynamics for the first time. Despite substantial differences in the packing of their two-domain extracellular region, the two iGluRs share similar dynamics, elucidated by elastic network models. Motions accessible to either structure enable conformational interconversion, such as compression of the AMPAR towards the more tightly packed NMDAR conformation, which has been linked to allosteric regulation. Pivoting motions coupled to concerted rotations of the transmembrane ion channel are prominent between dimers of distal N-terminal domains in the loosely-packed AMPAR. The occurrence and functional relevance of these motions is verified by cross-linking experiments designed to probe the computationally predicted distance changes. Together with the identification of hot-spot residues acting as mediators of allosteric communication, our data provide a glimpse into the dynamic spectrum of iGluRs.
Keywords: ionotropic glutamate receptors, AMPA and NMDA receptors, NTD-LBD coupling, conformational dynamics, allosteric events, signal transduction, effector residues, elastic network models, crosslinking, mutagenesis
Introduction
Ionotropic glutamate receptors (iGluRs) mediate rapid excitatory neurotransmission by opening a cation-selective pore in response to l-glutamate binding (Traynelis et al., 2010). They are ubiquitously expressed in vertebrate nervous systems and are central to neural circuit development and synaptic plasticity, a process that underlies learning and memory (Malinow et al., 2002;Traynelis et al., 2010). Malfunction of iGluRs contributes to various neurological disorders including neurodegenerative disorders and epilepsies (Bowie, 2008;Malinow, 2012); channel potentiators have the ability to boost cognitive performance (Partin, 2014) and to alleviate depression (Bleakman et al., 2007).
The main iGluR subfamilies – AMPA- (α-amino-3-hydroxy-5-methyl-4-isoxazole propionate), NMDA- (N-methyl-D-aspartate) and kainate-receptors – are related, tetrameric ion channels that are organized into four domains (Figure 1A): the N-terminal domain (NTD) and ligand-binding domain (LBD) form the extracellular region (ECR) followed by the pore-forming transmembrane domain (TMD) and an intracellular C-terminus (Traynelis et al., 2010). The ECR exhibits overall twofold symmetry and a non-equivalent subunit organization, whereas the TMD is about fourfold symmetric (Kuner et al., 2003;Sobolevsky et al., 2009). The LBD binds agonists (including glutamate), antagonists and channel modulators; it is connected to the NTD and TMD layers via peptide linkers. A host of functional and structural data (Mayer, 2006;Traynelis et al., 2010) combined with simulations of individual receptor domains (Arinaminpathy et al., 2006;Bjerrum et al., 2008;Dawe et al., 2013;Dutta et al., 2012;Lau et al., 2011;Lau et al., 2013;Sukumaran et al., 2011;Zhu et al., 2013) has provided a framework of how glutamate-docking to the LBD ‘clamshell’ ultimately triggers ion channel opening followed by receptor deactivation (closure in response to ligand unbinding), or desensitization (closure with ligand bound). Yet, an understanding of how the three domain layers communicate in the intact receptor to ultimately gate the ion channel is currently not well understood.
Figure 1. ANM analysis of AMPARs and NMDARs.

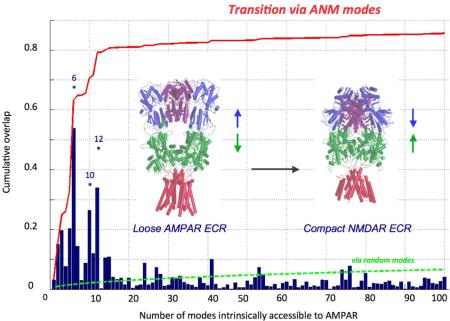
(A) Crystallographic structures of AMPAR (PDB ID: 3KG2) (Sobolevsky et al., 2009) and NMDAR (PDB ID: 4PE5) (Karakas et al., 2014). The corresponding root-mean-square deviation (RMSD) after optimal structural alignment is 17.8Å. Note the tighter packing of the NTD (blue) and LBD (green) in NMDAR, compared to that in AMPAR. (B) Correlations between the softest 40 modes of the two iGluRs. High correlations (red; positive or blue; negative) are equivalent as ANM modes are oscillations with arbitrary starting direction. Green regions show weak correlations. See Figure S1 for overlaps for the first two pairs of modes. See also Movies 1-8 of these and other modes at the web (http://www.csb.pitt.edu/bahar/NMDAR_vs_AMPAR.html). (C) Interconversion from AMPAR to NMDAR conformation by moving in the subspace of soft modes. The dark blue bars show the overlap (correlation cosine) between ANM modes and the structural difference vector d between AMPAR and NMDAR cores; the red curve displays the cumulative overlap; the dotted green curve shows the expected cumulative overlap if the modes were equally contributing each to the overall structural change. The inset shows the initial (crystal) structures of the AMPAR (left) and NMDAR (right) (see also Figure 3). Colors distinguish the AMPAR distal and proximal subunits A/C (green) and B/D (red) (see also Movie 9). (D) Results for the reverse transition (NMDAR → AMPAR) (see also Movie 11).
Unique features in domain organization emerged from recent iGluR structures, trapped in functionally different states (Durr et al., 2014;Karakas et al., 2014;Lee et al., 2014;Meyerson et al., 2014). These include a complete separation of individual LBDs together with substantial rearrangements in the NTD layer upon desensitization particularly in AMPARs (Meyerson et al., 2014;Nakagawa et al., 2005;Schauder et al., 2013). Moreover, compression of the two ECR layers presumably facilitates allosteric modulation in NMDARs (Karakas et al., 2014;Lee et al., 2014) (Figure 1A). This organization drastically deviates from the non-NMDARs, where the NTD is loosely connected in current structures and its allosteric potential is unclear.
To investigate mechanisms of allosteric communication in intact iGluRs, we analyzed and compared the structure-based dynamics of AMPARs and NMDARs using elastic network models and all-atom MD simulations. Collective dynamics predicted by the anisotropic network model (ANM) (Atilgan et al., 2001;Bahar et al., 2010a;Eyal et al., 2015) revealed correlated movements between the three domain layers, that could be instrumental in propagating signals from the ECR down to the channel gate. These motions are shared by both AMPAR and NMDAR, suggesting that they are characteristic of the iGluR family fold that is retained by the two subfamilies despite their structural differences. Furthermore, the two receptor structures can interconvert via energetically most accessible modes of reconfiguration, suggesting that they represent alternative conformers intrinsically favored by the 3-layered modular architecture of iGluRs. One dominant motion involves large reorientations of the NTD dimers, which we confirmed experimentally via cysteine crosslinking. This type of high conformational flexibility is consistent with recent structural data, and is particularly evident in the more loosely organized AMPAR (Cais et al., 2014;Chen et al., 2014;Durr et al., 2014;Meyerson et al., 2014). We also identified a series of hot spots that serve as sensors and effectors of allosteric signaling between the NTD and the channel gate.
Results
Global modes of motions are shared between AMPARs and NMDARs
Capitalizing on recent iGluR structures, we analyzed and compared the collective dynamics of the GluA2 AMPAR (antagonist-bound, PDB ID: 3KG2) (Sobolevsky et al., 2009) and a heteromeric GluN1/GluN2B NMDAR (complexed with agonists and the allosteric inhibitor ifenprodil, PDB ID: 4PE5) (Karakas et al., 2014). To this aim we used the ANM where each residue is represented by a node located at its Cα position, and interactions within a close distance are modeled as springs with uniform force constants (Atilgan et al., 2001). This representation permits us to analytically resolve and decompose iGluR dynamics into a series of modes of motion. The low frequency (or global) modes reveal the energetically most accessible (or softest) collective changes in structure near native state conditions. Previous applications have shown that these modes enable ligand binding, allosteric couplings and/or ion flux (Bahar et al., 2010a;Bahar, 2010).
Three key features emerge from our analysis: First, irrespective of the packing density between layers and interdomain interfaces, strong couplings within and between domains are observed in both receptors. Second, a number of global modes are conserved between the two receptors, suggesting that they underlie family fold-specific mechanisms, defined by the overall architecture rather than local interactions (which differ between the two receptors) (Movies 1-8). For example, mode 1 exhibits bending motions between layers in both iGluRs (Movie 1). Likewise, AMPAR mode 3 (u3AMPAR) resembles NMDAR mode 4 (u4NMDAR); both induce twisting counter-rotations in the NTD dimers of the respective receptors (Movie 2). Third, the predicted specific mechanisms of cooperative inter- or intradomain rearrangements closely conform to the structural changes that have been linked to biological function (Durr et al., 2014;Meyerson et al., 2014). Mechanisms that stood out include: bending between and rotations within the three layers; pivoting motions within the two ECR layers; and vertical contraction/expansion between the layers (Movie 3). The latter two mechanisms have been associated with AMPAR activation (Chen et al., 2014;Durr et al., 2014;Lau et al., 2013;Meyerson et al., 2014).
Quantitative Analysis Underscores the Global Similarities and Local Differences
To comprehensively quantify the extent of similarity between the equilibrium dynamics of the two iGluRs, we evaluated the overlap between their softest modes (1-40; Figure 1B). In order to directly compare the two receptors, which differ in length, we identified the sequence stretches that can be optimally aligned, and determined the soft modes, uc, for those aligned sequences which represent the ‘core’ of the two structures (see Supplemental Information (SI)). High correlations were evident for selected pairs of soft modes (as can be seen online). For example, the correlation cosines were 0.77 for the pair [uc1AMPAR, uc1NMDAR] (Movie 1) and 0.67 for [uc2AMPAR, uc6NMDAR] (Movie 4), an enhancement by a factor of ~60 over random (see SI). These similarities were assessed by overlaying the x-, y- and z-components of residue displacements in these pairs of modes (Figure S1A). As shown in Figure 1B, the close similarities between the two iGluRs' mode spectra at the lowest frequency regime gradually dissipated with increasing frequency (or decreasing amplitude), as expected from the greater significance of local effects with increasing mode frequency.
We also analyzed other available AMPAR structures (Durr et al., 2014;Meyerson et al., 2014), which exhibited a similar behavior (e.g. Figure S1B). Furthermore, we repeated the ANM calculations in the presence of the membrane, in order to examine the effect of the lipid bilayer on global receptor dynamics. We used a method enabling us to model the membrane as an elastic network (Lezon et al., 2012) and examined the dynamics of the receptor (subsystem) in the lipid bilayer (environment) using the ‘subsystem-environment’ perturbation method (Ming et al., 2006;Zheng et al., 2005) (see SI). The results for both receptors (Figures S1C and S1D) confirmed that the global mode shapes obtained for the receptors are generally robust to spatial constraints induced by the lipid bilayer. A few modes appear to become stiffer (move to higher modes) in the presence of the lipid bilayer, especially uc3AMPAR and uc3NMDAR, which feature an ‘isolated’ rotation of the TMD that is likely to be hindered by the membrane. This localized restriction does not affect the majority of modes that enable the coupling between all three domains, nor those involved in the reconfiguration between the two iGluRs (described in the next section). Modes where all three domains are coupled appear to be integral properties of the overall architecture and have a large enough momentum to be minimally perturbed by the membrane in both iGluRs.
We further evaluated the intramolecular cross-correlations between residue fluctuations. The cross-correlation maps generated for modes 1-10 further illustrate the similarity in dynamics between the two receptors (Figures 2A and 2B). Strongly coupled regions are indicated in red when moving in the same direction (positive correlation) and blue when moving in opposite directions (anticorrelation). The coupled regions are in line with the shared modular architecture and quaternary arrangement of the two receptors (Sobolevsky et al., 2009), e.g. strong (positive) correlations are observed within the NTD and LBD dimers, and strong anticorrelations are observed between the LBD and NTD of the individual subunits.
Figure 2. Cross-correlations between the global rearrangements of various domains of all four subunits, within AMPAR and NMDAR.

Regions moving together in the same direction are colored red (strongly correlated), those moving together but in opposite directions are shown in blue (strongly anti-correlated), and weakly correlated regions are shown in green. The correlations are based on the cumulative effect of the softest 10 ANM modes for AMPAR (A) and NMDAR (B). The segments corresponding to subunits A-D are marked along the two axes, and the color-coded bars therein refer to the NTD (blue), LBD (green) and TMD (red) of each subunit (see labeled bars below AMPAR). The red boxes indicate structural blocks that move in concert, in the same direction, and blue boxes those moving in concert, but in opposite directions. Note how the distribution of these regions is in line with the modular architecture of the receptors. (C) The difference diagram is obtained by subtracting the map in panel (A) from that in (B), to better visualize the differences. (D-E) Cross-correlation matrices for GNM mode 2 are shown for the AMPAR (D) and NMDAR (E). Strong correlations (red) indicate regions moving in the same direction; strong anti-correlations (blue) indicate regions moving concertedly in opposite directions. Panel F schematically shows the spatial position of the four subunits in the intact receptors.
Careful examination of the intramolecular correlations reveals minor differences, which can be seen on the 'difference' map (Figure 2C). The most distinctive differences occur at the proximal chains B and D (those with NTDs proximal to each other and to the overall symmetry axis, see also Figures 2F and 3): The NTD and LBD of these chains exhibit intrasubunit anticorrelations in AMPAR, while they are less anticorrelated, and even partially correlated within the NMDAR subunits. Furthermore the LBDs of all subunits consistently exhibit strong couplings in the NMDAR, whereas this effect is weaker between the proximal and distal chains' LBDs in the AMPAR.
Figure 3. Intrinsic ability of the AMPAR structure to transition into the conformation resolved for NMDAR.

The two middle diagrams represent the AMPAR crystal structure (top) and a conformation sampled upon moving along ANM mode 4 (equivalent to uc6 in Figure 1C). This cooperative mode entails a significant contraction in the structure, manifested by the indicated distance change between the NTD and LBD centers as well as an overall tight packing near the NTD-LBD and LBD dimer-dimer interfaces, as can be viewed in Movie 10. The compact conformation (right) sampled by the AMPAR along this mode closely resembles that resolved for NMDAR (bottom). The NTD is shown in blue and purple to emphasize the non-equivalent subunit pairs, which correspond to GluN1 (distal) and GluN2B (proximal), respectively. An arbitrary extent of motion is shown here that illustrates the transition.
AMPAR and NMDAR Structures Can Interconvert via Soft ANM Modes
In light of the above data, we next assessed the ability of the two iGluR subtypes to interconvert conformations. This was analyzed by systematically exploring the relevance of the softest modes to the change in conformation, d, between the two structures. We first determined d, the 3N-dimensional difference vector between the x-, y-, and z-coordinates of aligned residues upon optimal superposition of the two crystal structures. We then computed the correlation cosines between d and each of the softest 100 ANM modes accessible to the AMPAR (blue bars in Figure 1C). Strikingly, a single mode (uc6AMPAR) yields a correlation cosine of more than 0.50 (Movie 9). uc10AMPAR (Movie 7) and uc12AMPAR are also distinguished as peaks, resulting in a cumulative overlap of 0.80 (red curve). These data show that AMPARs possess an intrinsic potential to convert to the NMDAR structure (Figure 1C). The AMPAR-to-NMDAR reconfiguration is even more striking when looking at the equivalent modes generated from the complete receptor. Mode 4 of the intact AMPAR (u4AMPAR; equivalent to uc6AMPAR) induces a vertical compression involving all three layers, bringing the AMPAR towards a compact, NMDAR-like conformation (Figure 3 and Movie 10). This is accomplished by concerted pivoting of the ECR layers: as the two NTD dimers come into close proximity of each other via tighter association of their proximal chains (B and D; purple in Figure 3; blue and yellow in Movie 10B), the LBD dimers ‘roll’ apart to accommodate a sinking NTD tetramer. In the ‘end state’, the LLs of the NTDs of the proximal subunits (B,D) are wedged between the LBD dimers, resembling current NMDAR structures (Durr et al., 2014;Karakas et al., 2014;Lee et al., 2014;Meyerson et al., 2014;Yelshanskaya et al., 2014). Related movements in the ECR layers are also triggered by agonist binding (to the LBD) (Durr et al., 2014;Lau et al., 2013;Meyerson et al., 2014;Nakagawa et al., 2005).
The opposite reconfiguration, i.e. from NMDAR to AMPAR, is also attainable, albeit with involvement of more modes (Figure 1D). This is explained by the tighter packing of the NMDAR ECR, imparting a stronger resistance to redistribute existing interactions. Nevertheless, the conformational change is still accessible via a set of soft modes (e.g. modes 5, 6, 12, 17), which involve cooperative rearrangements between all three domains. In uc17NMDAR NTD interdimer opening is further accompanied by the release of the close packing between the NTD and LBD, thus driving significant reconfiguration towards the AMPAR conformation (Movie 11). This mode also shows intradimer rearrangements that bring the loosely packed NMDAR NTD dimers into a conformation resembling AMPAR NTD dimers. The subspaces of soft modes that dominate the transition in either direction (peaks in Figures 1C and 1D) were verified to be very similar, by evaluating the cumulative overlap between those subsets. Overall, this reveals that the structural differences between AMPAR and NMDAR may be encompassed by a few modes of conformational change that are readily accessible to either receptor.
AMPAR NTD Rearrangements Linked to Activation and Desensitization Are Enabled by the Intrinsic Dynamics of the NTD
As described above, pivoting between NTD dimers turns out to be a dominant feature in AMPAR dynamics. This motion has also been observed experimentally and is linked to receptor activation and desensitization (Durr et al., 2014;Meyerson et al., 2014;Nakagawa et al., 2005). To characterize this feature further we analyzed the softest mode exhibiting this behavior, u2AMPAR (equivalent to uc2AMPAR). In the ‘closed’ state, helices H in the upper lobes (ULs) of the proximal chains approximate, with a distance between the K262 Cα marker atoms (K268 in PDB 3KG2) fluctuating ± 25 Å around an equilibrium value of 32 Å (Figures 4A and 4B and Movie 4).
Figure 4. Ability of the AMPAR NTD to undergo large-scale rearrangements.

(A-B) Open and closed NTD conformers visited along u2AMPAR, shown from the side (A) and top (B) (see Movie 4). A significant change in NTD interdimer distance takes place, illustrated for K262 on the proximal subunits B and D. This mode entails a global twisting in the LBD and TMD shown by the orange arrows. The diagrams in A are color-coded by mobility; B is colored by chain. K262C mutation sites are shown as spheres to highlight that they come into close proximity for intersubunit disulfide bridge formation. (C) Mobility profile for u2AMPAR. The LBD is highlighted with ellipses (see Figure S2). (D) Fluctuations in K262 (subunit B) − K262 (subunit D) Cα distance observed in an MD simulation. (E) The ability of proximal chains to come into close proximity is validated by cysteine cross-linking experiments. The K262C mutant forms DTT-sensitive dimers when incorporated into both wild type GluA2 and the linker mutant Δ-link. Cross-linking is also obtained for a positive control S729C (which cross-links the LBD) but not the negative control T38C, which is not predicted to come into close contact by the ANM. This is seen for both whole cell lysates (top blots) and mature, surface-expressed AMPARs purified with a biotinylation protocol (bottom blots).
The mobility profile of u2AMPAR (Figure 4C) exemplifies the concerted motions in the NTD layer, which contrasts with the LBD where the distal and proximal chains exhibit complementary motions due to their difference in quaternary packing (Figure S2). Peaks (red in Figure 4A) show regions of high mobility, whereas minima (blue) represent hinge sites or anchors, usually at domain interfaces. The lower lobes (LLs; I203-V209) engage a relatively small (400 Å2) interface centered at the base of helix G (Figures 4A and 4B). This interface serves as anchor, mediating the coupled movements between the NTD upper lobes (opening/closing) and the LBD (torsional rotation). There are also local minima within the NTD including Q18, F70-K73, F95, R108-D110 and A270-Y274, which line the interlobe cleft. Finally, the minimum near G389-E391 refers to the hinge between the NTD and LBD. The loose packing at these three hinge sites suggests that the NTD dimers retain to some extent their modular characteristics during the collective dynamics of the receptor.
To zoom into this pivoting motion at the all-atom level we performed two independent molecular dynamics (MD) simulations of 100 ns starting from the crystal structure of an isolated GluA2 NTD tetramer (Jin et al., 2009). The distance between the marker residue (K262) on chains B and D fluctuated between 21.1 and 51.4 Å (illustrated for one of the runs in Figure 4D), reminiscent of its behavior in ANM mode 2; oscillations between the NTD dimers had a time scale of ~ 30 ns. The correspondence between these fluctuations and ANM mode 2 was further verified by essential dynamics analysis (EDA) of MD trajectory. The first two essential modes of structural change deduced from this analysis exhibited a cumulative overlap of 0.55 with ANM mode 2.
To investigate this further, we adopted the ‘subsystem-environment’ perturbation method (Ming et al., 2006;Zheng et al., 2005), a modified ANM where the springs within the subsystem incorporate the effect of the environment (see SI). This analysis showed that the intrinsic dynamics of AMPAR NTD dimers and tetramers (the ‘subsystem’) are largely maintained in the full-length structure (the ‘environment’; Figures 5A and 5B). By contrast, in the NMDAR, the rest of the receptor has a larger effect on the dynamics of the NTD tetramer (Figure 5C), as expected from its tighter ECR packing. However, NMDAR NTD dimer dynamics are influenced by the rest of receptor to a similar extent as the AMPAR NTD dimer (Figure 5D), underscoring the relevance of the NTD dimers’ intrinsic dynamics in allosteric communication (Dutta et al., 2012;Sukumaran et al., 2011).
Figure 5. Comparing the dynamics of the isolated NTD to that embedded in the 3-layered framework of the receptor.

(A) The motions of the AMPAR NTD tetramer in the isolated subsystem (deep purple) are conserved in the context of the rest of the structure (environment; faded purple). The matrix shows the correlations between the top 20 modes accessible to the 3KG2 NTD tetramer alone and in the whole receptor. Darkest red and blue regions along the diagonal indicate strong correlations (same color code as Figure 1B). (B-D) Equivalent results are shown for the AMPAR NTD dimer and for the NMDAR NTD tetramer and dimer. The correlation maps where the red/blue dots depart from the diagonal indicate alterations in the dispersion (frequency distribution) of equivalent modes for the isolated substructure and that embedded in the overall structure. The mode distribution of the NTD tetramer shows the most pronounced dependence on its context (i.e. on being part of the 3-layered AMPAR or NMDAR structure).
Large-scale Reorientation of AMPAR NTD Dimers Is Detected by Cross-linking in HEK293 Cells
To assess whether AMPAR NTD pivoting motions can occur in cellulo, we mutated K262 to cysteine (K262C), which is expected to trap the NTD tetramer via a disulfide bridge (Figure 4B). To mimic the GluA2 variety used for the ANM analysis, we also combined K262C with the linker mutation, Δ-link, which was used in the GluA2cryst construct (PDB 3KG2) (Cais et al., 2014;Sobolevsky et al., 2009). GluA2 wild type (WT) and K262C mutant were expressed in HEK293 cells and protein extracts were analyzed by Western blotting. As shown in Figure 4E (top panel) a band representing a receptor dimer was indeed apparent in the cysteine mutant but not in GluA2 WT. This cross-linked species was also seen in K262C Δ-link and was sensitive to reduction by DTT. No GluA2 dimer was seen when introducing a cysteine adjacent to the K262 interaction-region, T38C, a position not expected to come into close proximity, whereas a dimer was apparent in the positive control LBD mutant S729C (Figure 4E) (Plested et al., 2009). Since these results do not differentiate between intracellular AMPAR assembly intermediates and mature receptors expressed at the cell surface, we also isolated the AMPAR surface pool using a biotinylation protocol. Similar to total lysates, mature surface AMPARs were also cross-linked selectively at K262C, in both full-length GluA2 and in Δ-link (Figure 4E bottom panel). Together with the subsystem analysis above, these results suggest that the ANM-predicted large motions at the NTD can also occur in WT AMPARs in cells and are not an artifact of the truncated linkers in the crystal structure.
Identifying potential effectors of Signal Transduction between the NTD and LBD Layers
Next, to shed light on residues that play a role in establishing the communication between the AMPAR domain layers in these global motions, we utilized the perturbation response scanning (PRS) approach (Atilgan et al., 2009). The PRS analysis permits the identification of two groups of residues, sensors and effectors, potentially involved in allosteric signal sensing and transmission, respectively (General IJ et al., 2014). The PRS map obtained for the AMPAR is presented in Figure 6A. The jth column describes the response of all residues to perturbation at j. The average over all elements in this column provides a measure of the ability of residue j to serve as a sensor (to transmit external signals to all others). The bar plot along the lower abscissa represents such averages, with the peaks indicating the residues having the highest potential to serve as sensors. Likewise, the ith row describes the response of the ith residue to perturbations at all sites. The peaks in the corresponding bar plot (right ordinate) point to efficient propagators of signals, or effectors.
Figure 6. Perturbation-Response Scanning (PRS) analysis of the AMPAR highlights residues acting as effectors and sensors for signal transduction.

(A) Normalized PRS map where strongest signals are shown in black (see scale on the right). The bar plot along the right ordinate shows the average propensity to transmit perturbation (each bar therein is the average over all elements of the PRS matrix in the corresponding row); and that along the lower abscissa is the average propensity to sense perturbations (average over all elements in each column). The corresponding peaks are effectors and sensors, respectively. Bars are colored-coded by chain (see schematic in Figure 2E). The orange bar and asterisk indicate the sensitivity profile of T78 to perturbations at all sites, which is shown in panel D. (B) The AMPAR structure color-coded by ability to propagate perturbations where red regions are strongest effectors. Zoomed-in views of the NTD (top) and the LBD (bottom) highlight some effectors. (C) The AMPAR structure is color-coded by sensitivity to perturbation (response shown in bar plot along lower abscissa). Red/orange regions are the most susceptible sites, called sensors, while dark blue regions are the most insensitive sites; green/cyan regions show moderate/distinguishable sensitivity. (D) Sensitivity profile of T78 in chain B to perturbation at all sites (abscissa) on all four chains. The peaks represent residues strongly coupled to T78.
Figure 6B highlights the strongest effectors (in red). These residues usually lie in the core regions of domains and occupy strategic positions. In the NTD, they are located at (i) the UL-UL interface of the dimers (e.g. T53 and T78, which form a water coordination site, and F82 mediating hydrophobic contacts) (Clayton et al., 2009b;Jin et al., 2009;Rossmann et al., 2011), (ii) the inter-lobe cleft (e.g. F70, R108 and L278), and (iii) the region bridging these sites (F68, I79 and F90). In the LBD, residues near the ligand-binding site (A475, P478, I481, M496, Y732, G733) and the dimer interface (K493-S497) emerge as the strongest effectors. The LBD positions detected in this analysis are interspersed between residues mediating channel activation and desensitization in response to agonist binding (Armstrong et al., 2000;Armstrong et al., 2006), whereas those in the NTD are involved in dimer interface formation and stability(Clayton et al., 2009a;Jin et al., 2009;Rossmann et al., 2011) and cleft dynamics (Dutta et al., 2012;Lau et al., 2013).
Sensors are located at the top of the NTD (αA and αH helices, and top loops) (Figure 6C), where they are exposed to potential synaptic interaction partners such as pentraxins (Sia et al., 2007) and N-cadherin (Saglietti et al., 2007). Whether these regions play a role in previously proposed retrograde AMPAR signaling (Ripley et al., 2011;Tracy et al., 2011) is currently unknown. Other sensors are apparent in the intracellular face of the TMD, where they could engage cytosolic AMPAR interactors (Shepherd et al., 2007).
Further analysis of the PRS matrix reveals that perturbations have both local (dark spots near the diagonal) and non-local effects (dark spots far from the diagonal). For example, perturbations within NTD upper lobes have effects on other residues in the same NTD upper lobes as well as NTDs, LBDs and TMDs of other chains. This is particularly pronounced in proximal chains B and D. Therefore we zoomed into two key effectors in chain B: T78, which is critical for NTD dimer stability, and A475 in the LBD. The perturbation-sensitivity profile in Figure 6D (highlighted with an orange bar in Figure 6A) shows the response of T78 (in chain B; blue trace) to perturbations at all other sites (throughout the tetramer). Peaks indicate the perturbation sites that have a high influence on T78 (in chain B; colored red in Figure 7A). Interestingly, apart from the spatial proximity of T78 (circled in Figure 7A), there appears to be strong coupling to the ligand-binding pocket and to the dimer interface in the LBD dimer immediately below (AD), which continues down to the TMD. Weaker associations also exist with the NTD CD and LBD BC dimers. Moreover, couplings between the NTD and LBD also exist for effectors at the LBD such as A475 (Figures 7B and 7C). Together, these observations raise the interesting possibility of inter-domain communication between the NTD dimer interface and the LBD agonist-binding site.
Figure 7. Coupling between NTD and LBD obtained from PRS.

(A) AMPAR structure color-coded by the profile in Figure 6D, with an ellipse highlighting the neighborhood of T78. (B) AMPAR structure color-coded by response profile of all residues to perturbation at A475 in the LBD of proximal subunit B (enclosed in the ellipse). Strong responses are distinguished at the proximal chain D NTD UL as well as the intracellular ends of the TMD helices. (C) AMPAR structure color-coded by sensitivity profile of A475 in the LBD of the proximal subunit B (enclosed in the ellipse) to perturbation of other residues. This region is most sensitive to local perturbations, although it also exhibits moderate sensitivity to both the NTD of proximal chain D and the TMD of distal chains A and C.
Identifying Mediators of Information Flow in iGluRs
To investigate strategic residues further we used the Gaussian Network Model (GNM) (Bahar et al., 1997), a robust model widely used for detecting hinge residues at the interface of protein domains/subunits that undergo en bloc movements as well as kinetic hotspots, or ‘centers of energy localization’, that confer strong resistance to deformation (Bahar et al., 2005;Demirel et al., 1998;Rader et al., 2004). The former are deduced from the crossover between oppositely moving (anticorrelated) regions in the global modes (Figure 8B), and the latter from the peaks of the highest frequency (local) modes (Figure 8C). The assumption of Gaussian and isotropic fluctuations enables better prediction of fluctuation amplitude at the expense of losing directional information. This allows us to more accurately pinpoint specific residues as anchors/hinges and hotspots.
Figure 8. Identification of residues with high allosteric potential.

(A) The GNM counterpart of Figure 1B shows high correlation of AMPAR and NMDAR GNM modes that disperse with increasing frequency (see also Figure 2). (B) Distribution of motions in GNM mode 2 of the AMPAR (top) and NMDAR (bottom). Global hinge residues are labeled. (C) Hotspots derived from the peaks in the GNM highest frequency modes obtained for AMPAR (top) and NMDAR (bottom). The dotted line indicates the cutoff above which the residues are identified as hotspots.
As evident from Figure 8A, GNM slow modes are highly correlated between the AMPAR and NMDAR, especially modes 1-4. In mode 2, the NTD undergoes large displacements in both receptors (Figure 8B), while the TMD is practically anchored in the membrane and the LBD undergoes relatively small but anticorrelated motion with respect to the NTD (see also Figures 2D and 2E). Specifically, dimers AB and CD undergo movements in opposite directions, and the NTD dimer-dimer interfacial residues I203 (in AMPAR) and C214 (in NMDAR) serve as anchors, consistent with our ANM results and biochemical data (Figure 4). In the NMDAR, we see that the top loops of GluN1 (chains A and C) are also constrained at an additional point of contact (E299).
In the LBD, the coupled dimers are interchanged as BC and AD, and the NTD proximal chains B and D (GluN2B in the NMDAR) undergo an inversion in direction at a hinge region in the NTD-LBD linker, near AMPARE391 and NMDART410 (Figure 8B). This behavior follows the domain swapping between the NTD and LBD (Figure 2F) (Sobolevsky et al., 2009). The cross-correlation maps associated with this mode (Figures 2D and 2E) clearly show the strongly correlated regions that move together (red) or in opposite directions (blue) along this mode axis. In accord with our subsystem analysis (Figure 5), the NTDs of the dimers AB and CD each form highly coherent blocks (red boxes) while those of subunits A/C, A/D, B/C and C/D are anticorrelated (i.e. they are coupled but move in opposite directions) (blue boxes). The TMD is highly immobile in this mode, whereas the LBD/TMD linker residues (D519 and M629 in AMPAR and R548 and R659 in NMDAR) serve as hinges permitting the flexure/bending of the LBD with respect to the TMD rigidly embedded in the membrane.
Hotspots are residues obtained from the other (high-frequency) end of the GNM mode spectrum and could serve as centers of energy localization in intra-subunit signal transmission. They are usually highly conserved and located at the core of structural modules/domains. Figure 8C shows the GNM hotspots for the two iGluRs. Interestingly, some of AMPAR hotspots match (or closely neighbor) the effectors identified above by PRS, including S75 in the NTD as well as A475 and G733 in the LBD (Figures 6 and 7), suggesting their potential role in transmitting signals within the ECR. They are also largely maintained across all four subunits, evidenced by the overlap between the curves for the four chains. This is because they are at the highest-connectivity (or highest packing-density) regions, irrespective of quaternary assembly. The NMDAR shows the same pattern as the AMPAR, with some residues conserved as hotspots across the two receptors (e.g. NMDAR V406, S501 and V721 and their AMPAR counterparts V409, T539 and V693, respectively), as well as appearing in the NTD and LBD ULs like the PRS effectors. We also note the hotspots at the TMD M3 helix in both receptors including AMPAR A621, next to the “Lurcher” mutation site (Schwarz et al., 2001;Zuo et al., 1997), strategically located adjacent to the channel gate.
Discussion
Our analysis elucidated the dynamics and dominant mechanisms of cooperative interdomain and intersubunit motions in two main iGluRs. These are consistent with experimentally observed conformational snapshots from crystallography and cryo-EM, which have been linked to receptor gating (Durr et al., 2014;Meyerson et al., 2014;Nakagawa et al., 2005). These global motions permit dramatic reconfigurations between the two iGluR subtypes, i.e. compaction of the more loosely organized AMPAR resulting into an NMDAR-like conformation and vice versa. The results suggest that the two structures are alternative conformations favored by the modular tetrameric architecture; these can interconvert via energetically favorable collective rearrangements, despite the apparent RMSD (of > 17Å) in their crystal structures and their relatively low (~ 30%) sequence identity. The transition involves more than one or two modes, similar to the segmented pathways noted in other proteins (Das et al., 2014; Lei et al., 2009; Moradi et al., 2013). Yet, even the reverse transition (of NMDAR into AMPAR-like configuration) is accomplished with a small fraction soft modes; 0.4% of the mode spectrum is sufficient to attain a cumulative overlap of 0.8 with the transition direction. The results also suggest an overall conservation in allosteric landscape between these two iGluR subfamilies. Lastly, we identified strategic residues that orchestrate these motions and that could mediate signal transmission between the iGluR layers down to the ion channel gate.
A dominant motion in both iGluRs is the large-scale concerted opening/closing of the dimers in the NTD layer. Large-scale motions in the AMPAR NTD have been described repeatedly (Durr et al., 2014;Meyerson et al., 2014;Nakagawa et al., 2005). A complete separation of the NTD dimers in AMPARs is triggered by agonists and has been linked to desensitization (Meyerson et al., 2014;Nakagawa et al., 2005), while in the active and resting state the NTD dimers are held together via a small interface, which allows for the pivoting motion in a number of soft modes. Interestingly, the NTD pivoting motions observed here appear to be coupled to the rotation of the TMD around its central axis, which induces an enlargement in the central pore. Similar corkscrew-like motions of the TMD have been observed in an ANM analysis of the structurally related potassium channels (Shrivastava et al., 2006) as well as in an all-atom targeted MD study of GluA2 (Dong et al., 2011).
It is of interest to see to what extent the length of the interdomain linker affects the global motions. The motions may be affected if the interdomain packing geometry is altered. Whereas NTD-LBD contacts were apparent in modified AMPARs with shortened linkers (Durr et al., 2014;Sobolevsky et al., 2009;Yelshanskaya et al., 2014) they are absent in a GluA2 cryo-EM structure with intact linkers (Meyerson et al., 2014). ANM analysis of this EM-structure and alternative AMPAR structures (complexed with various LBD ligands and differing in NTD-LBD linker length) yielded similar motions (e.g. Figure S1B). Apart from NTD-LBD contacts, this interface can also accommodate small-molecule drugs (Khatri et al., 2014), toxins (Chen et al., 2014), AMPAR auxiliary proteins (Cais et al., 2014;Shanks et al., 2014) and perhaps other synaptic interaction partners (Schwenk et al., 2012). These interactions likely impact the allosteric spectrum of the receptor. It is curious that in NMDARs, where current structures reveal close contacts between NTD and the LBD (Karakas et al., 2014;Lee et al., 2014), these linkers take part in the NTD-driven control of gating (Gielen et al., 2009). This may indicate a role for the linker in accommodating interface repositioning. Related to this, we see that the NMDAR is predisposed to undergo a conformational change towards a loosely arranged, AMPAR-like ECR along a few soft modes; the associated opening of its NTD layer can readily release/weaken the packing interactions with the LBD (Movie 11). Likewise AMPARs can access conformations resembling the NMDAR (Figure 3 and Movie 10). The loose packing of the NTD and LBD makes this transition (intrinsically favored by the shared modular architecture of the two iGluRs) easier than the reverse (NMDAR to AMPAR) transition. Rearrangements in both directions are further accommodated by the linkers, which are indicated by the GNM analysis to serve as hinges.
In NMDARs, allosteric coupling between the NTD and LBD involves the ligand-binding clefts between the UL and LL of the monomers, and dimer interfaces in both domain layers (Gielen et al., 2008;Gielen et al., 2009;Karakas et al., 2011;Mony et al., 2011;Zhu et al., 2013). NTD cleft opening/closing motions are readily apparent in the NMDAR, these are seen in the isolated domain(Dutta et al., 2012) and in the intact receptor a number of modes (e.g. uc12NMDAR) show cleft motions particularly in GluN1. In the latter, cleft motions and inter-lobe twisting appear to be coupled to intra-dimer rearrangements. Signs of AMPAR NTD allostery have been described (Cais et al., 2014). These depended upon the auxiliary subunit Stargazin (TARP γ-2), which has been proposed to ‘bridge’ the loosely connected NTD to the LBD. This observation adds to previous work implying allosteric activity for AMPAR NTDs (Dutta et al., 2012;Sukumaran et al., 2011). The dramatic compression of the AMPAR to an NMDAR-like ECR (along u4AMPAR; Movie 10) resulting in an interdigitating between the NTD and LBD layers, further highlights an allosteric potential for the AMPAR NTD.
Our PRS (Figure 6) and GNM (Figure 8) analyses revealed residues mapping to both clamshell clefts (e.g. AMPAR R108-D110 in the NTD and Y732-G733 in the LBD) as well as the NTD intradimer interface (e.g. T78) or LBD UL core (e.g. A475). Figure 6 further suggests that perturbations at the NTD UL-UL dimer interface, which may originate from ligand-binding, have an impact on the LBD. Furthering this type of analysis in combination with functional and structural data will ultimately provide a more complete picture of the mechanism of information flow through these complex signaling machines.
Experimental Procedures
We present a concise description of the methods, and refer to SI and references therein for a detailed description.
Analysis of Collective Modes using the Elastic Network Models ANM and GNM
ANM modes were obtained from the nonzero eigenvalues λk and eigenvectors uk of the ANM Hessian matrix H (1 ≤ k ≤ 3N-6) that is readily expressed in terms of the α-carbon coordinates in the examined crystal structure (Atilgan et al., 2001;Bahar et al., 2010a;Eyal et al., 2015). In the GNM, the N × N Kirchhoff matrix Γ replaces H (Bahar et al., 1997;Bahar et al., 2005). Both methods yield a unique solution for the mode spectrum. The Hessian is not invertible (rank: 3N-6) and hence its pseudo inverse is C = H−1 = Σk [λk−1 uk ukT] where the summation is performed over the nonzero eigenvalues λk and eigenvectors uk of H (1 ≤ k ≤ 3N-6). Each eigenvalue λk½ provides a measure of the frequency of mode k. The eigenvector uk is a normalized 3N-dimensional vector that describes the displacements of the N residues (x-, y-, and z-components) driven by mode k. Thus each mode makes a weighted contribution (λk−1 serving as the weight of mode k) to the covariance, and the slower modes make larger contributions. These are called global (as opposed to local, for fast modes) as they cooperatively involve large substructures, if not the entire molecule. The square displacement of a residue i from its equilibrium position for each mode is given by (ΔRi)2 ~ λk−1 [uk ukT]ii where [uk ukT]ii designates the ith diagonal element of the matrix uk ukT (Atilgan et al., 2001; Bahar et al., 2010b). The mobility profile associated with a given mode k is obtained by plotting [uk ukT]ii against i. Figure 4C represents such a mobility profiles for the ANM mode k=2 of AMPAR.
Correlation between ANM Modes and Experimental Structural Deformations
The presence of multiple structures (say qa, qb) enables us to assess the capability of ANM modes to predict the transition between these states. To identify how well this targeted deformation (d = qb − qa) can be achieved by moving along ANM modes, we evaluate the overlap or correlation cosine (Ik) between the eigenvector uk and d, given by Ik = d · uk/|d|. The bars in Figures 1C and 1D represent these correlation cosines obtained for d = dAM-PAR↔NMDAR. The cumulative overlap (red curve in Figures 1C and 1D) contributed by a subset of k modes is given by the square root of the sum of square overlaps over these modes, [Σk Ik2]1/2. Note that again, in the case of a 'random' mode, the overlap would be (1/3N-6)1/2. The green curve illustrates this type of 'expected' correlation if the calculated modes did not correlate with d. The large difference between the red and green curve shows that the energetically favored (softest) modes of motion encoded by the NMDAR and AMPAR structures can enable the interconversion between the two resolved structures.
Perturbation Response Scanning (PRS)
The PRS theory (Atilgan et al., 2009) derives from Hooke’s law, applied to the ANM, where F = H ΔR or ΔR = H−1F. We measured the displacement of all residues, ΔR(i), in response to forces exerted on residue i, for all i=1 to N. Sensors and effectors were identified using the method described in recent work (General IJ et al., 2014). MD simulations were conducted using GROMACS 4 with the CHARMM27 force field with 2 fs timesteps, with production runs preceded by two rounds of steepest descent energy minimization and equilibration. Details and parameters can be found in the Supplementary Material.
Cross-linking and surface biotinylation
The mutations K262C, T38C and S729C were introduced into GluA2 wt and Δ-link by Quikchange mutagenesis. These mutants as well as GluA2 wt and Δ-link were transfected into HEK293T cells using the Effectene® transfection reagent (Qiagen). Following expression for ~36 hours, cells were harvested and lysed in detergent to solubilise membrane proteins. For analysis of cell surface AMPARs, surface proteins were biotinylated prior to cell harvesting and purified using streptavidin beads. Total and surface AMPARs were analysed by SDS-PAGE and Western blotting.
Supplementary Material
Highlights.
First insights into the dynamic spectrum of AMPA and NMDA receptors
The two iGluRs can structurally interconvert
AMPARs and NMDARs share similar global dynamics despite structural differences
Identification of residues that mediate the allosteric coupling between ECR and TMD
Acknowledgments
Support from the National Institutes of Health Grants P41 GM103712 and P30 DA035778 is gratefully acknowledged by IB. We thank Mr. G. Lum for creating the web interface with the movies. We thank B. Herguedas for critically reading the manuscript. JK, JG-N and IHG were supported by the Medical Research Council (MC_U105174197) and by MRC-T.
Footnotes
Publisher's Disclaimer: This is a PDF file of an unedited manuscript that has been accepted for publication. As a service to our customers we are providing this early version of the manuscript. The manuscript will undergo copyediting, typesetting, and review of the resulting proof before it is published in its final citable form. Please note that during the production process errors may be discovered which could affect the content, and all legal disclaimers that apply to the journal pertain.
Author Contributions
I.H.G and I.B. designed research; A.D., J.K., J.G.-N., and J.Y.L. performed research; A.D., J.K., J.Y.L., I.H.G and I.B. analyzed data; and A.D., I.H.G. and I.B. wrote the manuscript.
References
- Arinaminpathy Y, Sansom MS, Biggin PC. Binding site flexibility: molecular simulation of partial and full agonists within a glutamate receptor. Mol. Pharmacol. 2006;69:11–18. doi: 10.1124/mol.105.016691. [DOI] [PubMed] [Google Scholar]
- Armstrong N, Gouaux E. Mechanisms for activation and antagonism of an AMPA-sensitive glutamate receptor: crystal structures of the GluR2 ligand binding core. Neuron. 2000;28:165–181. doi: 10.1016/s0896-6273(00)00094-5. [DOI] [PubMed] [Google Scholar]
- Armstrong N, Jasti J, Beich-Frandsen M, Gouaux E. Measurement of conformational changes accompanying desensitization in an ionotropic glutamate receptor. Cell. 2006;127:85–97. doi: 10.1016/j.cell.2006.08.037. [DOI] [PubMed] [Google Scholar]
- Atilgan AR, Durell SR, Jernigan RL, Demirel MC, Keskin O, Bahar I. Anisotropy of fluctuation dynamics of proteins with an elastic network model. Biophys. J. 2001;80:505–515. doi: 10.1016/S0006-3495(01)76033-X. [DOI] [PMC free article] [PubMed] [Google Scholar]
- Atilgan C, Atilgan AR. Perturbation-response scanning reveals ligand entry-exit mechanisms of ferric binding protein. PLoS Comput Biol. 2009;5:e1000544. doi: 10.1371/journal.pcbi.1000544. [DOI] [PMC free article] [PubMed] [Google Scholar]
- Bahar I. On the functional significance of soft modes predicted by coarse-grained models for membrane proteins. J. Gen. Physiol. 2010;135:563–573. doi: 10.1085/jgp.200910368. [DOI] [PMC free article] [PubMed] [Google Scholar]
- Bahar I, Atilgan AR, Erman B. Direct evaluation of thermal fluctuations in proteins using a single-parameter harmonic potential. Fold. Des. 1997;2:173–181. doi: 10.1016/S1359-0278(97)00024-2. [DOI] [PubMed] [Google Scholar]
- Bahar I, Lezon TR, Yang LW, Eyal E. Global Dynamics of Proteins: Bridging Between Structure and Function. Annu. Rev. Biophys. 2010a;39:23–42. doi: 10.1146/annurev.biophys.093008.131258. [DOI] [PMC free article] [PubMed] [Google Scholar]
- Bahar I, Rader AJ. Coarse-grained normal mode analysis in structural biology. Curr. Opin. Struct. Biol. 2005;15:586–592. doi: 10.1016/j.sbi.2005.08.007. [DOI] [PMC free article] [PubMed] [Google Scholar]
- Bahar I, Lezon TR, Bakan A, Shrivastava IH. Normal mode analysis of biomolecular structures: functional mechanisms of membrane proteins. Chem. Rev. 2010b;110:1463–1497. doi: 10.1021/cr900095e. [DOI] [PMC free article] [PubMed] [Google Scholar]
- Bjerrum EJ, Biggin PC. Rigid body essential X-ray crystallography: distinguishing the bend and twist of glutamate receptor ligand binding domains. Proteins. 2008;72:434–446. doi: 10.1002/prot.21941. [DOI] [PubMed] [Google Scholar]
- Bleakman D, Alt A, Witkin JM. AMPA receptors in the therapeutic management of depression. CNS. Neurol. Disord. Drug Targets. 2007;6:117–126. doi: 10.2174/187152707780363258. [DOI] [PubMed] [Google Scholar]
- Bowie D. Ionotropic glutamate receptors & CNS disorders. CNS. Neurol. Disord. Drug Targets. 2008;7:129–143. doi: 10.2174/187152708784083821. [DOI] [PMC free article] [PubMed] [Google Scholar]
- Cais O, Heruedas B, Krol K, Cull-Candy SG, Farrent M, Greger IH. Mapping the Interaction Sites between AMPA Receptors and TARPs Reveals a Role for the Receptor N-Terminal Domain in Channel Gating. Cell Reports. 2014;9:728–740. doi: 10.1016/j.celrep.2014.09.029. [DOI] [PMC free article] [PubMed] [Google Scholar]
- Chen L, Durr KL, Gouaux E. X-ray structures of AMPA receptor-cone snail toxin complexes illuminate activation mechanism. Science. 2014;345:1021–1026. doi: 10.1126/science.1258409. [DOI] [PMC free article] [PubMed] [Google Scholar]
- Clayton A, Siebold C, Gilbert RJ, Sutton GC, Harlos K, McIlhinney RA, Jones EY, Aricescu AR. Crystal structure of the GluR2 amino-terminal domain provides insights into the architecture and assembly of ionotropic glutamate receptors. J Mol. Biol. 2009b;392:1125–1132. doi: 10.1016/j.jmb.2009.07.082. [DOI] [PubMed] [Google Scholar]
- Clayton A, Siebold C, Gilbert RJ, Sutton GC, Harlos K, McIlhinney RA, Jones EY, Aricescu AR. Crystal structure of the GluR2 amino-terminal domain provides insights into the architecture and assembly of ionotropic glutamate receptors. J Mol. Biol. 2009a;392:1125–1132. doi: 10.1016/j.jmb.2009.07.082. [DOI] [PubMed] [Google Scholar]
- Das A, Gur M, Cheng MH, Jo S, Bahar I, Roux B. Exploring the conformational transitions of biomolecular systems using a simple two-state anisotropic network model. PLoS. Comput. Biol. 2014;10:e1003521. doi: 10.1371/journal.pcbi.1003521. [DOI] [PMC free article] [PubMed] [Google Scholar]
- Dawe GB, Musgaard M, Andrews ED, Daniels BA, Aurousseau MR, Biggin PC, Bowie D. Defining the structural relationship between kainate-receptor deactivation and desensitization. Nat. Struct. Mol. Biol. 2013;20:1054–1061. doi: 10.1038/nsmb.2654. [DOI] [PMC free article] [PubMed] [Google Scholar]
- Demirel MC, Atilgan AR, Jernigan RL, Erman B, Bahar I. Identification of kinetically hot residues in proteins. Protein Sci. 1998;7:2522–2532. doi: 10.1002/pro.5560071205. [DOI] [PMC free article] [PubMed] [Google Scholar]
- Dong H, Zhou HX. Atomistic mechanism for the activation and desensitization of an AMPA-subtype glutamate receptor. Nat. Commun. 2011;2:354. doi: 10.1038/ncomms1362. [DOI] [PMC free article] [PubMed] [Google Scholar]
- Durr KL, Chen L, Stein RA, De ZR, Folea IM, Walz T, McHaourab HS, Gouaux E. Structure and dynamics of AMPA receptor GluA2 in resting, pre-open, and desensitized states. Cell. 2014;158:778–792. doi: 10.1016/j.cell.2014.07.023. [DOI] [PMC free article] [PubMed] [Google Scholar]
- Dutta A, Shrivastava IH, Sukumaran M, Greger IH, Bahar I. Comparative dynamics of NMDA- and AMPA-glutamate receptors N-Terminal Domains. Structure. 2012;20:1838–1849. doi: 10.1016/j.str.2012.08.012. [DOI] [PMC free article] [PubMed] [Google Scholar]
- Eyal E, Lum G, Bahar I. The anisotropic network model web server at 2015 (ANM 2.0) Bioinformatics. 2015;31:1487–1489. doi: 10.1093/bioinformatics/btu847. [DOI] [PMC free article] [PubMed] [Google Scholar]
- General IJ, Liu Y, Blackburn ME, Mao W, Gierasch LM, Bahar I. ATPase subdomain IA is a mediator of interdomain allostery in Hsp70 molecular chaperones. PLoS Comput Biol. 2014;10:e1003624. doi: 10.1371/journal.pcbi.1003624. [DOI] [PMC free article] [PubMed] [Google Scholar]
- Gielen M, Le GA, Stroebel D, Johnson JW, Neyton J, Paoletti P. Structural rearrangements of NR1/NR2A NMDA receptors during allosteric inhibition. Neuron. 2008;57:80–93. doi: 10.1016/j.neuron.2007.11.021. [DOI] [PMC free article] [PubMed] [Google Scholar]
- Gielen M, Siegler RB, Mony L, Johnson JW, Paoletti P. Mechanism of differential control of NMDA receptor activity by NR2 subunits. Nature. 2009;459:703–707. doi: 10.1038/nature07993. [DOI] [PMC free article] [PubMed] [Google Scholar]
- Jin R, Singh SK, Gu S, Furukawa H, Sobolevsky AI, Zhou J, Jin Y, Gouaux E. Crystal structure and association behaviour of the GluR2 amino-terminal domain. EMBO J. 2009;28:1812–1823. doi: 10.1038/emboj.2009.140. [DOI] [PMC free article] [PubMed] [Google Scholar]
- Karakas E, Furukawa H. Crystal structure of a heterotetrameric NMDA receptor ion channel. Science. 2014;344:992–997. doi: 10.1126/science.1251915. [DOI] [PMC free article] [PubMed] [Google Scholar]
- Karakas E, Simorowski N, Furukawa H. Subunit arrangement and phenylethanolamine binding in GluN1/GluN2B NMDA receptors. Nature. 2011;475:249–253. doi: 10.1038/nature10180. [DOI] [PMC free article] [PubMed] [Google Scholar]
- Khatri A, Burger PB, Swanger SA, Hansen KB, Zimmerman S, Karakas E, Liotta DC, Furukawa H, Snyder JP, Traynelis SF. Structural determinants and mechanism of action of a GluN2C-selective NMDA receptor positive allosteric modulator. Mol. Pharmacol. 2014;86:548–560. doi: 10.1124/mol.114.094516. [DOI] [PMC free article] [PubMed] [Google Scholar]
- Kuner T, Seeburg PH, Guy HR. A common architecture for K+ channels and ionotropic glutamate receptors? Trends Neurosci. 2003;26:27–32. doi: 10.1016/s0166-2236(02)00010-3. [DOI] [PubMed] [Google Scholar]
- Lau AY, Roux B. The hidden energetics of ligand binding and activation in a glutamate receptor. Nat. Struct. Mol. Biol. 2011;18:283–287. doi: 10.1038/nsmb.2010. [DOI] [PMC free article] [PubMed] [Google Scholar]
- Lau AY, Salazar H, Blachowicz L, Ghisi V, Plested AJ, Roux B. A conformational intermediate in glutamate receptor activation. Neuron. 2013;79:492–503. doi: 10.1016/j.neuron.2013.06.003. [DOI] [PMC free article] [PubMed] [Google Scholar]
- Lee CH, Lu W, Michel JC, Goehring A, Du J, Song X, Gouaux E. NMDA receptor structures reveal subunit arrangement and pore architecture. Nature. 2014;511:191–197. doi: 10.1038/nature13548. [DOI] [PMC free article] [PubMed] [Google Scholar]
- Lei M, Velos J, Gardino A, Kivenson A, Karplus M, Kern D. Segmented transition pathway of the signaling protein nitrogen regulatory protein C. J. Mol. Biol. 2009;392:823–836. doi: 10.1016/j.jmb.2009.06.065. [DOI] [PMC free article] [PubMed] [Google Scholar]
- Lezon TR, Bahar I. Constraints Imposed by the Membrane Selectively Guide the Alternating Access Dynamics of the Glutamate Transporter Glt(Ph) Biophysical Journal. 2012;102:1331–1340. doi: 10.1016/j.bpj.2012.02.028. [DOI] [PMC free article] [PubMed] [Google Scholar]
- Malinow R. New developments on the role of NMDA receptors in Alzheimer's disease. Curr. Opin. Neurobiol. 2012;22:559–563. doi: 10.1016/j.conb.2011.09.001. [DOI] [PMC free article] [PubMed] [Google Scholar]
- Malinow R, Malenka RC. AMPA receptor trafficking and synaptic plasticity. Annu. Rev Neurosci. 2002;25:103–126. doi: 10.1146/annurev.neuro.25.112701.142758. [DOI] [PubMed] [Google Scholar]
- Mayer ML. Glutamate receptors at atomic resolution. Nature. 2006;440:456–462. doi: 10.1038/nature04709. [DOI] [PubMed] [Google Scholar]
- Meyerson JR, Kumar J, Chittori S, Rao P, Pierson J, Bartesaghi A, Mayer ML, Subramaniam S. Structural mechanism of glutamate receptor activation and desensitization. Nature. 2014;514:328–334. doi: 10.1038/nature13603. [DOI] [PMC free article] [PubMed] [Google Scholar]
- Ming D, Wall ME. Interactions in native binding sites cause a large change in protein dynamics. J. Mol. Biol. 2006;358:213–223. doi: 10.1016/j.jmb.2006.01.097. [DOI] [PubMed] [Google Scholar]
- Mony L, Zhu S, Carvalho S, Paoletti P. Molecular basis of positive allosteric modulation of GluN2B NMDA receptors by polyamines. EMBO J. 2011;30:3134–3146. doi: 10.1038/emboj.2011.203. [DOI] [PMC free article] [PubMed] [Google Scholar]
- Moradi M, Tajkhorshid E. Mechanistic picture for conformational transition of a membrane transporter at atomic resolution. Proc. Natl. Acad. Sci. U. S. A. 2013;110:18916–18921. doi: 10.1073/pnas.1313202110. [DOI] [PMC free article] [PubMed] [Google Scholar]
- Nakagawa T, Cheng Y, Ramm E, Sheng M, Walz T. Structure and different conformational states of native AMPA receptor complexes. Nature. 2005;433:545–549. doi: 10.1038/nature03328. [DOI] [PubMed] [Google Scholar]
- Partin KM. AMPA receptor potentiators: from drug design to cognitive enhancement. Curr. Opin. Pharmacol. 2014;20C:46–53. doi: 10.1016/j.coph.2014.11.002. [DOI] [PMC free article] [PubMed] [Google Scholar]
- Plested AJ, Mayer ML. AMPA receptor ligand binding domain mobility revealed by functional cross linking. J Neurosci. 2009;29:11912–11923. doi: 10.1523/JNEUROSCI.2971-09.2009. [DOI] [PMC free article] [PubMed] [Google Scholar]
- Rader AJ, Anderson G, Isin B, Khorana HG, Bahar I, Klein-Seetharaman J. Identification of core amino acids stabilizing rhodopsin. Proc. Natl. Acad. Sci. U. S. A. 2004;101:7246–7251. doi: 10.1073/pnas.0401429101. [DOI] [PMC free article] [PubMed] [Google Scholar]
- Ripley B, Otto S, Tiglio K, Williams ME, Ghosh A. Regulation of synaptic stability by AMPA receptor reverse signaling. Proc. Natl. Acad. Sci. U. S. A. 2011;108:367–372. doi: 10.1073/pnas.1015163108. [DOI] [PMC free article] [PubMed] [Google Scholar]
- Rossmann M, Sukumaran M, Penn AC, Veprintsev DB, Babu MM, Greger IH. Subunit-selective N-terminal domain associations organize the formation of AMPA receptor heteromers. EMBO J. 2011;30:959–971. doi: 10.1038/emboj.2011.16. [DOI] [PMC free article] [PubMed] [Google Scholar]
- Saglietti L, Dequidt C, Kamieniarz K, Rousset MC, Valnegri P, Thoumine O, Beretta F, Fagni L, Choquet D, Sala C, Sheng M, Passafaro M. Extracellular interactions between GluR2 and N-cadherin in spine regulation. Neuron. 2007;54:461–477. doi: 10.1016/j.neuron.2007.04.012. [DOI] [PubMed] [Google Scholar]
- Schauder DM, Kuybeda O, Zhang J, Klymko K, Bartesaghi A, Borgnia MJ, Mayer ML, Subramaniam S. Glutamate receptor desensitization is mediated by changes in quaternary structure of the ligand binding domain. Proc. Natl. Acad. Sci. U. S. A. 2013;110:5921–5926. doi: 10.1073/pnas.1217549110. [DOI] [PMC free article] [PubMed] [Google Scholar]
- Schwarz MK, Pawlak V, Osten P, Mack V, Seeburg PH, Kohr G. Dominance of the lurcher mutation in heteromeric kainate and AMPA receptor channels. Eur. J Neurosci. 2001;14:861–868. doi: 10.1046/j.0953-816x.2001.01705.x. [DOI] [PubMed] [Google Scholar]
- Schwenk J, Harmel N, Brechet A, Zolles G, Berkefeld H, Muller CS, Bildl W, Baehrens D, Huber B, Kulik A, Klocker N, Schulte U, Fakler B. High-resolution proteomics unravel architecture and molecular diversity of native AMPA receptor complexes. Neuron. 2012;74:621–633. doi: 10.1016/j.neuron.2012.03.034. [DOI] [PubMed] [Google Scholar]
- Shanks NF, Cais O, Maruo T, Savas JN, Zaika EI, Azumaya CM, Yates JR, III, Greger I, Nakagawa T. Molecular dissection of the interaction between the AMPA receptor and cornichon homolog-3. J. Neurosci. 2014;34:12104–12120. doi: 10.1523/JNEUROSCI.0595-14.2014. [DOI] [PMC free article] [PubMed] [Google Scholar]
- Shepherd JD, Huganir RL. The cell biology of synaptic plasticity: AMPA receptor trafficking. Annu. Rev. Cell Dev. Biol. 2007;23:613–643. doi: 10.1146/annurev.cellbio.23.090506.123516. [DOI] [PubMed] [Google Scholar]
- Shrivastava IH, Bahar I. Common mechanism of pore opening shared by five different potassium channels. Biophys. J. 2006;90:3929–3940. doi: 10.1529/biophysj.105.080093. [DOI] [PMC free article] [PubMed] [Google Scholar]
- Sia GM, Beique JC, Rumbaugh G, Cho R, Worley PF, Huganir RL. Interaction of the N-terminal domain of the AMPA receptor GluR4 subunit with the neuronal pentraxin NP1 mediates GluR4 synaptic recruitment. Neuron. 2007;55:87–102. doi: 10.1016/j.neuron.2007.06.020. [DOI] [PubMed] [Google Scholar]
- Sobolevsky AI, Rosconi MP, Gouaux E. X-ray structure, symmetry and mechanism of an AMPA-subtype glutamate receptor. Nature. 2009;462:745–756. doi: 10.1038/nature08624. [DOI] [PMC free article] [PubMed] [Google Scholar]
- Sukumaran M, Rossmann M, Shrivastava I, Dutta A, Bahar I, Greger IH. Dynamics and allosteric potential of the AMPA receptor N-terminal domain. EMBO J. 2011;30:972–982. doi: 10.1038/emboj.2011.17. [DOI] [PMC free article] [PubMed] [Google Scholar]
- Tracy TE, Yan JJ, Chen L. Acute knockdown of AMPA receptors reveals a transsynaptic signal for presynaptic maturation. EMBO J. 2011;30:1577–1592. doi: 10.1038/emboj.2011.59. [DOI] [PMC free article] [PubMed] [Google Scholar]
- Traynelis SF, Wollmuth LP, McBain CJ, Menniti FS, Vance KM, Ogden KK, Hansen KB, Yuan H, Myers SJ, Dingledine R. Glutamate receptor ion channels: structure, regulation, and function. Pharmacol. Rev. 2010;62:405–496. doi: 10.1124/pr.109.002451. [DOI] [PMC free article] [PubMed] [Google Scholar]
- Yelshanskaya MV, Li M, Sobolevsky AI. Structure of an agonist-bound ionotropic glutamate receptor. Science. 2014;345:1070–1074. doi: 10.1126/science.1256508. [DOI] [PMC free article] [PubMed] [Google Scholar]
- Zheng W, Brooks BR. Probing the local dynamics of nucleotide-binding pocket coupled to the global dynamics: myosin versus kinesin. Biophys J. 2005;89:167–178. doi: 10.1529/biophysj.105.063305. [DOI] [PMC free article] [PubMed] [Google Scholar]
- Zhu S, Stroebel D, Yao CA, Taly A, Paoletti P. Allosteric signaling and dynamics of the clamshell-like NMDA receptor GluN1 N-terminal domain. Nat. Struct. Mol. Biol. 2013;20:477–485. doi: 10.1038/nsmb.2522. [DOI] [PubMed] [Google Scholar]
- Zuo J, De Jager PL, Takahashi KA, Jiang W, Linden DJ, Heintz N. Neurodegeneration in Lurcher mice caused by mutation in delta2 glutamate receptor gene. Nature. 1997;388:769–773. doi: 10.1038/42009. [DOI] [PubMed] [Google Scholar]
Associated Data
This section collects any data citations, data availability statements, or supplementary materials included in this article.