Garcia-Ruiz, H., Takeda, A., Chapman, E.J., Sullivan, C.M., Fahlgren, N., Brempelis, K.J., and Carrington, J.C. (2010). Arabidopsis RNA-dependent RNA polymerases and dicer-like proteins in antiviral defense and small interfering RNA biogenesis during Turnip mosaic virus infection. Plant Cell 22: 481–496.
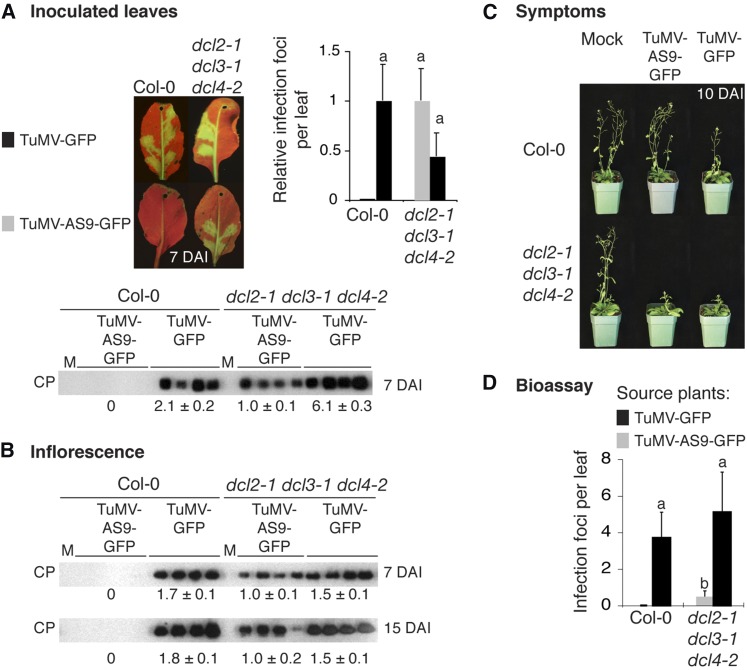
An incorrect immunoblot panel for samples from inoculated leaves was mistakenly included in Figure 3A. The data for coat protein (CP) accumulation in inoculated leaves in the original panel A were incorrectly based on the samples from systemically infected inflorescence tissues shown in panel B (7 DAI time point). This was an inadvertent mistake, as the blots were very similar in appearance. A corrected version of Figure 3A using the intended inoculated leaf samples and corresponding recalculated values for relative levels of CP/infection focus (shown in panel A) is given here. The original (incorrect) versus corrected values associated with CP accumulation in panel A are as follows:
| Sample | Original Value | Corrected Value |
|---|---|---|
| Col-0: TuMV-AS9-GFP | 0 (no band detected) | 0 (no band detected) |
| Col-0: TuMV-GFP | 3.6 ± 0.4 | 2.1 ± 0.2 |
| dcl2-1 dcl3-1 dcl4-2: TuMV-AS9-GFP | 1.0 ± 0.01 | 1.0 ± 0.1 |
| dcl2-1 dcl3-1 dcl4-2: TuMV-GFP | 4.9 ± 0.1 | 6.1 ± 0.3 |
Figure 3.
Local and Systemic Infection of Arabidopsis by TuMV-GFP and TuMV-AS9-GFP.
(A) Infection efficiency and CP accumulation in inoculated leaves at 7 DAI. Images were taken at 7 DAI under UV light. The number of infection foci for TuMV-GFP and TuMV-AS9-GFP was expressed relative to those in Col-0 (2.6 ± 1 foci per leaf) or dcl2-1 dcl3-2 dcl 4-2 (4.6 ± 1.5), respectively. The histogram shows the average + se for 52 leaves and 13 plants per treatment. For each virus, bars with the same letter are not statistically different (Tukey's test with α = 0.01). CP accumulation values (average ± se) were normalized to the average number of infection foci. M, mock inoculated.
(B) CP accumulation in inflorescence clusters at 7 and 15 DAI, relative to TuMV-AS9-GFP in dcl2-1 dcl3-2 dcl4-2 plants. Average + se for each virus-Arabidopsis genotype combination is indicated at the bottom.
(C) Col-0 and dcl2-1 dcl3-2 dcl4-2 triple mutant plants inoculated with TuMV-AS9-GFP or TuMV-GFP (10 DAI) or mock-inoculated.
(D) Bioassay of TuMV-AS9-GFP from systemically infected dcl2-1 dcl3-2 dcl4-2 mutant source plants (15 DAI). Average number of infection foci (+ se) at 7 DAI were plotted. Bars with the same letter are not statistically different (Tukey's test with α = 0.01).
The figure legend is unchanged from the original version. This correction does not affect any of the conclusions of the article. We regret that this error was not detected prior to publication.


