Abstract
In situ detection of specific cells offers a unique perspective on the spatial interactions between host immune cells and specific viral pathogens or cancers. Most immunohistochemistry techniques require manual cell counting on biopsied and fixed tissue sections. The availability of sophisticated software packages for analyzing fluorescently labeled tissue has made it possible to quickly and accurately quantitate the number of positive cells on such slides. Manual cell counting was compared to automatic cell counting using the program CellProfiler. The two techniques were used to count CD4+ and CD8+ T cells in human genital skin biopsies from herpesvirus type 2 (HSV-2) infected subjects. Manual counting and CellProfiler demonstrated high correlation both in cell counting as well as detection of immune cell “clustering” in tissue, an important visceral component of localized inflammation and characteristic of most chronic infections. Overall, CellProfiler is an effective and accurate method in addition to or replacement of manual cell counting of fluorescently labeled biopsies.
Keywords: cell counting, immunohistochemistry (IHC), software cell counting, HSV-2, CellProfiler
1. Introduction
The appreciation for and understanding of spatial relationships between host immune cells and pathogens or cancers has recently come to the forefront of research [1 2] as the infiltration of immune cells to localized tissue plays a significant roll in host-pathogen and host-cancer dynamics [3 4]. Manual cell counting, a common method for measuring cell population size, is time consuming and subject to interpreter variability. As such, there is a need for reproducible, accurate and quantitative techniques to characterize images, for which open source automated platform computer programs are available [5]. We sought to evaluate a software program that could reliably count stained cells in genital tissue biopsies of HSV-2 infected subjects even when clustered together, as focal accumulation of inflammation is a characteristic of most chronic viral infections [3 4 6]. The open source program CellProfiler has a number of useful features: it does not require programming, allows concurrent automated counting of multiple slides, can be configured to output an image indicating which cells were counted, and as an open source program is affordable [7]. The goal was to determine whether autocounting using CellProfiler produced similar results to manual counting by an experienced technologist who previously developed novel techniques for detecting several types of immune cells in tissue biopsies using detailed immunofluorescence staining.
2. Materials and methods
2.1. Biopsies and staining
Human skin and mucosa tissues were obtained from HSV-2+ volunteers according to study protocols and informed consent procedures approved by the Institutional Review Board at University of Washington and Fred Hutchison Cancer Research Center [8]. Immunofluorescence was performed to identify CD4+ and CD8+ T cells from consecutive genital skin biopsies and normal tissue (controls) as previously described [8]. Briefly, biopsy samples were obtained longitudinally from patients with genital herpes and stained with antibodies specific for CD4 and/or CD8 antigens and detected by Alexa Fluor 488 and/or Alexa Fluor 647 conjugated secondary antibodies and were counterstained with DAPI. See Table 1 for a description of the 175 samples used in the statistical analysis. Color images were acquired using a Tissuefax imaging system (TissueGnostics, Tarzana, CA, USA) at the Scientific Imaging Facility at the Fred Hutchison Cancer Research Center [6].
Table 1. Biopsy Details.
The distribution and count data of the biopsies used in the counting experiments. Biopsies were chosen to span the range of cell numbers and clustering encountered in typical HSV-2 longitudinal outbreaks which begin as lesions and then resolve over many weeks.
| Biopsy Type | Cell Count | Cell Count Average | Cell Count Range |
|---|---|---|---|
| Control | 27 | 90 | 18-222 |
| Lesion | 25 | 580 | 85-1766 |
| Healing | 16 | 212 | 43-594 |
| Shedding Site | 11 | 325 | 2-1158 |
| 2 week | 17 | 204 | 8-464 |
| 4 week | 16 | 130 | 17-690 |
| 6 week | 17 | 142 | 21-237 |
| 8 week | 16 | 160 | 27-745 |
| 12 week | 14 | 178 | 63-537 |
| 24 week | 16 | 136 | 24-353 |
2.2. Manual cell counting
Two technicians independently performed manual counts of the obtained images, which were then processed in ImageJ software [9]. Counts were collated with the autocount results blindly. Preceding manual counting, images were cropped, scaled to μm and separated by color channel, and artifacts were removed. An area tool was used to select the biopsy region and calculate the area. Cell numbers were expressed as counts/mm2. The ImageJ cell counter tool recorded mouse clicks on cells that were labeled with colored dots. The results were saved to a spreadsheet and screen shots were used to record the session.
2.3. Automated cell counting
CellProfiler uses the concept of pipelines that contain configurable modules that are run consecutively to complete counting tasks. This study's pipeline used 7 modules described in Table 2. Most of the modules have intuitive settings requiring limited additional elaboration. The key module was IdentifyPrimaryObjects, which is used for object identification. Before formally testing CellProfiler, representative images with different cell densities were selected to elucidate the most accurate settings for this module. Settings for minimum and maximum cell size were set to 8 and 20 μm. The threshold correction factor, which accounts for the area containing objects, was set to 1.3 μm. The thresholding method Otsu Global in three-class mode with middle intensity sent to the background helped avoid counting background as cells. CellProfiler has three algorithms for counting cells tightly spaced together. The option of saving outlines of counted cells allowed the generation of overlaid images from the CD4+ and CD8+ T-cell channels. When slides were single stained, CD4+ and CD8+ T cells were counted via the green channel; when double stained, CD4+ T and CD8+ T cells were counted in the green and red channels, respectively.
Table 2. CellProfiler Modules and Settings.
The seven CellProfiler modules that when run sequentially count cells from stained biopsy slides. Each module is listed with its function and the actual settings used that differ from defaults.
| Module | Function | Settings |
|---|---|---|
| LoadImages | Identify image files for processing | Any file ending in .tif |
| ColorToGray | Separate original color image into channels and convert to greyscale | Save red or green channel for further analysis depending on stain used |
| IdentifyPrimaryObjects | Select cells for measurements | Minimum cell diameter of 8 pixels, threshold correction factor 1.3, three-state Otsu Global thresholding with middle intensity sent to the background, retain cell outlines |
| MeasureObjectSize | Save cell counts | Use defaults |
| ExportToSpreadsheet | Export counts to spreadsheet format | Use defaults |
| OverlayOutlines | Overlay outlined counted cells on grey image | Green outlines on grey image |
| SaveImages | Choose name of exported images | Add red or green to end of image name and save every cycle |
2.4. Statistical Approach
The amount of discrepancy between the measurement techniques was estimated to be directly proportional to the value measured by either method. Given two measures X and Y resulting from the two different measurement techniques, the ratio X/Y will be within the range 1 ± Z%. A straightforward test is to determine whether the slope of a linear regression line (β) between the two measures will be within Z% of 1, or equivalently whether the correlation coefficient (ρ) between the two measures will be within Z% of 1. These are equivalent because β = ρ * σY / σX, and X and Y will have approximately equal variance (standard deviation σ). Simulation was performed in R, creating continuous measures with known correlation and subsequently using linear regression to compute the proportion of times the 95% confidence interval (CI) for the slope was entirely within the range (0.85, 1.15). When the (CI) for the slope is within this range, any systematic bias must have a magnitude of no more than 15% of the actual value. Through these simulations, it was demonstrated that with true correlation of 0.93 or higher, 175 samples would be sufficient to show, with 80% power, that the correlation is higher than 0.85. Bland-Altman plots were used to assess any potential relationship between disagreement between measurement methods and the magnitude of response.
3. Results
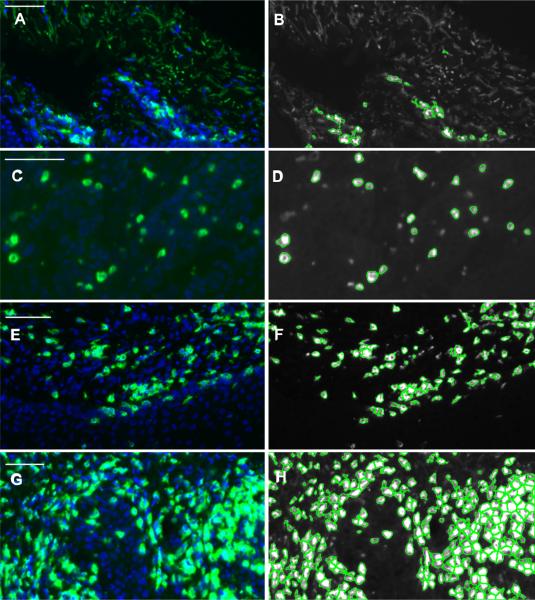
Counting cells in biopsies presents problems not seen when counting cells on slides or plates. Thresholds must be set high enough to avoid autofluorescence when present (Fig 1A and B). Very high autofluorescence can preclude autocellcounting. Slices cut from biopsies will contain portions of cells adjacent to the main plane of interest. This profile limited counting primarily to the main plane by choosing a threshold high enough to exclude portions of cells in adjacent planes (Fig 1C and D). Using DAPI signal in addition to signal intensity to select cells can be added to profiles, but for images of the size in this data set memory errors precluded this approach. The Laplacian of Gaussian with propagate setting was the best at delineating separate cells within clumped populations on slides with both moderate and dense cell clusters (Fig 1E, F and G, H).
Figure 1. Fluorescently labeled HSV-2 infected human skin biopsies for demonstrating settings.
Biopsies stained with CD4 (green) and DAPI (blue). Panels A and B shows cell counting success in the presence of autofluorescence. Panels C and D shows the threshold intensity cutoff leaves out cell not in the main focal plane. Panels E-H shows Laplacian of Gaussian setting separates clumped cells well in both moderate and dense cell sections. Scale bars = 50 μm.
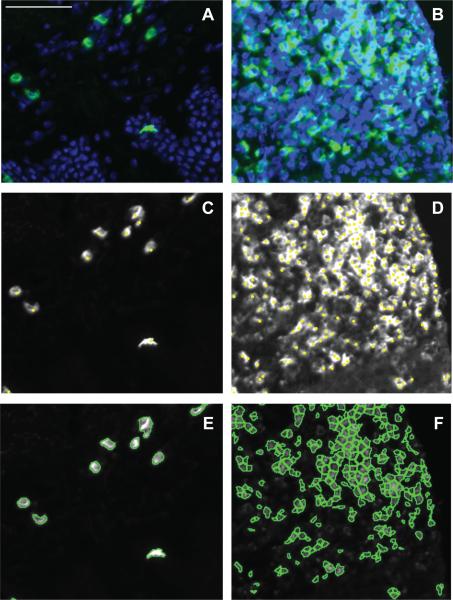
The fluorescent micrographs that were stained for CD4+ and CD8+ T cells (Fig. 2) include lesions with high cell numbers and large clusters of cells (Fig. 2B) as well as post lesion samples containing decreased lymphocyte infiltration and clustering (Fig. 2A). The ImageJ cell counter tool recorded mouse clicks on cells that were labeled with colored dots (Fig. 2C and D). Figure 2 panels E and F depict cells counted with the software program CellProfiler.
Figure 2. Low and high cell density fluorescently labeled HSV-2 infected human skin biopsies counted with two methods.
Immunohistochemistry of post lesion samples following the resolution of the outbreak (Panel A) and lesions with high cell numbers and large clusters of cells (Panel B) stained with CD4 (green) and DAPI (blue). Panels C and D are manually counted images with yellow dots indicating identified cells via mouse clicks. Panels E and F are counted with the software program CellProfiler. Scale bar = 50 μm.
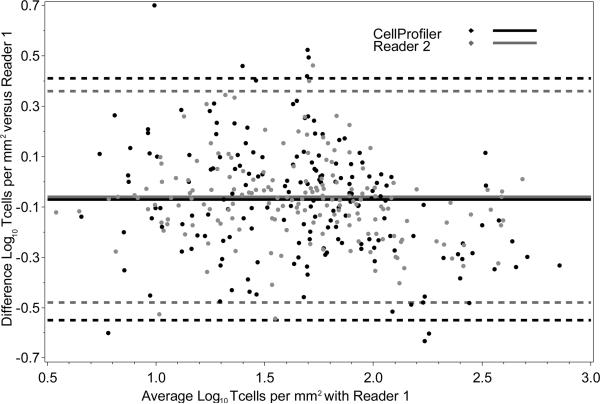
As shown using Bland-Altman plots in Figure 3, cell profiling produced similar data to the two manual reads. The average log transformed counts per mm2 between reader one and CellProfiler is plotted against the difference between the two, and a similar comparison is made between reader one and reader two. The 95% Cis for the difference between measurements are similarly wide for both reader two and CellProfiler compared to reader one; and show most pairs are within 0.5 logs. Further, the three correlations computed between each unique pair of counts ranged from 0.89 to 0.93 with the lower limits of the confidence intervals all above 85%. Any systematic difference between counts done by the readers and the machine was lower than 15% of the actual value.
Figure 3. Bland-Altman plot showing difference between two pairs of measurement methods in log_10 T cells per mm^2 (vertical axis) versus the average of the two methods (horizontal axis).
Dashed lines show 95% confidence intervals for the difference. The similarity of the widths of the confidence intervals indicates that both measurement methods compare favorably with reader one.
4. Discussion
There were major advantages to cell profiler counting. Once suitable settings were determined, slides were reproducibly counted, even for high cell density images, in 90 seconds compared to up to 10 minutes when done manually. This technique automatically captured overlays of mounted cells providing recorded images; something done manually using ImageJ. In addition, the process does not require user intervention.
This study shows that automated image analysis can be applied to evaluating CD4+ and CD8+ T-cell tissue infiltration in biopsied human tissue, despite the additional challenges of autofluorescence and greater depth of field. The adaptation of a simple open source image analysis program produced reliability, accuracy and reproducibility compared to the usually arduous manual counting by experienced technicians. In addition, counting allowed far more rapid processing of samples and importantly provided a longstanding archival record of the data, which allows retrospective independent evaluation.
There are issues to consider when using computer based counting methods. Programs will always perform best when background fluorescence is low and consistent among slides. Optimizing staining and image acquisition procedures to address this issue are essential. Artifacts such as dust and reflections can cause inaccurate counts requiring some images to be cropped and edited before counting. Software counting is most useful with images of a moderate to high cell count and complexity. Using CellProfiler with biopsies is not limited to IHC stained slides. Cells on bright field images can be quantified by selecting a color channel and inverting the image. We have begun to use this approach on neuronal tissue where the neurons vary in size and signal intensity with some success (data not shown).
5. Conclusion
In summary, counting fluorescently labeled biopsies with CellProfiler is a practical and effective replacement and/or additional technique to manual counting.
Highlights.
An automated method for manual cell counting of T-cell populations in human tissue samples was developed
CellProfiler was compared to manual counting
Manual counting and CellProfiler demonstrated high correlation in cell counting
Could be a cost effective replacement to manual counting of T-cell populations in human tissue samples
Acknowledgments
We are grateful for the participants for providing the biopsies used in the study. We thank Dr. Mindy Miner for her help editing the manuscript. This work was supported by NIH grants R01 AI042528, R01 AI111780 and PO1 AI030731, and the James B. Pendleton Charitable Trust.
Footnotes
Publisher's Disclaimer: This is a PDF file of an unedited manuscript that has been accepted for publication. As a service to our customers we are providing this early version of the manuscript. The manuscript will undergo copyediting, typesetting, and review of the resulting proof before it is published in its final citable form. Please note that during the production process errors may be discovered which could affect the content, and all legal disclaimers that apply to the journal pertain.
The authors declare no competing interests.
References
- 1.Schiffer JT, Swan D, Al Sallaq R, et al. Rapid localized spread and immunologic containment define Herpes simplex virus-2 reactivation in the human genital tract. eLife. 2013;2:e00288. doi: 10.7554/eLife.00288. doi: 10.7554/eLife.00288[published Online First: Epub Date]|. [DOI] [PMC free article] [PubMed] [Google Scholar]
- 2.Schiffer JT, Swan DA, Corey L, Wald A. Rapid viral expansion and short drug half-life explain the incomplete effectiveness of current herpes simplex virus 2-directed antiviral agents. Antimicrobial agents and chemotherapy. 2013;57(12):5820–9. doi: 10.1128/AAC.01114-13. doi: 101128/AAC.01114-13[published Online First: Epub Date]|. [DOI] [PMC free article] [PubMed] [Google Scholar]
- 3.Sasikala-Appukuttan AK, Kim HO, Kinzel NJ, et al. Location and dynamics of the immunodominant CD8 T cell response to SIVDeltanef immunization and SIVmac251 vaginal challenge. PloS one. 2013;8(12):e81623. doi: 10.1371/journal.pone.0081623. doi: 101371/journal.pone.0081623[published Online First: Epub Date]|. [DOI] [PMC free article] [PubMed] [Google Scholar]
- 4.Zeng M, Haase AT, Schacker TW. Lymphoid tissue structure and HIV-1 infection: life or death for T cells. Trends in immunology. 2012;33(6):306–14. doi: 10.1016/j.it.2012.04.002. doi: 101016/j.it.2012.04.002[published Online First: Epub Date]|. [DOI] [PubMed] [Google Scholar]
- 5.Eliceiri KW, Berthold MR, Goldberg IG, et al. Biological imaging software tools. Nature methods. 2012;9(7):697–710. doi: 10.1038/nmeth.2084. doi: 10.1038/nmeth.2084[published Online First: Epub Date]|. [DOI] [PMC free article] [PubMed] [Google Scholar]
- 6.Zhu J, Hladik F, Woodward A, et al. Persistence of HIV-1 receptor-positive cells after HSV-2 reactivation is a potential mechanism for increased HIV-1 acquisition. Nature medicine. 2009;15(8):886–92. doi: 10.1038/nm.2006. doi: 10.1038/nm.2006[published Online First: Epub Date]|. [DOI] [PMC free article] [PubMed] [Google Scholar]
- 7.Carpenter AE, Jones TR, Lamprecht MR, et al. CellProfiler: image analysis software for identifying and quantifying cell phenotypes. Genome biology. 2006;7(10):R100. doi: 10.1186/gb-2006-7-10-r100. doi: 101186/gb-2006-7-10-r100[published Online First: Epub Date]|. [DOI] [PMC free article] [PubMed] [Google Scholar]
- 8.Zhu J, Koelle DM, Cao J, et al. Virus-specific CD8+ T cells accumulate near sensory nerve endings in genital skin during subclinical HSV-2 reactivation. The Journal of experimental medicine. 2007;204(3):595–603. doi: 10.1084/jem.20061792. doi: 101084/jem.20061792[published Online First: Epub Date]|. [DOI] [PMC free article] [PubMed] [Google Scholar]
- 9.Abramoff M, Magalhaes P, Ram S. Image Processing with ImageJ. Biophotonics International. 2004;11:36–42. [Google Scholar]


