Abstract
Imaging is often used for the purpose of estimating the value of some parameter of interest. For example, a cardiologist may measure the ejection fraction (EF) of the heart to quantify how much blood is being pumped out of the heart on each stroke. In clinical practice, however, it is difficult to evaluate an estimation method because the gold standard is not known, e.g., a cardiologist does not know the true EF of a patient. An estimation method is typically evaluated by plotting its results against the results of another (more accepted) estimation method. This approach results in the use of one set of estimates as the pseudo-gold standard. We have developed a maximum-likelihood approach for comparing different estimation methods to the gold standard without the use of the gold standard. In previous works we have displayed the results of numerous simulation studies indicating the method can precisely and accurately estimate the parameters of a regression line without a gold standard, i.e., without the x-axis. In an attempt to further validate our method we have designed an experiment performing volume estimation using a physical phantom and two imaging systems (SPECT,CT).
Keywords: Regression analysis, image quality, parameter estimation
1. INTRODUCTION
We have previously developed a method for comparing estimation tasks without a gold standard [1, 2]. Our method came in response to a need in the medical imaging community for objective comparison of estimation methods performed using different imaging systems. For example, researchers might want to know which imaging modality (ultrasound, MRI, or SPECT) should be used to best estimate an individual’s cardiac ejection fraction. Our method is analogous to the techniques initially developed by Henkelman, et al. [3], for assessing observer performance on classification tasks without the use of ground truth.
Comparing classification tasks without truth is well studied [3–6], whereas the problem of evaluating estimation tasks without a gold standard has received substantially less attention. Many researchers have attempted to compare estimation tasks by measuring the relationship (via regression analysis) between their estimates and the estimates of a more accepted imaging modality [7–13]. However, since the more accepted modality is rarely considered the gold standard, this type of analysis is faulty. Techniques have been developed [14, 15] that attempt to quantify the agreement between the estimates of two imaging modalities. These techniques, however, do not address the relationship between the estimates and the truth.
We have performed extensive studies using simulated data to better understand the performance of our method. These studies have largely been successful, yet received the usual, and justified, skepticism associated with simulation studies. Thus, to address this skepticism we have performed a phantom study involving volume estimation using both computed tomography (CT) and single photon emission computed tomography (SPECT).
2. METHOD
We present a brief synopsis of our method Regression Without Truth (RWT) developed previously in Hoppin et al. [1] and Kupinski et al. [2]. We begin with an equation relating the gold standard Θp for patient p to the estimate θpm for patient p using modality m given by,
| (1) |
where am and bm are the linear model parameters and εpm is the noise term. The linear model parameters characterize the mapping of the gold standard to its estimate. These linear model parameters are specific to the modality m and independent of the patient p.
We assume the noise term εpm is Gaussian distributed with mean zero and standard deviation σm (another linear model parameter). This assumption yields a Gaussian probability density function (PDF) for the estimates conditional upon the linear model parameters and the gold standard, i. e. pr({θpm}|{am}, {bm}, {σm}, Θp). We must now consider a parameterized PDF pr(Θp|{ζi}) associated with the unknown gold standard, e.g., the population distribution of cardiac ejection fraction, bone density, etc. Using this PDF we marginalize over the unknown gold standard via
| (2) |
Note that we have added the list of parameters characterizing the gold standard distribution {ζi} to the list of conditional parameters.
In Hoppin et al. [1] we derive an expression for the log-likelihood of the unknown parameters ({am}, {bm}, {σm}, {ζi}) given the estimates from multiple modalities on a common group of patients. This expression is given by
| (3) |
where η = [{am}, {bm}, {σm}, {ζi}]. We maximize Eq. 3 to produce maximum-likelihood estimates of the linear model parameters as well as the parameters characterizing the gold standard distribution. One can then use the linear model parameters to compare the estimation techniques. Specifically, by solving for the gold standard Θp in Eq. 1 we arrive at a random variable with standard deviation σm/am which we can estimate by σ̂m/âm. This quantity serves as a figure of merit in determining which modality returns better estimates of the parameter of interest.
3. DESIGN OF EXPERIMENT
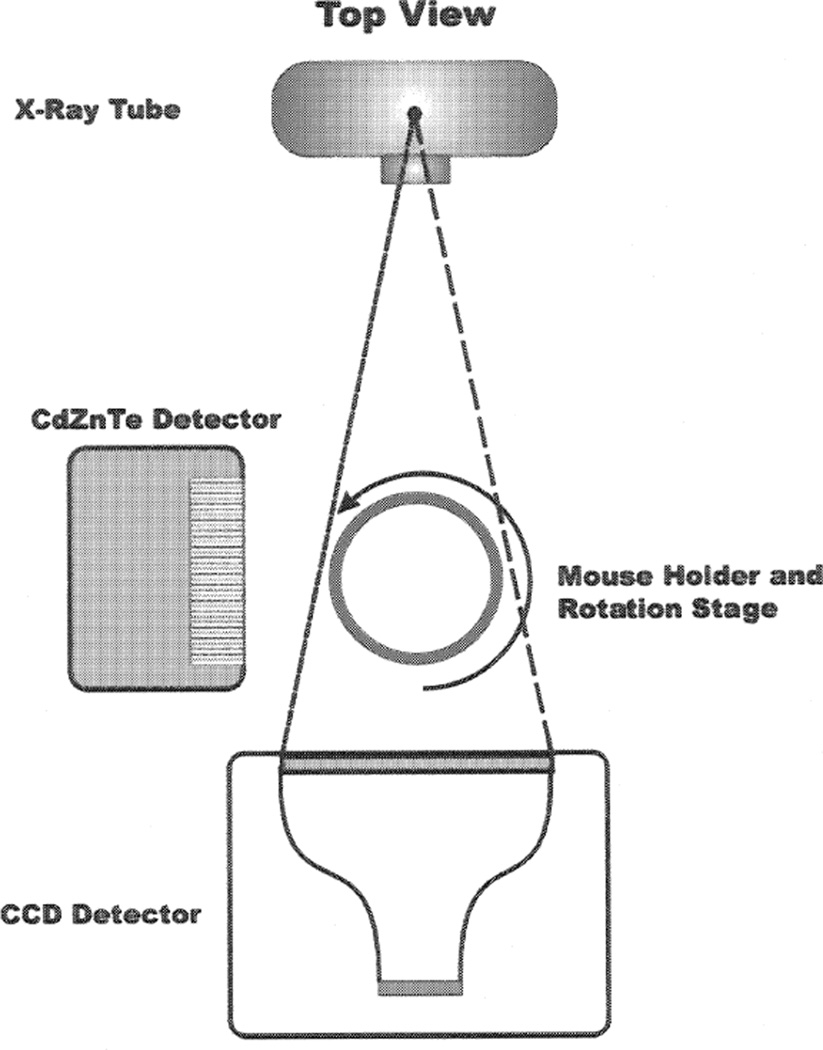
Our experiment to validate RWT consists of estimating multiple volumes in a phantom using a dual-modality (CT/SPECT) imaging system developed by our group [16]. The CT component of the dual-modality system is comprised of an Oxford Instruments (XTF5000/75) x-ray tube and a Kodak KAF-1001E series 1024 × 1024 pixel CCD array with an active area of 5.0 × 5.0cm2. The SPECT component of the dual-modality system consists of the compact Cadmium Zinc Teluride (CdZnTe) semiconductor camera with field of view 2.5 × 2.5cm2 developed previously in our group [17]. Note that the tomographic data in both systems are generated by rotating the object rather than the camera. A schematic diagram is given in Fig. 1.
Figure 1.
Schematic diagram for the dual-modality imaging system.
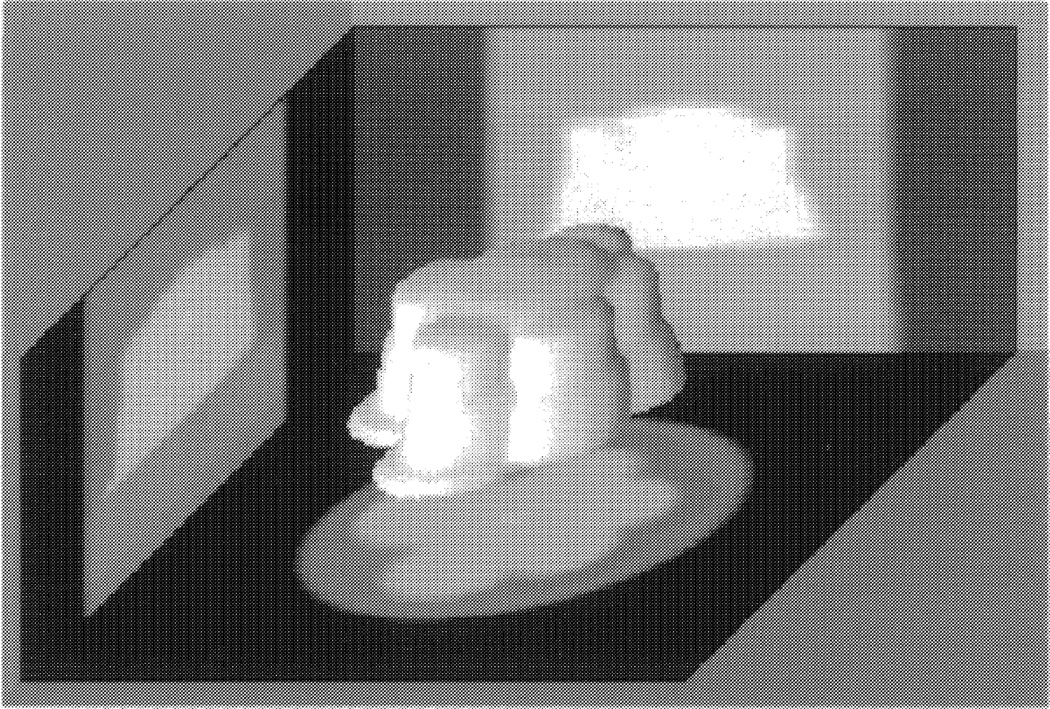
We fabricated the phantom by drilling out an asymmetric pattern in a 2.5cm diameter plexiglass cylinder. A 3D reconstruction of the phantom is given in Fig. 2 (note that the reconstruction is inverted in an attempt to better display the complex nature of the phantom). The phantom has a volume of approximately 4ml. We used a solution consisting of 25% 99mTc-pertechnitate (typically 8mCi/ml), 5% omnipaque (an x-ray contrast agent), and 70% water. We imaged 25 volumes with values we sampled from a truncated normal distribution with lower and upper bounds of 0.5 and 3.5ml, respectively. The phantom was filled to the predetermined volumes using a pipette accurate to ± 2µl. Given the accuracy of the pipette, it is a gold standard of volume for this experiment.
Figure 2.
A 3D Reconstruction of the phantom imaged with 3.06ml of solution. Note that the reconstruction is inverted in an attempt to better display the complex nature of the phantom.
Image data were acquired at 180 projection angles with 1 second exposures on the CT system. The SPECT data were taken at 60 projection angles each with 35 seconds of exposure. The data collected using the CT system were reconstructed on a 64 × 64 × 32 voxelized grid, while data collected using the SPECT system were reconstructed on a 64 × 64 × 64 voxelized grid. All data were reconstructed using filtered back projection.
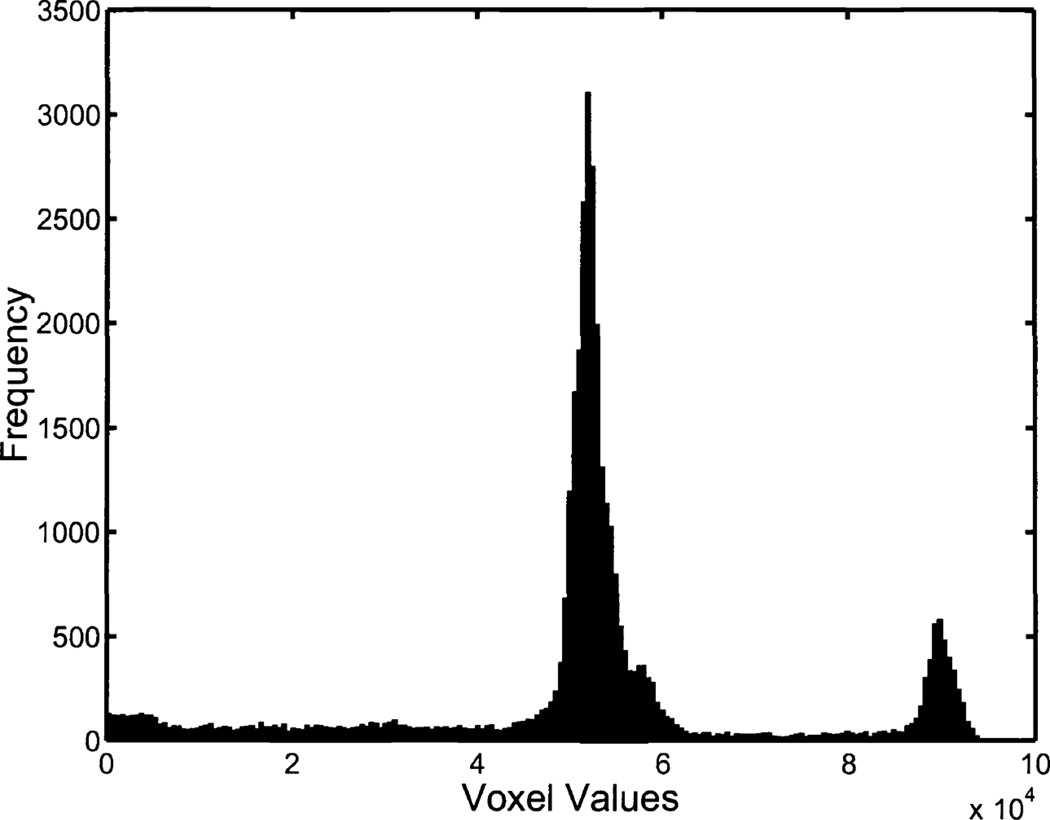
We thresholded voxel values in order to segment out the solution in the image reconstructions. For the SPECT reconstructions we chose our threshold values manually using a gray-level histogram for each image. We generated two sets of volume estimates using the CT data. The first estimation approach, CTI, consisted of manual thresholding and included magnification correction. The second estimation approach, CTII, used a fixed threshold and did not account for magnification. Thus the relationship between the estimates obtained using CTII and the gold standard is quantified with a slope greater than one. In Fig. 3 we display a histogram of voxel values from a CT reconstruction.
Figure 3.
A histogram of positive voxel values from a CT reconstruction of the phantom imaged with 3.06ml of solution. The two peaks consist of voxel values corresponding to plexiglass (~50,000) and solution (~90,000). A majority of the voxel values corresponding to air are negative, and thus not shown. Note that the voxel values are not given in Hounsfield units.
4. RESULTS
We applied RWT to the three sets of volume estimates obtained in the experiment resulting in estimated slopes, intercepts, and noise terms relating the volume estimates to the gold standard. This analysis did not use the known gold standard (i. e., pipette values) to determine this relationship. We also performed conventional regression analysis using the gold standard (i.e., pipette values) for comparison. In Table 1 we summarize these results. Note that there are differences between the slopes, intercepts, and noise terms obtained from these two methods. However, the ordering of the slopes and noise terms is the same between the two methods. Regression analysis performs better than RWT because it has access to the x-coordinates (i.e., the gold standard).
Table 1.
Estimates of the linear model parameters using regression analysis with and without truth. Note that the CTI estimates were obtained using manual thresholding and magnification correction while the CTII estimates were obtained using a fixed threshold and no magnification correction.
| Estimation Techniques | SPECT | CTI | CTII |
|---|---|---|---|
| âSI | âCTI | âCTII | |
| Estimates from regression analysis | 0.9387 | 1.0462 | 1.6135 |
| Estimates using no-gold-standard analysis | 0.8091 | 0.9032 | 1.3947 |
| b̂SI | b̂CTI | b̂CTII | |
| Estimates from regression analysis | 0.0110 | −0.0684 | −0.0210 |
| Estimates using no-gold-standard analysis | 0.0253 | 0.0026 | 0.3572 |
| σ̂SI | σ̂CTI | σ̂CTII | |
| Estimates from regression analysis | 0.0351 | 0.0428 | 0.0646 |
| Estimates using no-gold-standard analysis | 0.0478 | 0.0512 | 0.1003 |
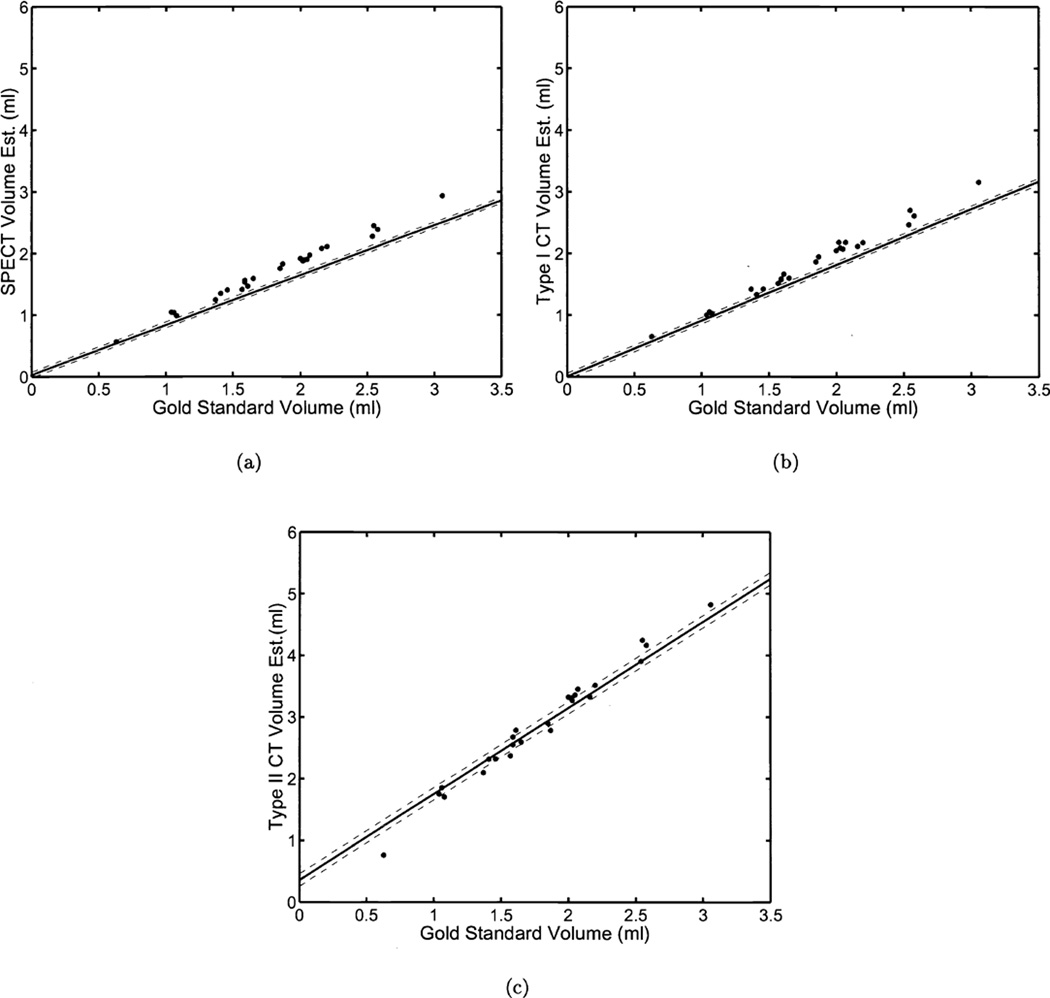
In Fig. 4 we plot the volume estimates obtained using the three aforementioned techniques versus the gold standard. Also shown in Fig. 4 are the lines representing the results of RWT. The results shown in Fig. 4 are somewhat misleading given that we use the gold standard in the plots; an advantage RWT does not have. This explains the noticeable imperfections in the plots.
Figure 4.
The results of a phantom study for estimating volumes from three estimation techniques. Twenty-five different volumes were imaged on two different modalities (SPECT, CT). In each graph we have plotted the true volume against the estimates from three different estimation techniques ((a)SPECT, (b)CTI, (c)CTII). The solid line was generated using the estimated linear model parameters for each estimation technique. The dashed lines denote the estimated standard deviations for each estimation technique. Values for these parameters are shown in Table 1. Note that although we have plotted the true volumes on the x-axis of each graph, this information was not used in computing the linear model parameters
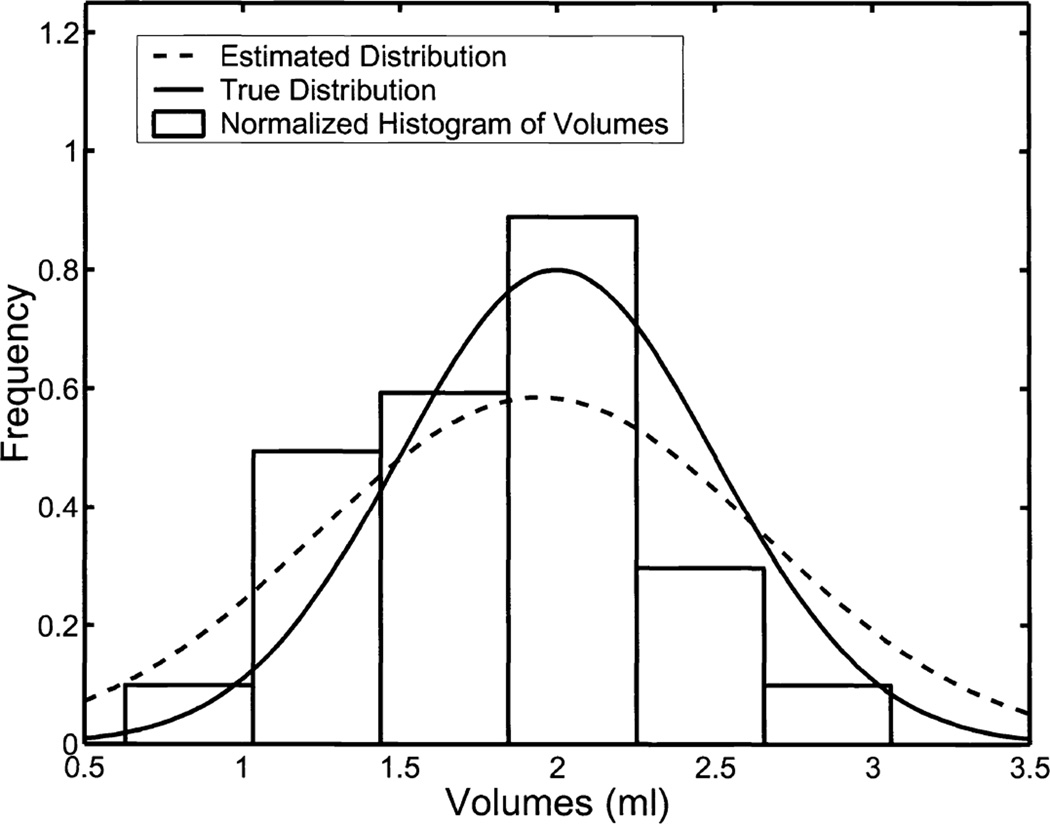
RWT also returns estimates of the parameters defining the underlying distribution of the gold standard. Because we generated the gold standard from a known distribution, we can, again, evaluate the performance of RWT. Figure 5 contains plots of the true and estimated densities along with a histogram of the data used in the experiment.
Figure 5.
A comparison of the normalized histograms for the underlying volumes with the parameters returned by RWT estimating the mean and variance of the underlying gold-standard distribution. The true volumes were sampled from a truncated-normal distribution with a mean of 2ml and standard deviation of 0.5ml. The 25 volumes themselves had a sample mean of 1.8016ml and sample standard deviation 0.5607ml. Our no-gold-standard analysis predicted a mean of 1.9444ml and a standard deviation of 0.7057ml.
5. DISCUSSION AND CONCLUSION
We have further evaluated our method (RWT) for comparing estimation methods without the use of a gold standard by performing volume estimation using a phantom and multiple imaging systems. We have found that our method does, in fact, allow for the comparison of estimation techniques without the use of a gold standard. Specifically, the estimates of the linear model parameters obtained using RWT are closely correlated with those obtained through standard regression analysis using the x-axis. The errors observed in our estimates of the linear model parameters are consistent with the results of simulation studies presented in earlier works [1, 2].
The estimation tasks (SPECT, CTI, and CTII) we employed for volume estimation were not particularly noisy, as can be seen in Fig. 4. However, the slope of CTII is substantially greater than one due to magnification in our CT system. RWT accurately determined this increased slope (Fig. 4 (c)).
The results of previous simulation studies using RWT indicated significant improvement with increased sample size. In future work, we intend to increase the sample size of our validation experiment as well as adding a noisy estimation technique. The lack of noise present in the three volume estimation techniques used in our experiment led to differences between the estimates of σ̂m/âm for each technique that were not statistically significant. This result implies that the three volume estimation techniques we used performed equally well. We also intend to compare the estimation capabilities of different reconstruction and segmentation algorithms.
ACKNOWLEDGMENTS
This work was supported by NSF grant 9977116 and NIH grants P41 RR14304, KO1 CA87017-01, and RO1 CA 52643. This research of Todd E. Peterson, Ph.D. is supported in part by a Career Award at the Scientific Interface from the Burroughs Wellcome Fund.
REFERENCES
- 1.Hoppin JW, Kupinski MA, Kastis GA, Clarkson E, Barrett HH. Objective comparison of quantitative imaging modalities without the use of a gold standard. IEEE Transactions on Medical Imaging. 2002;21:441–449. doi: 10.1109/TMI.2002.1009380. [DOI] [PMC free article] [PubMed] [Google Scholar]
- 2.Kupinski MA, Hoppin JW, Clarkson E, Barrett HH, Kastis GA. Estimation in medical imaging without a gold standard. Academic Radiology. 2002 Mar;9:290–297. doi: 10.1016/s1076-6332(03)80372-0. [DOI] [PMC free article] [PubMed] [Google Scholar]
- 3.Henkelman RM, Kay I, Bronskill MJ. Receiver operator characteristic (ROC) analysis without truth. Medical Decision Making. 1990;10:24–29. doi: 10.1177/0272989X9001000105. [DOI] [PubMed] [Google Scholar]
- 4.Beiden SV, Campbell G, Meier KL, Wagner RF. Medical Imaging 2000: Image Perception and Performance. Vol. 3981. SPIE; 2000. On the problem of ROC analysis without truth: The em algorithm and the information matrix; pp. 126–134. [Google Scholar]
- 5.Qu Y, Tan M, Kutner MH. Random effects models in latent class analysis for evaluating accuracy of diagnostic tests. Biometrics. 1996 Sep;52:797–810. [PubMed] [Google Scholar]
- 6.Albert PS, McShane LM, Shih JH. Latent class modeling approaches for assessing diagnostic error without a gold standard: With applications to p53 immunohistochemical assays in bladder tumors. Biometrics. 2001 Jun;57:610–619. doi: 10.1111/j.0006-341x.2001.00610.x. [DOI] [PubMed] [Google Scholar]
- 7.Al-Hallaq H, River JN, Zamora M, Oikawa H, Karczmar GS. Correlation of magnetic resonance and oxygen microelectrode measurements of carbogen-induced changes in tumor oxygenation. International Journal of Radiotion Oncology, Biology, and Physics. 1998;41(1):151–159. doi: 10.1016/s0360-3016(98)00038-8. [DOI] [PubMed] [Google Scholar]
- 8.Alderson PO, Adams DF, McNeil BJ, Sanders R, Siegelman SS, Finberg HJ, Hessel SJ, Adams HL. Computed tomography, ultrasound, and scintigraphy of the liver in patients with colon or breast carcinoma: A prospective comparison. Radiology. 1983;149:225–230. doi: 10.1148/radiology.149.1.6611929. [DOI] [PubMed] [Google Scholar]
- 9.Abe M, Kazatani Y, Fukuda H, Tatsuno H, Habara H, Shinbata H. Left ventricular volumes, ejection fraction, and regional wall motion calculated with gated technetium-99m tetrofosmin spect in reperfused acute myocardial infarction at super-acute phase: Comparison with left ventriculography. Journal of Nuclear Cardiology. 2000 Nov-Dec;7:569–574. doi: 10.1067/mnc.2000.108607. [DOI] [PubMed] [Google Scholar]
- 10.Bellenger NG, Burgess MI, Ray SG, Lahiri A, Coats AJS, Cleland JGF, Pennell DJ. Comparison of left ventricular ejection fraction and volumes in heart failure by echocardiography, radionuclide ventriculography and cardiovascular magnetic resonance. European Heart Journal. 2000 Aug;21:1387–1396. doi: 10.1053/euhj.2000.2011. [DOI] [PubMed] [Google Scholar]
- 11.Cwajg E, Cwajg J, He Z-X, Hwang WS, Keng F, Nagueh SF, Verani MS. Gated myocardial perfussion tomography for the assessment of left ventricular function and volumes: Comparison with echocardiography. Journal of Nuclear Medicine. 1999;40(11):1857–1865. [PubMed] [Google Scholar]
- 12.Faber TL, Vansant J, Pettigrew RI, Galt JR, Blais M, Chatzimavroudis G, Cooke CD, Folks RD, Waidrop SM, Guartler-Krawczynska E, Wittry MD, Garcia EV. Evaluation of left ventricular endocardial volumes and ejection fractions computed from gated perfusion spect with magnetic resonance imaging: Comparison of two methods. Journal of Nuclear Cardiology. 2001 Nov-Dec;8:645–651. doi: 10.1067/mnc.2001.117173. [DOI] [PubMed] [Google Scholar]
- 13.He Z, Cwajg E, Presian JS, Mahmarian JJ, Verani MS. Accuracy of left ventricular ejection fraction determined by gated myocardial perfusion spect with tl-201 and tc-99m sestamibi: Comparison with first-pass radionuclide angiography. Journal of Nuclear Cardiology. 1999 Jul-Aug;6:412–417. doi: 10.1016/s1071-3581(99)90007-7. [DOI] [PubMed] [Google Scholar]
- 14.Altman DG, Bland JM. Measurement in medicine: the analysis of method comparison studies. The Statistician. 1983;32:307–313. [Google Scholar]
- 15.Bland JM, Altman DG. Statistical methods for assessing agreement between two methods of clinical measurement. Lancet. 1986;i:307–310. [PubMed] [Google Scholar]
- 16.Kastis GA, Furenlid LR, Wilson DW, Peterson TE, Barber HB, Barrett HH. Nuclear Science Symposium and Medical Imaging Conference. IEEE; 2002. Nov, Compact CT/SPECT small-animal imaging system. [Google Scholar]
- 17.Kastis GA, Barber HB, Barrett HH, Balzer SJ, Lu D, Marks DG, Stevenson G, Woolfenden JM, Appleby M, Theller J. Gamma-ray imaging using a cdznte pixel array and a high-resolution, parallel-hole collimator. IEEE Transactions on Nuclear Science. 2000 Dec;47:1923–1927. [Google Scholar]


