

Abstract
Normative values of pediatric skull circumference, cranial index, and braincase volume would inform multiple disciplines including neurosurgery, plastic surgery and anthropology. Semi-automated methods exist for obtaining these data but are time consuming and require expertise. We report on a new method for automated extraction of in vivo measures of pediatric crania based on x-ray computed tomography scans (CT). Data were obtained from a clinical image repository for pediatric populations in whom no pathology was noted. The automated process showed good agreement with semi-automated measures, although there was a small bias for both braincase volume and circumference. We developed an open source program to automatically extract measures of skull circumference, cranial index, and braincase volume that are likely to prove useful in multiple disciplines.
I. INTRODUCTION
Plastic surgeons rely on measurements of head shape to discern normal variation from craniofacial deformity, to determine if and when intervention should occur, and to assess treatment outcomes [1,2]. Neurologists are interested in pediatric head morphology to improve the models used to assess sources of epileptic seizure prior to corrective surgery and anthropologists use cranial measures to assess human and primate evolution [3,4]. Cranial Index, synonymous with Cephalic Index, is often used as a measure of shape while circumference and braincase volume provide a measure of size [5,6]. Cranial Index and skull circumference can be measured and braincase volume can be estimated from external measures in living subjects. However, these parameters can be more precisely measured using quantitative imaging.
Magnetic Resonance Imaging is the most common means to acquire head morphology but does not provide good definition of bone without the use of specialized pulse sequences. CT provides high fidelity representations of craniofacial bone and is the preferred modality for imaging bone; however, CT scans of otherwise healthy children are not justifiable due to ionizing radiation concerns. Clinically, head CT scans are acquired to rule out potentially significant medical conditions. These data reside in clinical picture archiving and communication systems (PACS) and in some cases can be used to create normative measures of pediatric skulls [7].
Measuring braincase volume from CT data involves making a “virtual endocast” and has been well accepted [3]. These methods, however, are semi-automated methods that are time consuming and involve human interpretation by a skilled observer to guide the definition of the boundary at the sinuses and orbits, and in young children for open sutures and fontanelles. Selection of proper thresholds for defining bone also has an effect on extracted measures [8]. We have developed an automated method, brain_calc, to measure braincase volume, cranial index, and skull circumference from pediatric head CT data sets and compare the automated measures to measures taken with semi-automated routines. This function is part of a larger open source software package known as normalcy. We are aware of only one other automated procedure to obtain braincase volume from pediatric CT data [9]. Our methods will be used to contribute difficult to obtain measures of normal pediatric skull morphology and add them to the paucity of existing data. In this paper we discuss our methods, results, and limitations of the approach.
II. METHODS
Following an Internal Review Board (IRB) approved protocol; CT and MR data were mined from the clinical repository at Children’s Hospital, in St. Louis. Data were reviewed for coverage, resolution, motion artifact, technique, and pathology. The radiology reports were reviewed for indications of pathology.
The data being analyzed in this study is a subset of a larger ongoing study. Acceptance criteria for this portion of the study required the subject to be between 0 and 18 years of age at the time of scanning and the scan was required to contain the top surface of the head, the nasion (NAS), pre-auricular right (PAR), and pre-auricular left (PAL) anatomical landmarks. The data could not have motion artifact and were required to have spatial resolution higher than 1.6mm. Exclusion criteria also included skeletal deformity, pathology, and prior head surgery.
Selected cases were de-identified using our in-house Clinical Studies Workstation (CSW) [10] and transferred to a secure data repository. Semi-automated measurements were made using the Analyze software system [11] and automated measurements were made using a custom routine developed in the MATLAB language and environment (MathWorks, Natick, MA, USA) software.
A. Image Processing
All data were converted from DICOM format to Analyze 7.5 format and were resampled to 0.5 mm cubic voxels using linear interpolation. Where a gantry tilt was used to acquire the CT data, a shear correction factor was applied. A local coordinate system was defined based on the NAS, PAR, and PAL anatomical landmarks. The fiducials were located and their xyz-coordinates were recorded using the Analyze volume render module.
Automated Braincase Segmentation
Refer to figure 1 for the general steps performed during braincase segmentation and measurement.
Figure 1.
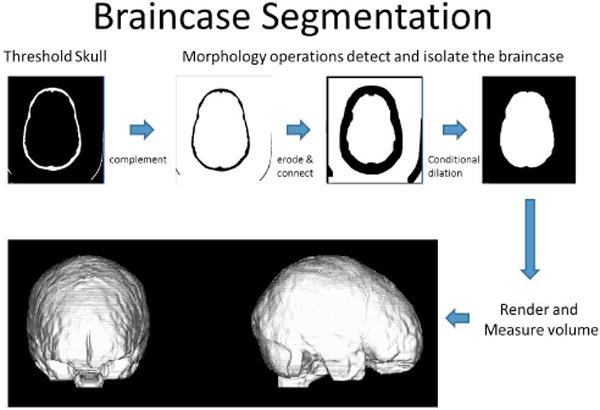
Automated segmentation is performed in MATLAB using thesholding, connected componcnts, and morphology operations.
The first step in the automated braincase segmentation is to define the threshold that represents the boundary between the interior skull shell and the soft tissue within the braincase. CT voxels are represented in Hounsfield units (HU) that are based on the attenuation coefficient of a tissue; therefore, specific thresholds can be established for tissue types. An accepted method for defining tissue boundaries is to set the threshold value to the mean of the peak value of adjacent tissues [8]. We incorporated this methodology into our automatic process by examining intensity values between the brain and skull interface for 22 intensity profiles taken along surface normal from the head. This process has been described elsewhere [12]. The average HU that defined the skull/brain interface at those points was used as the threshold for defining the skull during braincase segmentation.
Each segmented skull (bone) voxel was assigned a value of 1 if greater than or equal to the threshold value, otherwise they were assigned a value of 0. To remove any noise that remained in the braincase region after thresholding, a morphological “open” was performed that removed any groups of binary 1 voxels that contained 100 or less voxels. The binary data were then complemented using the MATLAB function “imcomplement” to set bone equal to 0 and other tissues, including the braincase, to a value of 1. A copy of the complemented volume was stored for use in a later conditional dilation step.
At this point the braincase is connected to the other soft tissue and air through the fontanelles, sutures, orbits, sinuses and through the brain stem. To isolate the braincase from the surrounding tissues the brain_calc routine iteratively performs morphological binary erosion using a 3×3×3 rectilinear structuring element. Through experimentation we found that 10 iterations were sufficient to isolate the braincase region from the surrounding tissues. A connected components operation is then performed and the discrete objects labeled according to size. Finding the centroid of the skull identifies the braincase object and labeling the object that contains the centroid as the braincase object. The braincase object is then conditionally dilated using a 3×3×3 rectilinear structuring element and the previously stored copy of the complemented skull volume as the conditioning volume. Eleven iterations (1 + total number of erosions) were performed with the dilated binary volume being multiplied by the conditioning volume at the end of each iteration. All voxels below the plane defined by the NAS, PAR, PAL landmarks are then set to a binary 0 to remove them from the braincase object. The volume of the braincase is determined by summing the number of voxels contained in the final braincase object and multiplying by the volume of a single voxel.
To determine the width, length, and height of the skull a bounding box is fit to the binary skull object that was created earlier. From the bounding box, the maximum dimension in the x, y, and z-axes are easily calculated and represent the maximum width, length, and height respectively. These measures are similar to those obtained with anthropometric measuring boards. When these measures are taken, the skull is still aligned in the anatomic NAS, PAR, PAL coordinate system.
To calculate the circumference of the skull, the frontal pole and occipital pole are recorded from the bounding box as the x, y, z coordinates of the most anterior point and the most posterior point. The braincase object is combined with the skull object to form a single skull-brain object. A morphological binary “close” operation is performed using a “disk” element of size 10 to close any skull boundaries containing open sutures. A MATLAB hole filling function “bwfill” is then called to ensure the circumference is taken only on the outer surface of the object. A rigid body transformation is executed to rotate the skull about the x-axis to align the frontal pole and occipital pole into a common transverse plane. The circumference of the skull through the frontal pole and occipital pole is then calculated using the “regionprops” function in MATLAB.
At the end of the calc_braincase function the results are returned to the main program normalcy where the length, width, height, circumference, and braincase volume are written to a comma separated value (csv) file for analysis. The segmented braincase object is also written to disk as a binary volume. Optional visual displays may be turned on during processing to visualize the processes and results. The files are processed in batch mode and the files and processing order are determined from a master file. Inputs to the master file include a text file containing the x, y, z coordinates of the NAS, PAR, and PAL anatomical landmarks as well as the path to the Analyze 7.5 image volumes.
Semi-Automated Measurements in Analyze
The skull was represented by thresholding followed by a “connect and keep” operation that removed any soft tissue values that were above the defined HU for the skull. The threshold value was selected as the halfway point between skull and brain HU values as determined from random samples of bone and brain.
Length and width measurements were made from superior volumetric renderings of the isolated skull by taking the maximum distance along the y value for length and the maximum distance along the x-axis for width. These values were obtained using the caliper tools in Analyze. A right lateral view was used to define the height of the skull, which was defined as the maximum distance along the z-axes from vertex to the NAS, PAR, PAL plane. These measures are similar to anatomical measures made with measuring boards. The cranial index is a ratio often used in anthropology and plastic surgery and is defined as the maximum width/maximum length × 100%.
Circumference was measured by aligning a cutting plane through the frontal pole and occipital pole from a right lateral rendering of the skull when aligned in the NAS, PAR, PAL coordinate system, finding the border using region growing, and calculating the perimeter using the Analyze tools.
The semi-automated braincase volume was calculated in Analyze by filling the void within the segmented skull object. This was done using a combination of morphology operators and manual segmentation supervised by an experienced technician (KS).
B. Statistical Methods
Data distributions were calculated, and tested for normality with the Shapiro-Wilk W Test. If data were normally distributed, then a paired t-test was performed. If data were non-normally distributed, then a Wilcoxon signed rank test was performed. For non-normally distributed data, the median is the best indicator of central tendency. Statistical analyses were performed with JMP Statistical Software Release 9.0.0 (SAS Institute, Inc., Cary, NC).
III. RESULTS
The raw braincase volume data are shown in Table 1.
Table 1.
Braincase volumes (cm3) measured with automated and semi-automated methods.
| Semi-automated | Automated (brain_calc) | Differences |
|---|---|---|
| 1428.9 | 1442.3 | −13.4 |
| 946.1 | 950.6 | −4.5 |
| 1391.6 | 1401.8 | −10.2 |
| 1826 | 1846.8 | −20.8 |
| 1433 | 1445.2 | −12.2 |
| 1468.9 | 1478.7 | −9.8 |
| 1393 | 1564.3 | −171.3 |
| 1500 | 1513.2 | −13.2 |
| 1693.3 | 1705.3 | −12 |
| 1530 | 1550.1 | −20.1 |
| 877.4 | 872.7 | 4.7 |
| 991.8 | 991.2 | 0.6 |
| 928 | 930 | −2 |
| 839.5 | 3670.8 | −2831.3 |
| 1284 | 1292 | −8 |
| 1513.3 | 1524.1 | −10.8 |
| 1133.5 | 1127.8 | 5.7 |
| 1430.3 | 1436.6 | −6.3 |
| 1369.8 | 1374.4 | −4.6 |
| 1208.6 | 1215.4 | −6.8 |
| 1395.6 | 1409.2 | −13.6 |
Figures 2–4 illustrate the results using Bland-Altman plots that show the mean difference and the 95% limits of agreement between the automated brain_calc function and semi-automated measurements made by an experienced technician (KS) using the Analyze software system.
Figure 2.
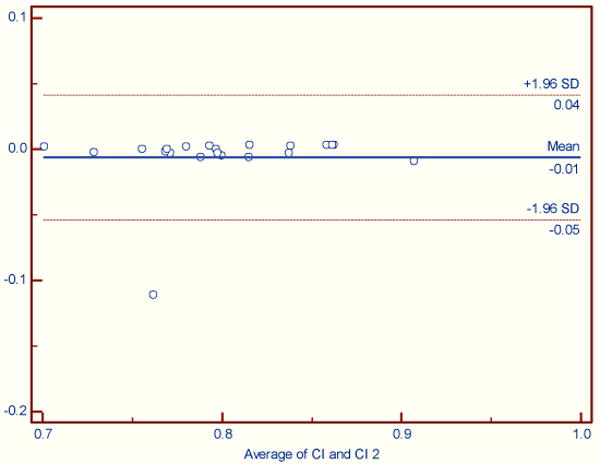
Cranial Index. No significant difference between automated and semi-automated analyses (Wilcoxon signed rank test (data non-normally distributed), p = 0.1929).
Figure 4.
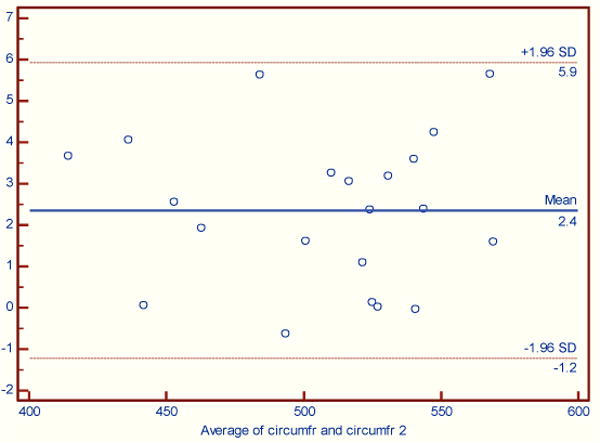
Skull circumference. The maximum difference between automated and semi-automated processing was 5.6 mm. (Paired t-test (normally distributed), p = 0.0001). There was a bias of 2.4 mm with automated measures being smaller.
For cranial index (figure 2) there was one outlier, PV1022 due to a difference in length measurement of 24 mm. Further investigation revealed a likely transcription error as a repeated manual length measurement was within 1mm of the automated measurement.
A significant difference was found for braincase segmentation showing a bias between the measures. Case PV3015, outlier in figure 3, failed automated braincase segmentation as it failed to fully isolate the braincase from the surrounding tissues and air. PV3011 was 170 cm3 larger for the automated measure as compared to semi-automated measures. After removing PV3015 there is a small bias of −10 cm3 between automated and semi-automated measures.
Figure 3.
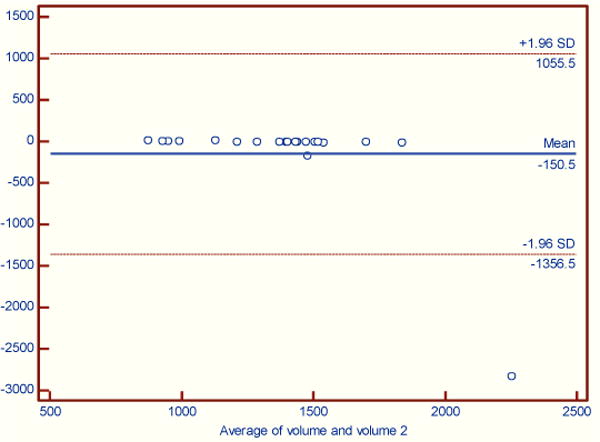
Braincase volume. A significant difference between automated and semi-automated analyses was found (Wilcoxon signed rank test (data non-normally distributed), p = 0.0001).
IV. CONCLUSION
Automated measurement of braincase volume, cranial index, and skull circumference from clinical pediatric CT scans is comparable to semi-automated measures. Small biases were found for braincase segmentation and circumference. There are cases where automated measures can fail so it is good practice to review visual outputs to ensure successful processing. Automated measures do not require a trained operator and can run in batch mode saving valuable man-hours. Comparison to previously calculated braincase volumes as reported in reference 4 is planned. The brain_calc function has been incorporated into our open source normalcy program.
Footnotes
This work was supported in part by NIH grant R43 NS67726.
Contributor Information
Kirk Smith, Email: smithki@mir.wustl.edu, Washington University School of Medicine, St. Louis, MO 63110 USA.
David Politte, Email: politted@mir.wustl.edu, Washington University School of Medicine, St. Louis, MO 63110 USA.
Gregory Reiker, Email: reikerg@mir.wustl.edu, Washington University School of Medicine, St. Louis, MO 63110 USA.
Tracy S. Nolan, Email: tracyn@npg.wustl.edu, Washington University School of Medicine, St. Louis, MO 63110 USA.
Charles Hildebolt, Email: hildeboltc@mir.wustl.edu, Charles Hildebolt is with the Washington University School of Medicine, St. Louis, MO 63110 USA.
Chelsea Mattson, Email: mattson.chelsea@gmail.com, Neuroinformatics Center, University of Oregon, Eugene, OR 97403, USA.
Don Tucker, Email: dtucker@egi.com, Neuroinformatics Center, University of Oregon, Eugene, OR 97403, USA.
Fred Prior, Email: priorf@mir.wustl.edu, Fred Prior is with the Washington University School of Medicine, St. Louis, MO 63110 USA.
Sergei Turovets, Email: sergei@cs.uoregon.edu, Neuroinformatics Center, University of Oregon, Eugene, OR 97403, USA.
Linda J. Larson-Prior, Email: lindap@npg.wustl.edu, Washington University School of Medicine, St. Louis, MO 63110 USA, phone: 314-362-7318; fax: 314-362-6971.
References
- 1.Mehul R, Kamdar R, Gomez A, Ascherman JA. Intracranial Volumes in a Large Series of Healthy Children. Plast Reconstr Surg. 2009;124:2072–2075. doi: 10.1097/PRS.0b013e3181bcefc4. [DOI] [PubMed] [Google Scholar]
- 2.MacLullich MJ, Ferguson KJ, Deary IJ, Seckl JR, Starr JM, Wardlaw JM. Intracranial capacity and brain volumes are associated with cognition in healthy elderly men. Neurology. 2002;59:169–174. doi: 10.1212/wnl.59.2.169. [DOI] [PubMed] [Google Scholar]
- 3.Falk D, Hildebolt C, Smith K, Morwood MJ, Sutikna T, Brown P, Jatmiko, Saptomo EW, Brunsden B, Prior F. The brain of LB1, Homo floresiensis. Science. 2005;308:242–245. doi: 10.1126/science.1109727. [DOI] [PubMed] [Google Scholar]
- 4.Falk D, Hildebolt C, Smith K, Morwood MJ, Sutikna T, Saptomo EW, Prior F. LB1’s virtual endocast, microcephaly, and hominin brain evolution. J Hum Evol. 2009;57:597–607. doi: 10.1016/j.jhevol.2008.10.008. [DOI] [PubMed] [Google Scholar]
- 5.Vorperian HK, Durtschi RB, Wang S, Chung MK, Ziegert AJ, Gentry LR. Estimating head circumference from pediatric imaging studies an improved method. Acad Radiol. 2007;14:1102–1107. doi: 10.1016/j.acra.2007.05.012. [DOI] [PubMed] [Google Scholar]
- 6.Kucuker I, Demir Y, Kaya B, Cukurluoglu O, Tuncer S, Emmez H, Yavuzer R, Baykaner K. Effects of different surgical techniques on cephalic index and intracranial volume in isolated bilateral coronal synostosis model. J Craniofac Surg. 2012;23:878–880. doi: 10.1097/SCS.0b013e31824ddd76. [DOI] [PubMed] [Google Scholar]
- 7.Marcus JR, Domeshek LF, Loyd AM, Schoenleber JM, Das RR, Nightingale RW, Mukundan S., Jr Use of a Three-Dimensional, Normative Database of Pediatric Craniofacial Morphology for Modern Anthropometric Analysis. Plast Reconstr Surg. 2009;124:2076–2084. doi: 10.1097/PRS.0b013e3181bf7e1b. [DOI] [PubMed] [Google Scholar]
- 8.Smith KE, Vannier MW, Commean PK. Spiral CT volumetry of below knee residua. Rehabilitation Engineering, IEEE Transactions on. 1995;3:235–241. [Google Scholar]
- 9.Wikberg E, Bernhardt P, Maltese G, Tarnow P, Lagerlöf JH, Kölby L. A new computer tool for systematic evaluation of intracranial volume and its capacity to evaluate the result of the operation for metopic synostosis. J Plast Surg Hand Surg. 2012;46:393–398. doi: 10.3109/2000656X.2012.718716. [DOI] [PubMed] [Google Scholar]
- 10.Moore SM, Maffitt DR, Blaine GJ, Bae KT. Workstation acquisition node for multicenter imaging studies. Medical Imaging 2001: PACS and Integrated Medical Information Systems: Design and Evaluation; San Diego, CA, USA. 2001. pp. 271–277. [Google Scholar]
- 11.Robb RA, Hanson DP, Karwoski RA, Larson AG, Workman EL, Stacy MC. Analyze: A Comprehensive, operator-interactive software package for multidimensional medical image display and analysis. Computerized Medical Imaging and Graphics. 1989;13:433–454. doi: 10.1016/0895-6111(89)90285-1. [DOI] [PubMed] [Google Scholar]
- 12.Smith KE, Politte D, Reiker G, Nolan T, Hildebolt C, Mattson C, Tucker D, Prior F, Turovets S, Larson-Prior L. Automated Measurement of Pediatric Cranial Bone Thickness and Density from Clinical Computed Tomography. Engineering in Medicine and Biology Society (EMBC), 2012 Annual International Conference of the IEEE. 2012:4462–4465. doi: 10.1109/EMBC.2012.6346957. [DOI] [PMC free article] [PubMed] [Google Scholar]