Abstract
Purpose
To describe a standardized flood-illuminated adaptive optics (AO) imaging protocol suitable for the clinical setting and to assess sampling methods for measuring cone density.
Methods
Cone density was calculated following three measurement protocols: 50 × 50-μm sampling window values every 0.5° along the horizontal and vertical meridians (fixed-interval method), the mean density of expanding 0.5°-wide arcuate areas in the nasal, temporal, superior, and inferior quadrants (arcuate mean method), and the peak cone density of a 50 × 50-μm sampling window within expanding arcuate areas near the meridian (peak density method). Repeated imaging was performed in nine subjects to determine intersession repeatability of cone density.
Results
Cone density montages could be created for 67 of the 74 subjects. Image quality was determined to be adequate for automated cone counting for 35 (52%) of the 67 subjects. We found that cone density varied with different sampling methods and regions tested. In the nasal and temporal quadrants, peak density most closely resembled histological data, whereas the arcuate mean and fixed-interval methods tended to underestimate the density compared with histological data. However, in the inferior and superior quadrants, arcuate mean and fixed-interval methods most closely matched histological data, whereas the peak density method overestimated cone density compared with histological data. Intersession repeatability testing showed that repeatability was greatest when sampling by arcuate mean and lowest when sampling by fixed interval.
Conclusions
We show that different methods of sampling can significantly affect cone density measurements. Therefore, care must be taken when interpreting cone density results, even in a normal population.
Keywords: adaptive optics, cone photoreceptor density, retina
The authors describe a standardized flood-illuminated adaptive optics (AO) imaging protocol suitable for the clinical setting and to assess sampling methods for measuring cone density.
Adaptive optics (AO) has been increasingly used to study retinal disease.1–26 Until recently, the application of AO technology in ophthalmic imaging has been restricted to custom-built systems that require extensive technical infrastructure, which limits their use in a typical clinical setting. Now with commercially available AO imaging systems, such as the flood-illuminated rtx1 from Imagine Eyes (Orsay, France), the Compact AO retinal imager from Physical Sciences, Inc. (Andover, MA, USA), and an AO scanning laser ophthalmoscope from Canon, Inc. (Tokyo, Japan), AO-aided imaging is becoming a more clinically viable tool for assessing retinal disease.27–30 We used the rtx1 flood-illuminated AO camera from Imagine Eyes to develop a protocol for imaging and sampling cone density from a large macular area in healthy subjects. Previous studies have used the rtx1 to examine retinal diseases,12,21,22,31–36 study the healthy eye,37–40 and optimize AO imaging parameters.41,42 However, the practicality and limitations of using the rtx1 and other commercial systems have not been well established. Most studies have sampled density in small, manually selected areas of high image quality, even though a major advantage of flood-illuminated AO imaging is to allow for large areas of the retina to be imaged quickly. The density analysis methods typically used are also prohibitively labor intensive when analyzing large datasets with extensive retinal areas. Therefore, the clinical and research utility of adaptive optics remains limited by a lack of automated cone sampling and density representation methods. Additionally, although some studies have explored the effect of different-sized sampling windows on measurements of cone density,43 it is still unclear how to best represent or sample cone density most accurately and consistently.
We describe our process for image acquisition, processing, and cone density analysis using the rtx1. We evaluated three methods of automatically sampling cone density, assessed the repeatability of our measurements, and compared our cone density values to histological studies,44,45 adding our data to previous studies that have used AO imaging systems to characterize the normal photoreceptor mosaic.37,38,46–52
Methods
This research adhered to the tenets of the Declaration of Helsinki and was approved by the Oregon Health & Science University Institutional Review Board. We tested the dominant eye of 74 healthy subjects ranging in age from 14 to 69 years. Seven subjects were excluded due to an inability to adequately montage the images. Subject characteristics are shown in Table 1.
Table 1.
Subject Characteristics by Age

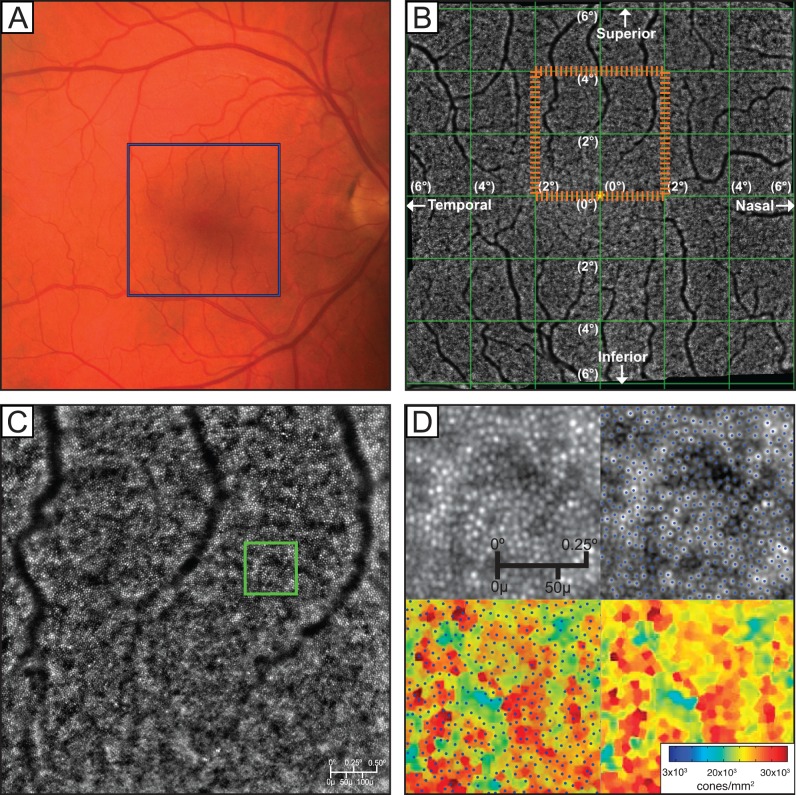
For each subject, a series of 25 4° × 4° images were acquired with a 50% overlap between adjacent images to cover a 12° × 12° field of the central macula (Figs. 1A, 1B). At each fixation point, 40 raw AO images were automatically registered and combined to improve the signal-to-noise ratio using vendor-provided software (ck_v0_1b; Imagine Eyes). An example 4° × 4° image is shown in Figure 1C. Images were montaged with i2k Retina using affine transformation parameters (DualAlign, LLC, Clifton Park, NY, USA).
Figure 1.
(A) Color fundus photo. Blue box indicates the area covered by a complete 25 image AO montage. (B) The 12° × 12° montage created using 25 individual images. (C) Single 4° × 4° image created by the registration of 40 raw images using vendor-provided processing software. The orange dashed box on (B) indicates the position of (C) in the montage. (D) Magnified raw AO image, image with cones labeled by MATLAB cone-counting algorithm, labeled cones overlaid on the Voronoi plot, and the resulting Voronoi plot. The green box on (C) indicates the magnified area shown in (D).
On each resulting image, cone photoreceptors were identified with a custom algorithm developed in MATLAB (MathWorks, Natick, MA, USA). The algorithm first estimated and then removed image backgrounds with an 11 × 11 moving average filter46 and then detected cones by thresholding the intensity values of the local maxima53 (Fig. 1D). The threshold was determined empirically by determining an intensity at which differences between manually and automatically identified cones were minimized. Binary cone detection maps were generated for each image, and cone density maps were created by inverting the Voronoi cell areas corresponding to each detected cone (Figs. 1D–F). Retinal magnification factors for each eye were calculated with the model of the eye developed by Bennett et al.54 from the axial length as measured by an IOLMaster 500 (Carl Zeiss Meditec AG, Jena, Germany).
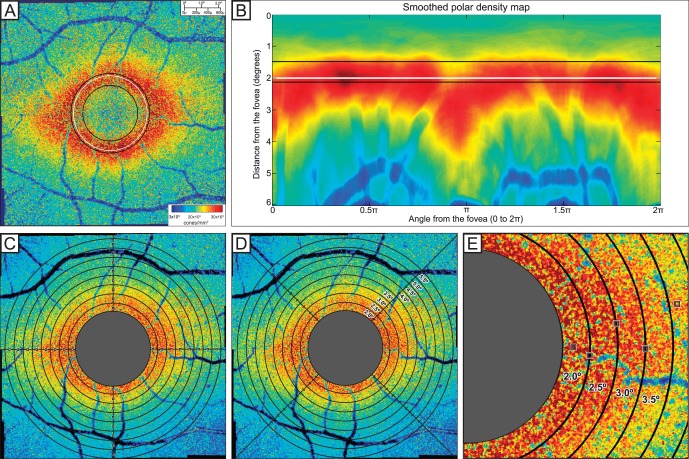
During image registration and montaging, alignment errors can occur and linear blending46 of the overlap regions of binary detection maps can cause the same cone to appear two or more times in the montage, resulting in an overestimation of cone density. To mitigate this problem, we montaged the Voronoi cone density maps rather than the binary cone detection maps, using the linearly blended Voronoi map densities in overlap regions. Thus, small alignment errors caused slight smoothing in the montaged density map, instead of drastic changes in local cone density. Density map montages, as in Figure 2A, were created with the same i2k affine transformations used to make the AO image montage.
Figure 2.
(A) Foveal exclusion zone of Voronoi montage, illustrating the FEZ with the white line. The inner black line indicates the radius of peak density gradient, and the outer black line represents the radius of peak cone density. The radius of the FEZ is shown with the white line, determined from one-fifth of the distance between the black lines representing peak cone density and peak gradient of cone density. (B) Representation of FEZ from the Voronoi montage graphed in polar coordinates. (C) Fixed-interval sampling with 50 × 50-μm windows every 0.5° along the vertical and horizontal meridians. (D) Arcuate mean sampling with arcuate quadrants at 0.5° eccentric from the foveal center. (E) Automated peak cone density sampling with 50 × 50-μm windows of highest peak density in each arcuate area.
Determination of Adequate Image Quality for Valid Automated Cone Identification
For each subject, two 50 × 50-μm samples were selected from 4° × 4° AO images acquired from fixation points 2° and 4° temporal to the preferred retinal locus. These samples were manually selected to avoid areas of retinal vessels or changes in background intensity due to choroidal vasculature. To quickly screen for adequate quality for cone counting, only two samples in two locations were selected. Cones were automatically identified in each sample using our cone detection software and three observers independently added and removed cones from the automated cone detection map. When there was disagreement among the observers such that coefficient of variation (CoV) in number of cones identified was greater than 15%, cone identification of the sample images was discussed as a group until there was agreement. When the average number of cones identified by observers differed from number of cones identified by the automated cone detection software by more than 15%, the sample was determined to be of inadequate image quality for accurate automatic cone identification and all of the subject's images and cone density measurements were excluded from our study averages. Although some of these images could likely be manually counted and further processed, our primary goal was to determine feasibility of an automated process. Two additional subjects were excluded from cone density averages due to loss of follow-up before obtaining axial length measurements.
Regional Analysis
The preferred retinal locus was marked at the center of fixation when the fixation target was located at [0°, 0°]. Cones at the fovea could not be resolved due to the resolution limits of the system. A foveal exclusion zone (FEZ) was estimated for each subject by defining a circle within which many cones could not be accurately identified, centered at the foveal center. This circle was defined by a radius one-fifth the distance between the radius at which the gradient of density was greatest (inside dotted line) and the radius of peak density (middle dotted line) as shown in Figures 2A and 2B. Although some cones can be resolved within the FEZ, the gradient of cone density suggests that automatic detection could not consistently identify cones accurately.
Cone density was sampled in three different methods. The first method of fixed-interval sampling along the meridians placed automated 50 × 50-μm sampling windows every 0.5° on the horizontal and vertical meridians of the Voronoi density montage (Fig. 2C). The second method (arcuate mean density) measured the mean density within expanding concentric arcs of 0.5° thickness in the superior, inferior, temporal, and nasal quadrants of a 90° arcuate area (Fig. 2D). With the arcuate mean density, Voronoi cells representing cone density lower than 500 cones/mm2 were excluded from averages to avoid sampling in vessels and in other areas in which cones were not detected. The third method measured the peak cone density in each arcuate area. This was determined by finding the maximum cone density with a 50 × 50-μm sampling window across 0.5° thickness arcuate area for each 4° × 4° image along the horizontal and vertical meridian (Fig. 2E). Maximum displacement of these sampling windows was 2° from the meridian and 0.25° from the eccentricity. In the overlapping regions of 4° × 4° images, the higher peak density for the same arcuate area was recorded to represent maximum density measured in that region.
Intersession Repeatability
Nine subjects between ages 19 and 59 were imaged on three separate occasions within 3 months. Cone density of the previously described sampled regions (Figs. 2A–C) was compared over the three imaging sessions by observing the CoV for each subject. Additionally, intersession repeatability of the three sampling methods was assessed by calculating the repeatability coefficient with a method previously used by Garrioch et al.52 This coefficient is defined such that approximately 95% of subjects will have differences between two independently obtained measurements no larger in magnitude than the repeatability coefficient.55
Results
Image Quality and Automated Cone Identification
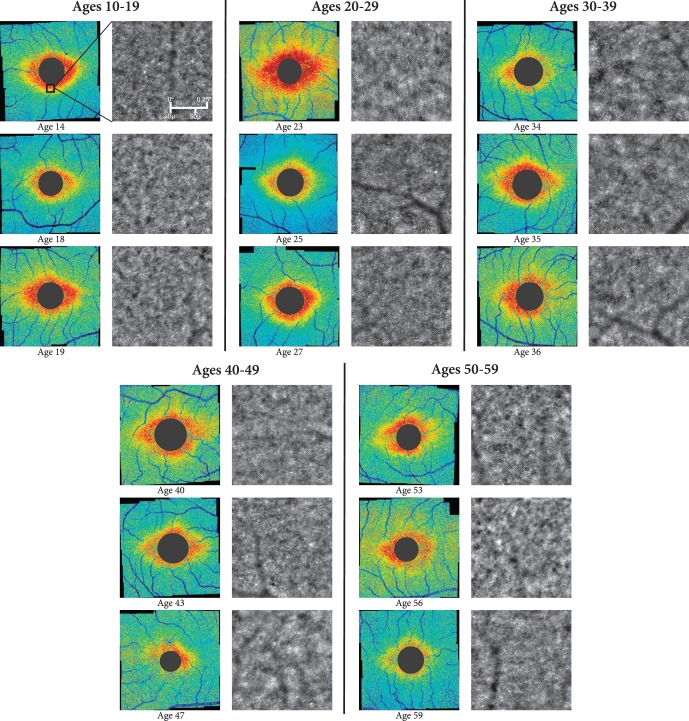
Of the 74 subjects imaged, 67 produced images that were automatically montaged without difficulty using i2K Retina. Figure 3 demonstrates examples of resulting cone density maps of the macula, organized by age. Images from the excluded seven subjects resulted in inadequate macular coverage due to poor fixation or low image quality, causing difficulty registering adjacent images to construct a montage. These subjects tended to be older, averaging 50.9 years. However, two of these subjects were young (<30 years) without any apparent ophthalmological issues. No attempts were made to manually create montages.
Figure 3.
Representative Voronoi density maps from six different age groups showing general trends of decreasing cone density with age. All magnified raw AO images show areas of high cone density from the inferior parafoveal region of the corresponding 12° × 12° montage, as indicated by the black square on the first subject's Voronoi density plot.
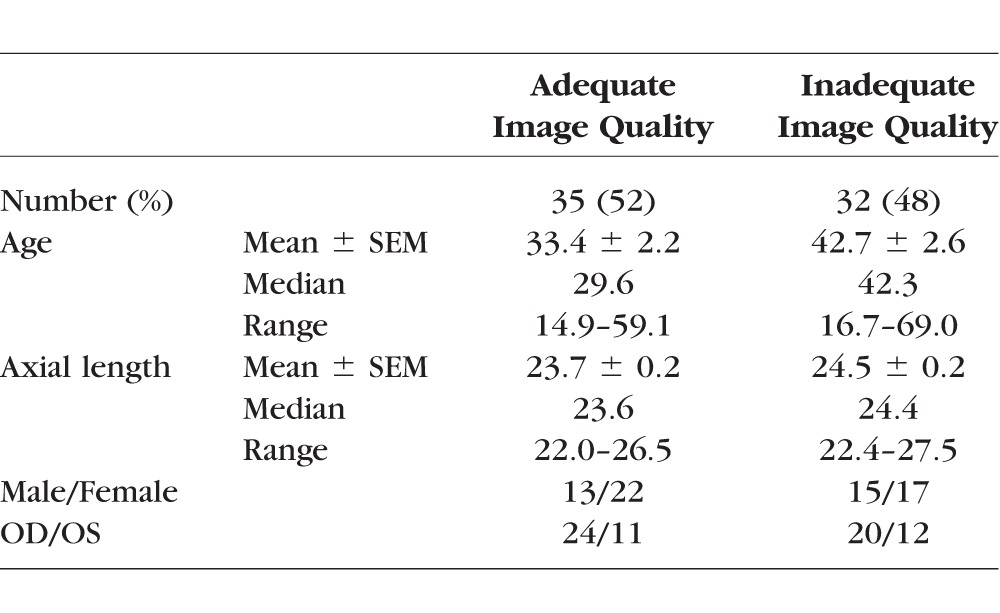
Using comparisons between manual and automatic cone identification of selected 50 × 50-μm samples, only 35 (52%) of the 67 subjects were determined to have adequate image quality for automated cone identification. Two of these subjects were excluded due to loss of follow-up before obtaining axial length measurements, so 33 subjects were included in analysis of mean cone density. Subject characteristics with images of adequate and inadequate quality for automatic cone identification are shown in Table 2. Supplementary Figure S1 illustrates the variability in image quality among both younger and older subjects.
Table 2.
Subject Characteristics by Image Quality for Automatic Cone Identification
Of samples that met criteria for adequate image quality, the number of automatically identified cones in each sample was on average 0.43% greater (0.07 cones) than manually identified cones (median: 0.34%, 0.17 cones). The performance of automatic cone counting of adequate images ranged from overcounting by 14% (seven cones) to undercounting by 11% (eight cones) compared with average number of cones manually identified in the 50 × 50-μm sample. Our exclusion criteria was defined by subjects whose images resulted in disagreement between automated cone counting and manual cone counting by more than 15%. In most of these excluded subjects, the automated cone counting algorithm identified additional bright spots as cones when observers determined these spots could have been caused by noise, rods, or cell debris.
Cone Density Measurements and the Effect of Sampling
On average, the FEZ was 1.9° (range, 1.2°–2.4°) from the preferred retinal locus, so measurements of average density were recorded only for regions greater than 2° from the preferred retinal locus.
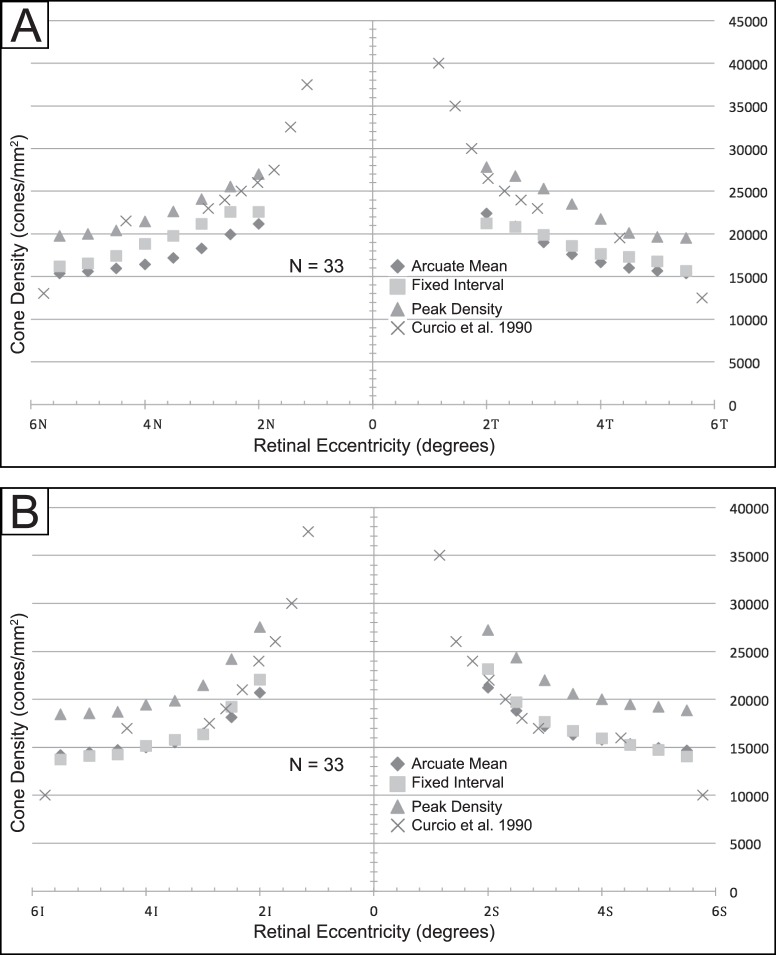
Measurement of cone density was influenced by the method of sampling (see Figs. 2A–C for sampling methods). Table 3 compares average measurement of cone density at expanding retinal eccentricities using the three sampling methods. Figure 4 compares our mean cone density values with cone densities at expanding retinal eccentricities reported in Curcio et al.44 Peak density measurements in arcuate regions are highest and most closely matched to the measurements of Curcio et al.44 along the nasal and temporal regions. However, peak density measurements were greater than the measurements of Curcio et al.44 in the superior and inferior regions. In the superior and inferior regions, sampling by the fixed-interval and by arcuate mean methods more closely resembled the measurements of Curcio et al.,44 particularly in the perifovea.
Table 3.
Mean Cone Density (n = 33) With SEM Measured in Temporal, Nasal, Inferior, and Superior Regions Using Fixed-Interval Sampling With a 50-μm Window, Arcuate Mean Density, and Peak Density in Arcuate Area With 50-μm Window
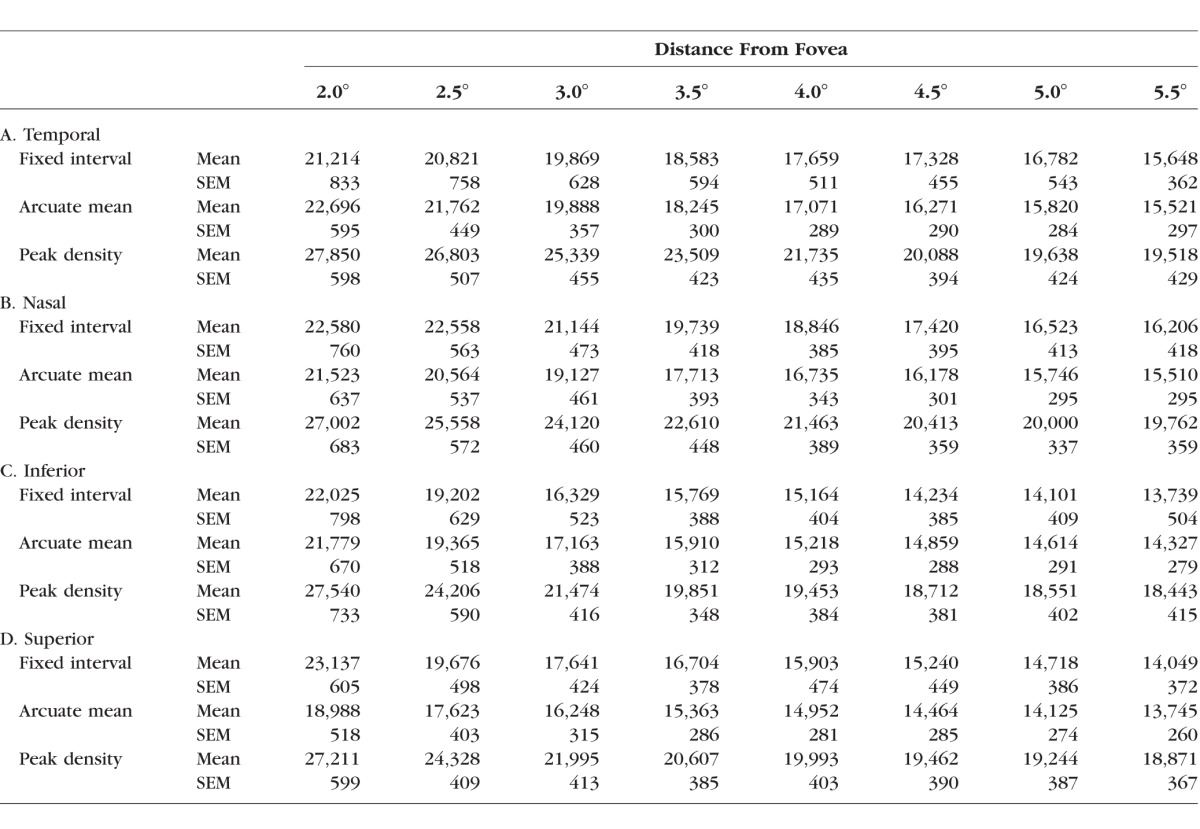
Figure 4.
Average cone density using three sampling methods, compared with Curcio average (n = 33) in (A) nasal and temporal quadrants and (B) superior and inferior quadrants.
Intersession Repeatability
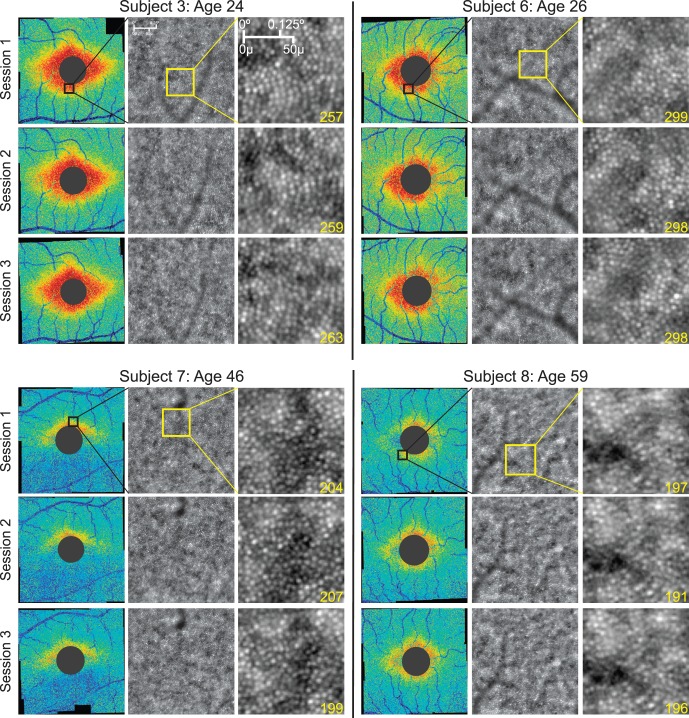
Figure 5 shows representative Voronoi density montages from of four of the nine subjects who underwent imaging on three repeated occasions. Overall density patterns were consistent even for subjects whose images were determined to be of inadequate quality for accurate cone identification. For example, there is a very low density of cones identified in the inferior parafovea for subject 7 due to poor image quality, and this region of low density remains consistent across all three sessions. It is unclear whether this region of low density was due to actual loss of photoreceptors or caused by other factors affecting image quality involving the cornea, lens, or vitreous. The CoV in cone density measured using each of the three described sampling methods for each subject is shown in Supplementary Table S1. The CoV averaged 9.5% using meridian sampling windows, 3.5% using arcuate windows, and 4.5% using peak density windows in regions 2.0° to 2.5° from the foveal center. The repeatability coefficient of cone density (RCCD) is shown in Supplementary Table S2. The RCCD of measurements using fixed-interval meridian sampling averaged 4119 cones/mm2 and 24% of the average cone density in that region. The RCCD of measurements using arcuate means averaged 1129 cones and 6.7%, and the RCCD of measurements using peak cone density windows averaged 2424 cones and 11%.
Figure 5.
Voronoi plots of four subjects, each imaged in three separate sessions. The black box overlaid on the “Session 1” Voronoi plots indicates the area of the corresponding magnified raw AO image. There are slight differences in cone density in each session, but the overall pattern of cone distribution remains consistent throughout the three sessions.
Discussion
Imaging a 12° × 12° region of the macula with flood-illuminated AO in a clinical setting using automated methods is feasible. However, high-quality, well-focused images could not always be obtained for accurate cone identification, even for several young, healthy subjects with no identifiable ocular pathology. It is uncertain whether cones could not be identified due to true properties of the retina (i.e., disruption of the photoreceptor layer or cellular debris overlying the retina) or due to other optical properties that prevented the camera from adequately focusing on the photoreceptor layer. We expect a similar phenomenon outside of our study population such that approximately half of all healthy subjects' rtx1 images will not be of adequate quality for accurate automated cone identification using our algorithm, particularly if the patients are older. This is disappointing; however, our goal was to assess what number of patients would have successful imaging in a clinically practical manner, and additional measures could be taken to improve this rate. For instance, we did not attempt to use artificial tears to improve tear film quality or dilate unless pupil diameter measured less than 4 mm. When we measured cone density in three eyes that were both dilated and undilated (with pupils greater than 4 mm), the differences were within the normal variation in our cone repeatability studies. Although we do not think dilation would result in changes to cone density, dilation might improve the number of patients with acceptable images as defined by our quality metric. Manual cone identification in manually selected regions of interest could also potentially increase the percentage of subjects whose images could be studied, but this would be unrealistically time-consuming for the large datasets we acquired for each subject. Additionally, it would be useful to identify characteristics of excluded images to enable automatic exclusion of images that cannot be counted.
For images determined to be of adequate quality, automatic measurements of cone density reliably matched manual cone identification for manually sampled areas, with cone counts differing on average by less than 0.5%. However, the accuracy of automatic cone identification may still be limited in accurately identifying cones within an entire 4° × 4° image. Within a single image, there may be certain regions in which cones still cannot be accurately identified, such as in areas in which there are background changes in intensity due to choroidal vasculature. Figure 6 illustrates the differences in cone visibility in two regions of the same image. Additionally, image quality can vary for each of 25 images taken from one subject. Sometimes the same region of the macula was imaged poorly in repeated imaging sessions, indicating a consistent property of the subject's eye. For example, the inferior parafovea of subject 7 in Figure 5 consistently demonstrates low density of identifiable cones across three imaging sessions. However, it is uncertain whether such consistent areas of low density constitute normal anatomic variants or undiagnosed pathologic conditions. In other instances, a single poor-quality image is the result of transient issues, such as technician error (i.e., poor focusing of the camera) or fixation loss during imaging. Previous studies have avoided these issues of varying image quality by manually selecting sampling windows and verifying automated cone identification manually. This is ideal for the accuracy of measurements, but may be impractical when studying a large region of interest.
Figure 6.

Variability in cone clarity in a single image. (A) Original 4 × 4 image of a subject with yellow and blue squares shown in (B) and (C). (B) Area in which cones are easily identifiable. (C) Area in which cones are less easily identifiable, despite being taken from the same original image.
Because the image quality varies across individual images as well as across different images of the same subject, our cone density maps of the entire macular region are not an entirely accurate representation of density. Instead, these cone density montages give a qualitative estimate of global patterns in cone density in each individual. Because cones could not accurately be identified in image samples of nearly half of healthy subjects using automated techniques, a density montage showing relatively low cone density may not indicate definite pathology. Further studies are necessary to identify why it is so difficult to obtain adequate-quality images in so many apparently normal eyes. In our study, we attempted to reduce the inaccuracies of cone identification algorithms by excluding from our analysis a large percentage of subjects whose sample images were determined inadequate for cone counting. Although inaccuracies may still exist in small sections of our included cone density montages due to errors in cone identification, we believe that the montages still provide a reasonable estimate and representation of cone density of the imaged region.
Voronoi Density Maps and Edge Effects
In our study, we used Voronoi density maps rather than the conventional approach that applies sampling windows to the binary cone detection map when sampling cone density. Although there is no significant difference between density measurements between the two methods, there can be slight differences in edge effects. When applying sampling windows to the Voronoi density map montages, the results from one window are dependent on the cone patterns in the neighboring windows. This is because the size of the Voronoi cells near the window edge is dependent on the cone behavior just beyond the edge. This edge effect will be more pronounced with lower or irregular cone density and smaller windows, as larger windows will tend to average out the edge effects. Although the conventional approach would not have these edge effects, montaging binary cone detection maps creates other sources of error from image alignment and blending inaccuracies. Thus, the Voronoi approach may have sampling window edge effects and the conventional approach may have image edge effects in the overlap regions of the montage. The latter primarily depends on image quality, which we have relatively little control over. In comparison, the Voronoi method allows the choice of sampling window size to help mitigate edge effects.
Measuring Cone Density and the Effect of Sampling
The goal of our protocol was to develop a fast technique that could process entire patient montages soon after imaging a subject, so we used automated regional analysis rather than manually selected areas. We present three automated sampling methods for measuring density.
Automated sampling windows placed at consistent intervals (fixed-interval method) avoid time-consuming manual window selection, but this method does not exclude blood vessels or areas of poor image quality. Window placement can have a significant effect on cone density measurements, and automatic placement of windows could potentially sample density in a small area of poor cone resolution. With such small sampling windows, minor changes in alignment can lead to major changes in cone density, leading to poor repeatability of measurements.
Measuring density across an arcuate area provides more global evaluation of photoreceptor distribution, but it also compromises some accuracy and precision because it averages out cone density over a large area; there may be differences in cone density across the sampled area and small regions of poorer quality in which cones cannot be accurately counted. However, the repeatability of measurements using this sampling method was highest, which is consistent with a previous study that demonstrated larger sampling windows lead to more repeatable measurements.52
Automated peak cone density measurements mimic manually selected sampling windows. By detecting the maximum cone density from a 50 × 50-μm sliding window in a 0.5° thick arcuate area, the resulting sample window was presumably of high image quality with exclusion of blood vessels. This method most closely approximated histological cone density measurements in the parafovea, where there are densely packed cones and areas of high image quality. However, the peak density of an area is not always representative of an entire region; this method finds small pockets of high cone density even if most of the surrounding area has significantly lower density, such as in the perifovea. Inaccuracies of this method also result from the overidentification of cones by automated software in regions of poor image quality. This sampling method results in better repeatability than fixed-interval sampling using the same window size, but measurements are not as repeatable as sampling from larger arcuate areas. Also, this method does not sample the same macular location each time; peak density can be in a different location for the same subject at different imaging sessions.
Our measured cone density values are similar to anatomic and scanning laser ophthalmoscope measurements from previous studies,37,44,47–50,56–58 however the differences in image acquisition, cone identification, and sampling make direct comparisons difficult. Peak cone density measurements were intended to mimic manually selected windows of highest quality, so we anticipated the measurements from this sampling method would most closely resemble histological data. However, while peak density most closely matched histological data within approximately 4° eccentricity in the nasal and temporal quadrants, it overestimated cone density in the superior and inferior quadrants and in all quadrants at eccentricities greater than 4°. This suggests automated cone counting in these regions may overestimate the true number of cones by identifying white spots that represent rods, debris, or other noise as cones. However, our peak density is not directly comparable to histological studies, as we allowed peak density to be found anywhere across the circular arcuate region of interest. Displacement of our peak density window from the fixed-interval location can be up to 2° from the meridian and 0.25° from the eccentricity. The topography of density also follows a more oblique pattern in the inferior and superior quadrants than the circular arcuate pattern of our region of interest, and this could partially account for the overidentification of cones along the vertical meridian. The significance of the differences of our methods compared to histological studies is difficult to interpret. However it should be noted that different sampling methods can produce widely different results. One region of interest can produce a range of cone density measurements depending on the size and placement of the sampling window.
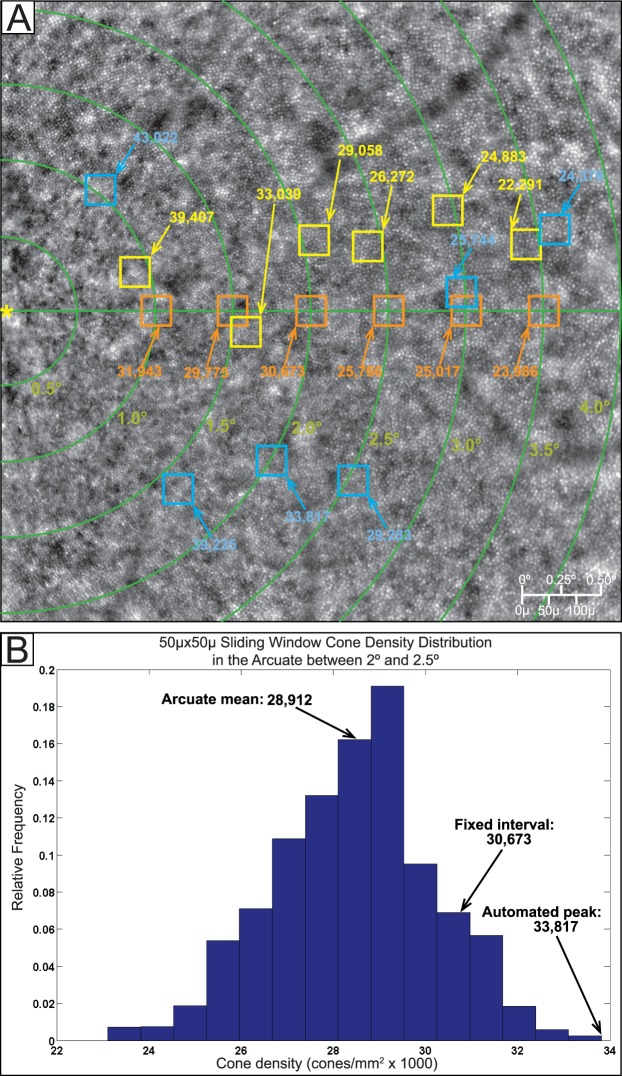
The variability of cone density with sampling should also be a consideration in manual placement of sampling windows. Figure 7A illustrates the difference in cone densities between automated and manually positioned 50 × 50-μm sampling windows in one subject. Figure 7B shows the cone densities calculated at every possible 50 × 50-μm window location within the arcuate region shown between 2.0° and 2.5°, graphed in relative frequency. When manually selecting window placement, a user would find a most representative region of high image quality and tightly packed cones. This would be a subjective judgment leading to measurement anywhere along the x-axis in Figure 7B. Sampling via arcuate means is effectively an average of widely distributed cone density values within a large arcuate window. Fixed-interval sampling is effectively selecting a random window with a value anywhere in the range of cone density values shown in the x-axis. Automated peak cone density entails recording only the largest (right-most on the x-axis) value in cone density.
Figure 7.
Illustration of changes in cone density due to sampling window adjustments. (A) A 4° × 4° tile centered at 2.0° nasal to the fovea (yellow asterisk). The green lines demarcate concentric rings every 0.5° eccentric from the fovea. The orange squares represent the position of the sampling windows taken every 0.5° along the horizontal meridian. The blue squares represent the position of automated peak cone density 50 × 50-μm sampling windows along each eccentricity. The yellow squares represent manually placed 50 × 50-μm sampling windows, in which an observer manually selected an area of high image quality and high cone density along the same eccentricities. (B) Histogram of cone density distribution along the arcuate area of 0.5° thickness centered at 2.0°. Sampling via arcuate means is effectively an average of widely distributed cone density values within this large arcuate window. Fixed-interval sampling is effectively selecting a random window with a value anywhere in the range of cone density values shown in the x-axis. Automated peak cone density entails recording only the largest (right-most on the x-axis) value in cone density.
Ultimately, manual sampling is the gold standard because it ensures accurate cone counting of a carefully selected region of interest, and it is absolutely necessary when observing a single region of interest in repeated imaging sessions. However, the assumption that manually sampled areas of highest quality are also the most accurate representation of cone density for that region ignores the variability in cone density measurements in a region. Some regional variability from sampling could be an artifact of image quality and automated cone detection, particularly when the choroidal and retinal vasculature causes uneven background darkening. However, even in the highest-quality images, the varied placement of sampling windows can produce a range of measured density values and subtle changes in sampling can cause significant changes in density measurements. This makes it difficult to compare cone density measurements across studies using different sampling methods. We expect that with improved cone identification algorithms, filtering of regions of poor quality, and ultimately improved image quality from commercial systems, we can eventually create automated cone identification and density sampling methods that more consistently and accurately represent cone density without requiring the subjective and time-consuming processes currently used.
Limitations, Improvements, and Future Studies
The most significant limitation to using the rtx1 camera in our study was that accurate cone counting could not be performed on almost half of our healthy subjects. Additionally, even among subjects for which we could accurately automatically identify cones, there were some regions of their images for which cone identification was not accurate. These issues are due to limitations in both the image quality and our cone identification software. Further study is necessary to identify sources of poor image quality and to determine methods to improve the rate of successful imaging. We also excluded cones within 1.9° (0.5 mm) of the foveal center on average; this is an area of significant change in cone density and of considerable variation in density between individuals.44,45
The repeatability of measurements from these sampling methods is reasonable, but still indicates that there can be significant variability between cone density measurements in the same individual across imaging sessions. There needs to be large change in cone density to conclusively prove progression of disease. Further repeatability studies are necessary to better define limitations in repeatability and the utility of different sampling methods for longitudinal studies.
Conclusions
The rtx1 allows for imaging of a large area of the macula within 20 to 30 minutes. For many subjects, cone density and distribution can be reasonably assessed using cone density Voronoi montages and automated sampling of cone density. These methods produce consistent and clinically useful Voronoi montages that qualitatively demonstrate general patterns in an individual's cone density distribution of an entire 12° × 12° region. Our automated sampling methods also reasonably estimate regional cone density and allow for faster quantification of cone density in a large area. However, interpretation of cone density from these images is limited by image quality and the accuracy of automated cone identification. Further improvements to image acquisition and processing methods will increase the success rate of obtaining images for which we can accurately identify cones, particularly in older patients and in patients with retinal disease.
Supplementary Material
Acknowledgments
Supported by Foundation Fighting Blindness (career development award [CDA] to MEP), Research to Prevent Blindness (CDA to MEP and unrestricted to CEI), Collins Medical Trust (MEP), Medical Research Foundation of Oregon (MEP), K08 Career Development Award (1 K08 EY021186-01), ARVO/Alcon Young Clinician Scientist Research Award (MEP), and Fight For Sight Summer Student Fellowships (FFS-SS-11-025, FFS-SS-13-029, FFS-SS-12-010) (AKG, HET, MJG).
Disclosure: S. Feng, None; M.J. Gale, None; J.D. Fay, None; A. Faridi, None; H.E. Titus, None; A.K. Garg, None; K.V. Michaels, None; L.R. Erker, None; D. Peters, None; T.B. Smith, None; M.E. Pennesi, Imagine Eyes (R)
References
- 1. Choi SS,, Doble N,, Hardy JL,, et al. In vivo imaging of the photoreceptor mosaic in retinal dystrophies and correlations with visual function. Invest Ophthalmol Vis Sci. 2006; 47: 2080–2092. [DOI] [PMC free article] [PubMed] [Google Scholar]
- 2. Wolfing JI,, Chung M,, Carroll J,, Roorda A,, Williams DR. High-resolution retinal imaging of cone-rod dystrophy. Ophthalmology. 2006; 113:1019. e1. [DOI] [PubMed]
- 3. Baraas RC,, Carroll J,, Gunther KL,, et al. Adaptive optics retinal imaging reveals S-cone dystrophy in tritan color-vision deficiency. J Opt Soc Am A Opt Image Sci Vis. 2007; 24: 1438–1447. [DOI] [PMC free article] [PubMed] [Google Scholar]
- 4. Duncan JL,, Zhang Y,, Gandhi J,, et al. High-resolution imaging with adaptive optics in patients with inherited retinal degeneration. Invest Ophthalmol Vis Sci. 2007; 48: 3283–3291. [DOI] [PubMed] [Google Scholar]
- 5. Carroll J,, Choi SS,, Williams DR. In vivo imaging of the photoreceptor mosaic of a rod monochromat. Vision Res. 2008; 48: 2564–2568. [DOI] [PMC free article] [PubMed] [Google Scholar]
- 6. Chen Y,, Roorda A,, Duncan JL. Advances in imaging of Stargardt disease. Adv Exp Med Biol. 2010; 664: 333–340. [DOI] [PMC free article] [PubMed] [Google Scholar]
- 7. Audo I,, El Sanharawi M,, Vignal-Clermont C,, et al. Foveal damage in habitual poppers users. Arch Ophthalmol. 2011; 129: 703–708. [DOI] [PubMed] [Google Scholar]
- 8. Duncan JL,, Roorda A,, Navani M,, et al. Identification of a novel mutation in the CDHR1 gene in a family with recessive retinal degeneration. Arch Ophthalmol. 2012; 130: 1301–1308. [DOI] [PMC free article] [PubMed] [Google Scholar]
- 9. Godara P,, Cooper RF,, Sergouniotis PI,, et al. Assessing retinal structure in complete congenital stationary night blindness and Oguchi disease. Am J Ophthalmol. 2012; 154: 987–1001.e1. [DOI] [PMC free article] [PubMed] [Google Scholar]
- 10. Ratnam K,, Vastinsalo H,, Roorda A,, Sankila EM,, Duncan JL. Cone structure in patients with Usher syndrome type III and mutations in the Clarin 1 gene. Arch Ophthalmol. 2012; 131: 1–8. [DOI] [PMC free article] [PubMed] [Google Scholar]
- 11. Mkrtchyan M,, Lujan BJ,, Merino D,, Thirkill CE,, Roorda A,, Duncan JL. Outer retinal structure in patients with acute zonal occult outer retinopathy. Am J Ophthalmol. 2012; 153: 757–768, 768.e1. [DOI] [PMC free article] [PubMed] [Google Scholar]
- 12. Gocho K,, Sarda V,, Falah S,, et al. Adaptive optics imaging of geographic atrophy. Invest Ophthalmol Vis Sci. 2013; 54: 3673–3680. [DOI] [PubMed] [Google Scholar]
- 13. Hansen SO,, Cooper RF,, Dubra A,, Carroll J,, Weinberg DV. Selective cone photoreceptor injury in acute macular neuroretinopathy. Retina. 2013; 33: 1650–1658. [DOI] [PMC free article] [PubMed] [Google Scholar]
- 14. Kay DB,, Land ME,, Cooper RF,, et al. Outer retinal structure in best vitelliform macular dystrophy. JAMA Ophthalmol. 2013; 131: 1207–1215. [DOI] [PMC free article] [PubMed] [Google Scholar]
- 15. Syed R,, Sundquist SM,, Ratnam K,, et al. High-resolution images of retinal structure in patients with choroideremia. Invest Ophthalmol Vis Sci. 2013; 54: 950–961. [DOI] [PMC free article] [PubMed] [Google Scholar]
- 16. Vincent AL,, Carroll J,, Fishman GA,, et al. F45L allele does not cause autosomal dominant retinitis pigmentosa in a large Caucasian family. Transl Vis Sci Technol. 2013; 2: 4. [DOI] [PMC free article] [PubMed] [Google Scholar]
- 17. Ratnam K,, Carroll J,, Porco TC,, Duncan JL,, Roorda A. Relationship between foveal cone structure and clinical measures of visual function in patients with inherited retinal degenerations. Invest Ophthalmol Vis Sci. 2013; 54: 5836–5847. [DOI] [PMC free article] [PubMed] [Google Scholar]
- 18. Rossi EA,, Rangel-Fonseca P,, Parkins K,, et al. In vivo imaging of retinal pigment epithelium cells in age related macular degeneration. Biomed Opt Express. 2013; 4: 2527–2539. [DOI] [PMC free article] [PubMed] [Google Scholar]
- 19. Sundaram V,, Wilde C,, Aboshiha J,, et al. Retinal structure and function in achromatopsia: implications for gene therapy. Ophthalmology. 2014; 121: 234–245. [DOI] [PMC free article] [PubMed] [Google Scholar]
- 20. Langlo CS,, Flatter JA,, Dubra A,, Wirostko WJ,, Carroll J. A lensing effect of inner retinal cysts on images of the photoreceptor mosaic. Retina. 2014; 34: 421–422. [DOI] [PMC free article] [PubMed] [Google Scholar]
- 21. Tojo N,, Nakamura T,, Ozaki H,, Oka M,, Oiwake T,, Hayashi A. Analysis of macular cone photoreceptors in a case of occult macular dystrophy. Clin Ophthalmol. 2013; 7: 859–864. [DOI] [PMC free article] [PubMed] [Google Scholar]
- 22. Tojo N,, Nakamura T,, Fuchizawa C,, Oiwake T,, Hayashi A. Adaptive optics fundus images of cone photoreceptors in the macula of patients with retinitis pigmentosa. Clin Ophthalmol. 2013; 7: 203–210. [DOI] [PMC free article] [PubMed] [Google Scholar]
- 23. Makiyama Y,, Ooto S,, Hangai M,, et al. Cone abnormalities in fundus albipunctatus associated with RDH5 mutations assessed using adaptive optics scanning laser ophthalmoscopy. Am J Ophthalmol. 2014; 157: 558–570.e1 –e4. [DOI] [PubMed] [Google Scholar]
- 24. Akagi-Kurashige Y,, Tsujikawa A,, Ooto S,, et al. Retinal microstructural changes in eyes with resolved branch retinal vein occlusion: an adaptive optics scanning laser ophthalmoscopy study. Am J Ophthalmol. 2014; 157: 1239–1249. [DOI] [PubMed] [Google Scholar]
- 25. Yokota S,, Ooto S,, Hangai M,, et al. Objective assessment of foveal cone loss ratio in surgically closed macular holes using adaptive optics scanning laser ophthalmoscopy. PLoS One. 2013; 8: e63786. [DOI] [PMC free article] [PubMed] [Google Scholar]
- 26. Ooto S,, Hangai M,, Takayama K,, et al. Comparison of cone pathologic changes in idiopathic macular telangiectasia types 1 and 2 using adaptive optics scanning laser ophthalmoscopy. Am J Ophthalmol. 2013; 155: 1045–1057.e4. [DOI] [PubMed] [Google Scholar]
- 27. Carroll J,, Kay DB,, Scoles D,, Dubra A,, Lombardo M. Adaptive optics retinal imaging--clinical opportunities and challenges. Curr Eye Res. 2013; 38: 709–721. [DOI] [PMC free article] [PubMed] [Google Scholar]
- 28. Godara P,, Dubis AM,, Roorda A,, Duncan JL,, Carroll J. Adaptive optics retinal imaging: emerging clinical applications. Optom Vis Sci. 2010; 87: 930–941. [DOI] [PMC free article] [PubMed] [Google Scholar]
- 29. Makiyama Y,, Ooto S,, Hangai M,, et al. Macular cone abnormalities in retinitis pigmentosa with preserved central vision using adaptive optics scanning laser ophthalmoscopy. PLoS One. 2013; 8: e79447. [DOI] [PMC free article] [PubMed] [Google Scholar]
- 30. Morgan JI,, Han G,, Klinman E,, et al. High-resolution adaptive optics retinal imaging of cellular structure in choroideremia. Invest Ophthalmol Vis Sci. 2014; 55: 6381–6397. [DOI] [PMC free article] [PubMed] [Google Scholar]
- 31. Lombardo M,, Parravano M,, Lombardo G,, et al. Adaptive optics imaging of parafoveal cones in type 1 diabetes. Retina. 2014; 34: 546–557. [DOI] [PubMed] [Google Scholar]
- 32. Lombardo M,, Parravano M,, Serrao S,, Ducoli P,, Stirpe M,, Lombardo G. Analysis of retinal capillaries in patients with type 1 diabetes and nonproliferative diabetic retinopathy using adaptive optics imaging. Retina. 2013; 33: 1630–1639. [DOI] [PubMed] [Google Scholar]
- 33. Mrejen S,, Sato T,, Curcio CA,, Spaide RF. Assessing the cone photoreceptor mosaic in eyes with pseudodrusen and soft Drusen in vivo using adaptive optics imaging. Ophthalmology. 2014; 121: 545–551. [DOI] [PMC free article] [PubMed] [Google Scholar]
- 34. Mrejen S,, Gallego-Pinazo R,, Wald KJ,, Freund KB. Acute posterior multifocal placoid pigment epitheliopathy as a choroidopathy: what we learned from adaptive optics imaging. JAMA Ophthalmol. 2013; 131: 1363–1364. [DOI] [PubMed] [Google Scholar]
- 35. Dessalces E,, Bocquet B,, Bourien J,, et al. Early-onset foveal involvement in retinitis punctata albescens with mutations in RLBP1. JAMA Ophthalmol. 2013; 131: 1314–1323. [DOI] [PubMed] [Google Scholar]
- 36. Viard C,, Nakashima K,, Lamory B,, Pâques M,, Levecq X,, Château N. Imaging microscopic structures in pathological retinas using a flood-illumination adaptive optics retinal camera. Proc SPIE. 2011; 7885: 488–509. [Google Scholar]
- 37. Lombardo M,, Lombardo G, Schiano Lomoriello D, Ducoli P, Stirpe M, Serrao S. Interocular symmetry of parafoveal photoreceptor cone density distribution. Retina. 2013; 33: 1640–1649. [DOI] [PubMed] [Google Scholar]
- 38. Lombardo M,, Serrao S,, Ducoli P,, Lombardo G. Eccentricity dependent changes of density, spacing and packing arrangement of parafoveal cones. Ophthalmic Physiol Opt. 2013; 33: 516–526. [DOI] [PubMed] [Google Scholar]
- 39. Lombardo M,, Serrao S,, Ducoli P,, Lombardo G. Variations in image optical quality of the eye and the sampling limit of resolution of the cone mosaic with axial length in young adults. J Cataract Refract Surg. 2012; 38: 1147–1155. [DOI] [PubMed] [Google Scholar]
- 40. Park SP,, Chung JK,, Greenstein V,, Tsang SH,, Chang S. A study of factors affecting the human cone photoreceptor density measured by adaptive optics scanning laser ophthalmoscope. Exp Eye Res. 2013; 108: 1–9. [DOI] [PMC free article] [PubMed] [Google Scholar]
- 41. Ramaswamy G,, Devaney N. Pre-processing, registration and selection of adaptive optics corrected retinal images. Ophthalmic Physiol Opt. 2013; 33: 527–539. [DOI] [PubMed] [Google Scholar]
- 42. Sahin B,, Lamory B,, Levecq X,, Harms F,, Dainty C. Adaptive optics with pupil tracking for high resolution retinal imaging. Biomed Opt Express. 2012; 3: 225–239. [DOI] [PMC free article] [PubMed] [Google Scholar]
- 43. Lombardo M,, Serrao S,, Ducoli P,, Lombardo G. Influence of sampling window size and orientation on parafoveal cone packing density. Biomed Opt Express. 2013; 4: 1318–1331. [DOI] [PMC free article] [PubMed] [Google Scholar]
- 44. Curcio CA,, Sloan KR,, Kalina RE,, Hendrickson AE. Human photoreceptor topography. J Comp Neurol. 1990; 292: 497–523. [DOI] [PubMed] [Google Scholar]
- 45. Curcio CA,, Sloan KR. Packing geometry of human cone photoreceptors: variation with eccentricity and evidence for local anisotropy. Vis Neurosci. 1992; 9: 169–180. [DOI] [PubMed] [Google Scholar]
- 46. Xue B,, Choi SS,, Doble N,, Werner JS. Photoreceptor counting and montaging of en-face retinal images from an adaptive optics fundus camera. J Opt Soc Am A Opt Image Sci Vis. 2007; 24: 1364–1372. [DOI] [PMC free article] [PubMed] [Google Scholar]
- 47. Chui TY,, Song H,, Burns SA. Adaptive-optics imaging of human cone photoreceptor distribution. J Opt Soc Am A Opt Image Sci Vis. 2008; 25: 3021–3029. [DOI] [PMC free article] [PubMed] [Google Scholar]
- 48. Chui TY,, Song H,, Burns SA. Individual variations in human cone photoreceptor packing density: variations with refractive error. Invest Ophthalmol Vis Sci. 2008; 49: 4679–4687. [DOI] [PMC free article] [PubMed] [Google Scholar]
- 49. Dees EW,, Dubra A,, Baraas RC. Variability in parafoveal cone mosaic in normal trichromatic individuals. Biomed Opt Express. 2011; 2: 1351–1358. [DOI] [PMC free article] [PubMed] [Google Scholar]
- 50. Merino D,, Duncan JL,, Tiruveedhula P,, Roorda A. Observation of cone and rod photoreceptors in normal subjects and patients using a new generation adaptive optics scanning laser ophthalmoscope. Biomed Opt Express. 2011; 2: 2189–2201. [DOI] [PMC free article] [PubMed] [Google Scholar]
- 51. Song H,, Chui TY,, Zhong Z,, Elsner AE,, Burns SA. Variation of cone photoreceptor packing density with retinal eccentricity and age. Invest Ophthalmol Vis Sci. 2011; 52: 7376–7384. [DOI] [PMC free article] [PubMed] [Google Scholar]
- 52. Garrioch R,, Langlo C,, Dubis AM,, Cooper RF,, Dubra A,, Carroll J. Repeatability of in vivo parafoveal cone density and spacing measurements. Optom Vis Sci. 2012; 89: 632–643. [DOI] [PMC free article] [PubMed] [Google Scholar]
- 53. Li KY,, Roorda A. Automated identification of cone photoreceptors in adaptive optics retinal images. J Opt Soc Am A Opt Image Sci Vis. 2007; 24: 1358–1363. [DOI] [PubMed] [Google Scholar]
- 54. Bennett AG,, Rudnicka AR,, Edgar DF. Improvements on Littmann's method of determining the size of retinal features by fundus photography. Graefes Arch Clin Exp Ophthalmol. 1994; 232: 361–367. [DOI] [PubMed] [Google Scholar]
- 55. Bland JM,, Altman DG. Measurement error proportional to the mean. BMJ. 1996; 313: 106. [DOI] [PMC free article] [PubMed] [Google Scholar]
- 56. Torti C,, Povazay B,, Hofer B,, et al. Adaptive optics optical coherence tomography at 120,000 depth scans/s for non-invasive cellular phenotyping of the living human retina. Opt Express. 2009; 17: 19382–19400. [DOI] [PMC free article] [PubMed] [Google Scholar]
- 57. Rha J,, Dubis AM,, Wagner-Schuman M,, et al. Spectral domain optical coherence tomography and adaptive optics: imaging photoreceptor layer morphology to interpret preclinical phenotypes. Adv Exp Med Biol. 2010; 664: 309–316. [DOI] [PMC free article] [PubMed] [Google Scholar]
- 58. Michaelides M,, Rha J,, Dees EW,, et al. Integrity of the cone photoreceptor mosaic in oligocone trichromacy. Invest Ophthalmol Vis Sci. 2011; 52: 4757–4764. [DOI] [PMC free article] [PubMed] [Google Scholar]
Associated Data
This section collects any data citations, data availability statements, or supplementary materials included in this article.


