Abstract
Purpose
To evaluate whether the densities of corneal subbasal nerves and epithelial immune dendritiform cells (DCs) are comparable between a set of three representative standard images of in vivo confocal microscopy (IVCM) and the wide-field mapped composite IVCM images.
Methods
This prospective, cross-sectional, and masked study included 110 eyes of 58 patients seen in a neurology clinic who underwent laser-scanning IVCM (Heidelberg Retina Tomograph 3) of the central cornea. Densities of subbasal corneal nerves and DCs were compared between the average of three representative standard images and the wide-field mapped composite images, which were reconstructed by automated mapping.
Results
There were no statistically significant differences between the average of three representative standard images (0.16 mm2 each) and the wide-field composite images (1.29 ± 0.64 mm2) in terms of mean subbasal nerve density (17.10 ± 6.10 vs. 17.17 ± 5.60 mm/mm2, respectively, P = 0.87) and mean subbasal DC density (53.2 ± 67.8 vs. 49.0 ± 54.3 cells/mm2, respectively, P = 0.43). However, there were notable differences in subbasal nerve and DC densities between these two methods in eyes with very low nerve density or very high DC density.
Conclusions
There are no significant differences in the mean subbasal nerve and DC densities between the average values of three representative standard IVCM images and wide-field mapped composite images. Therefore, these standard images can be used in clinical studies to accurately measure cellular structures in the subbasal layer.
Keywords: in vivo confocal microscopy, corneal nerves, wide-field composite images
Using in vivo confocal microscopy (IVCM) on 110 eyes, this prospective study showed no significant difference in mean density of corneal subbasal nerves and immune dendritiform cells between the average of three representative standard IVCM images and the wide-field mapped composite IVCM images and the wide-field mapped composite IVCM images.
In vivo confocal microscopy (IVCM) is a noninvasive imaging technique that provides high-resolution real-time images of patients' tissues at a cellular level. Since its original application in ophthalmology by Lemp and colleagues,1 IVCM has increasingly been used in a variety of corneal diseases.2–4 All corneal layers can be visualized by IVCM, including the epithelium, subbasal layer, Bowman's layer, stroma, and endothelium. Of paramount importance is the subbasal layer, in which epithelial immune dendritiform cells (DCs) and the subbasal nerve plexus can be clearly visualized.5–9 Dentritic cells are the professional antigen-presenting cells of the cornea and have a critical function in activation of the immune system in the ocular surface, playing a role in both suppression and induction of inflammation.10–13 Furthermore, in addition to providing trophic and sensory functions, corneal nerves have been shown to play an important role in the maintenance of ocular surface epithelial health and function.14–17 As epithelial DCs and subbasal nerves may change in a variety of ocular surface and corneal conditions, such as dry eye disease, neurotrophic keratopathy, infectious keratitis, diabetes, and contact lens wear,3,5,18–22 quantification of these two structures, which can be achieved by IVCM, is of significant importance.
The high resolution of IVCM images is inherently associated with a drawback, which is a relatively small field of view of the images. The image area is 400 by 400 μm with laser scanning IVCM (Heidelberg Retina Tomograph 3; Heidelberg Engineering, Heidelberg, Germany) or 460 by 345 μm with slit scanning IVCM (Confoscan 4; Nidek, Gamagori, Japan), which cover approximately 2% of the 3-mm central cornea. To compensate for such a limited imaging area, multiple locations in the cornea are generally scanned and a number of representative images of the subbasal layer from these locations are used to estimate the density of nerves and DCs in the subbasal layer.23,24 Alternatively, a wide-field mapping of composite images of a larger area has recently been employed for the subbasal layer.25–31 The wide-field composite images are generated by mapping a number of the standard IVCM images manually or by using automated software.25–31 This is achieved by image stitching through identifying common landmarks or key points, such as nerves, across images that define the transformation between the overlapping images.25–31 Although these composite images cover a significantly larger area of the corneal subbasal layer as compared to standard images, the technology is currently not widely available.25–31 In addition, it is not clear whether the densities of subbasal structures are similar between the composite images and the representative standard images.
We hypothesized that the nerve and DC densities would not be different between the average value of three representative standard IVCM images and the wide-field composites of the corneal subbasal layer. Therefore, this study has been designed to compare the nerve and DC densities between these two methods of IVCM image analysis.
Materials and Methods
This prospective, cross-sectional, and masked study included 58 subjects who consecutively visited and were recruited from November 2012 to December 2013 at the NeuroCure Clinical Research Center, Charité–Universitätsmedizin Berlin, Germany. All patients underwent IVCM of both eyes, and both standard images and wide-field composite images were acquired. The study was approved by the local Ethics Review Board of the Charité–Universitätsmedizin Berlin (EA1/231/12) and was conducted in accord with the tenets of the Declaration of Helsinki. All subjects provided written informed consent before participation in this study.
Standard In Vivo Confocal Microscopy
All subjects underwent IVCM using a Heidelberg Retina Tomograph 3 with the Rostock Cornea Module (HRT3/RCM; Heidelberg Engineering) of the central cornea in both eyes. This IVCM utilizes a 670-nm diode laser and provides digital images of the cornea using the sequence mode, consisting of 100 standard images per sequence. Each standard image was composed of an area of 400 × 400 μm of the cornea. Adjacent images are separated by approximately 1 to 4 μm and have a lateral resolution of 1 μm/pixel. Acquired images are 384 × 384 pixels in size and are stored at a speed of 30 frames per second. In vivo confocal microscopy imaging was performed by a method previously described in detail.21 In brief, the distance from the cornea to the microscope was kept stable by a single-use disposable sterile polymethylmethacrylate cap (Tomo-Cap; Heidelberg Engineering), filled with a layer of the lubricant 2 mg/g carbomer-containing gel (Vidisic gel; Bausch & Lomb, Heidelberg, Germany). Both eyes were instilled with topical anesthesia using Oxybuprocaine hydrochloride 4 mg (Conjuncain EDO; Dr Gerhard Mann Chem.-Pharm. Fabrik GmbH, Berlin, Germany) followed by a drop of the lubricant 2 mg/g carbomer-containing gel (Vidisic gel; Bausch & Lomb). Another drop of the lubricant was applied on the outside tip of the Tomo-Cap to improve and facilitate the optical coupling to the examined eye. The microscope was then manually advanced until the gel contacted the central surface of the cornea. A total of three or four scans in sequence mode were obtained in various locations in the center of each cornea with special emphasis in the region of interest, focusing on epithelial DCs at the level of basal epithelial cells, on the subbasal nerve plexus, at the depth of 50 to 80 μm. Here, at least three or four sequence scans of the subbasal layer in various locations in the central cornea were obtained, resulting in 300 to 400 standard IVCM images of per cornea.
Wide-Field Composite Image Mapping
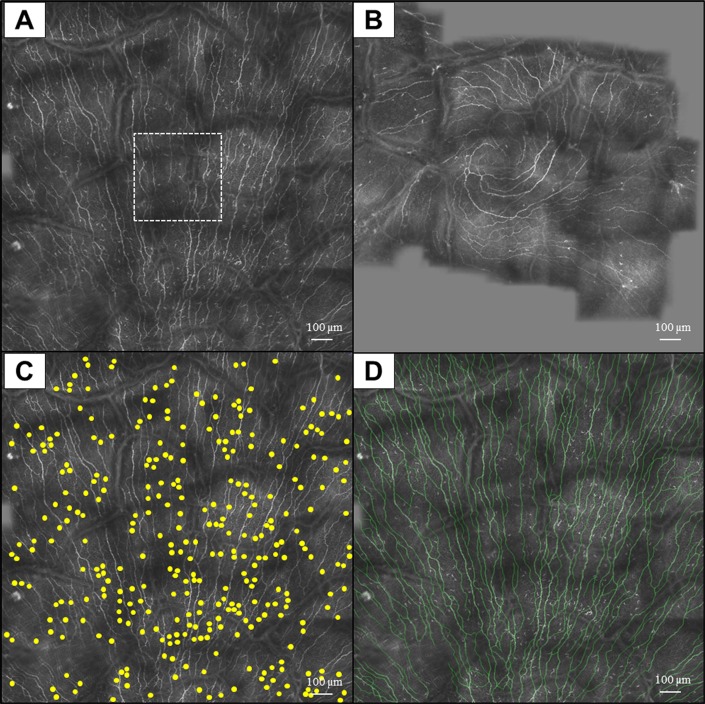
The details of the wide-field composite image acquisition and mapping have been described previously.26,32 In summary, composite images were acquired by the HRT3/RCM device's software function “composite” (HRT II/3 Cornea Acquisition Module version 1.3.3.2). Each acquisition started with a center image comparable to a single scan. To then acquire composite images, an experienced operator (JM) manually moved the objective over the cornea while keeping the subbasal nerve plexus in focus. During this process, the software automatically mapped repeated scans to a composite image, using an affine transformation method.27 This software requires a reasonably overlapping area in at least two sequential scans. Fast movement, that is, from saccades, will stop the mapping. In each case the operator tried to acquire the maximum possible composite size of 3072 × 3072 pixels (3.2 × 3.2 mm). In most cases, however, the software-based assembly stopped prior to this goal being reached, resulting in smaller composite images than the maximum possible (Figs. 1A, 1B).
Figure 1.
Wide-field composite IVCM images of the subbasal layer in the central cornea (A, B). The composite image is significantly larger compared with a standard image (dashed box in [A]). Use of the Cell Counter plug-in of ImageJ (C) and the NeuronJ (D) for measuring the DC and nerve densities, respectively.
Image Analysis
An experienced masked observer (AK) selected three representative standard images for corneal subbasal nerves and three for DC analysis for each eye. The best-focused and complete images, with the whole image in the same layer and good contrast, were chosen from the basal epithelial layer and anterior to the Bowman's layer. In the subbasal layer, the images were analyzed for density of the subbasal nerves and immune DCs, as previously described.9 Dentritiform cells were identified by their morphology of bright dendritiform structures with cell bodies, which were different from linear structures of corneal nerves.33 To calculate the density of DCs, the ImageJ software (National Institutes of Health, Bethesda, MD, USA) was used. For standard IVCM images, the Cell Counter plug-in of ImageJ was used to count the cells in each of three images. Then, the average count was expressed as cells/mm2 considering that the surface area of each frame was 0.16 mm2. For the wide-field composite IVCM images, the surface area of the image was first measured using ImageJ. Then, the number of DCs in the entire frame was counted using Cell Counter plug-in (Fig. 1C). The DC density was then expressed as cells/mm2. All DC measurements were performed by two independent masked observers (AK and RM).
To measure subbasal nerve density, nerves were traced using NeuronJ software (available in the public domain at http://www.imagescience.org/meijering/software/neuronj/), which is a semiautomated nerve analysis plug-in of ImageJ (Fig. 1D). Nerve density was measured by tracing all visible nerve fibers in the image and calculating the total length of the nerve fibers in millimeters. The nerve density was then expressed in mm/mm2 considering the surface area of the image. For standard images, the average nerve density of the three representative IVCM images was analyzed as previously described.9 All nerve measurements were performed by two independent masked observers (AK and RM).
Statistical Analysis
Statistical analysis was performed with SPSS version 20 (SPSS, Inc., Chicago, IL, USA). First, the normal distribution of the data was tested by Shapiro-Wilk test. To compare the parameters between the standard and composite images, paired t-test was used. Furthermore, the correlations and degrees of agreement between the standard and composite images were evaluated using Pearson correlation coefficients and Bland-Altman plots, respectively. The same tests were also employed to evaluate the correlations and levels of agreement between the two masked observers. P values of less than 0.05 were considered statistically significant.
Results
The composite images were successfully reconstructed for 110 eyes of 58 patients. In six eyes, composite images were not made due to low image quality (4 eyes) or patient's lack of cooperation (2 eyes). The subjects comprised 24 healthy volunteers and 34 patients with multiple sclerosis; they included 35 females and 23 males, with a mean age of 41.3 ± 11.1 years. The mean area of the wide-field composite images was 1.29 ± 0.64 mm2 (range, 0.19–2.55 mm2), which was 7.7 ± 4.2 times that of a standard image (range, 1.2–15.9 times).
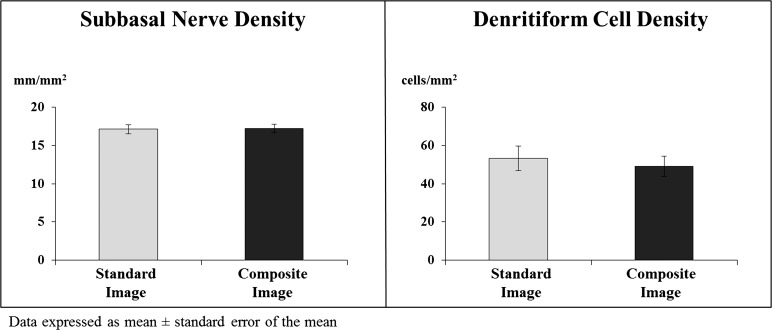
Comparison of the data between the average of three representative standard images and the wide-field composite images (Fig. 2) showed no statistically significant differences between these two in terms of mean subbasal nerve density (17.10 ± 6.10 vs. 17.17 ± 5.60 mm/mm2, respectively, P = 0.87) and mean epithelial DC density (53.2 ± 67.8 vs. 49.0 ± 54.3 cells/mm2, respectively, P = 0.43).
Figure 2.
Mean subbasal nerve and DC densities as measured in the wide-field composite images and the three-set standard images. There were no significant differences between these two methods in measuring nerve and DC densities.
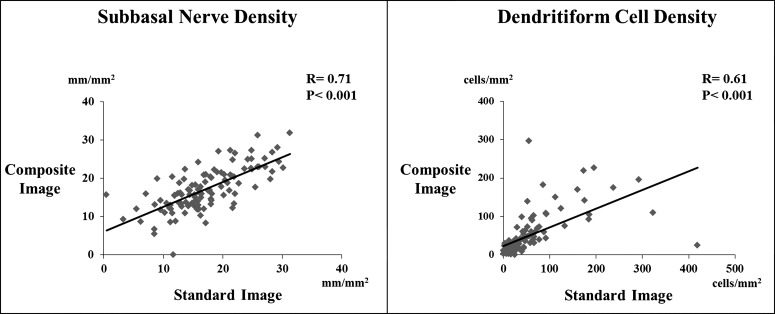
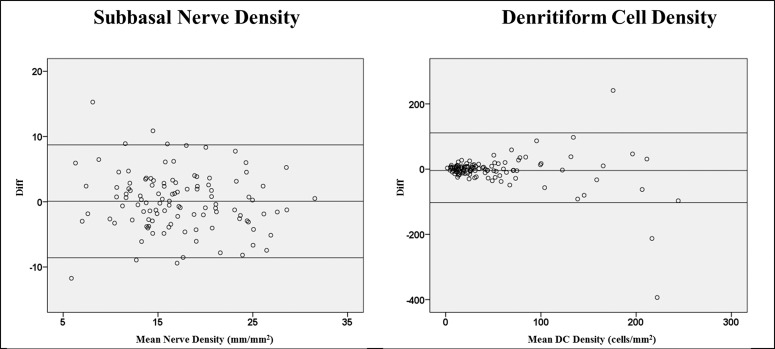
There were statistically significant correlations between the standard and composite images for subbasal nerve density (r = 0.71, P < 0.001) and DC density (r = 0.61, P < 0.001, Fig. 3). In addition, the 95% limits of agreement (LoA) obtained from Bland-Altman plots were between −8.58 mm and 8.72 mm for the standard versus composite images in measuring subbasal nerve density. For DC density, the 95% LoA for these images were −102.7 to 111.3 cells/mm2 (Fig. 4). However, the differences between the standard and composite images were more notable in eyes with very low mean subbasal nerve density or very high mean DC density. Differences of <1 standard deviation (SD), 1 to 2 SD, and >2 SD were present for 90%, 7.3%, and 2.7% of eyes for nerve density, respectively, and for 94.6%, 2.7%, and 2.7% of eyes for DC density, respectively.
Figure 3.
Correlations between the wide-field composite images and the three-set standard images in measuring the subbasal nerve and DC densities. There were significant correlations between these two methods in measuring nerve and DC densities.
Figure 4.
Bland-Altman plots comparing the subbasal nerve and DC densities between the wide-field composite images and the three-set standard images. The 95% limits of agreement (LoA) are shown with up-and-down lines, and the central line represents the mean difference between these measurements. There were significant agreements between these two methods in measuring nerve and DC densities except for those with very low nerve density or very high DC density.
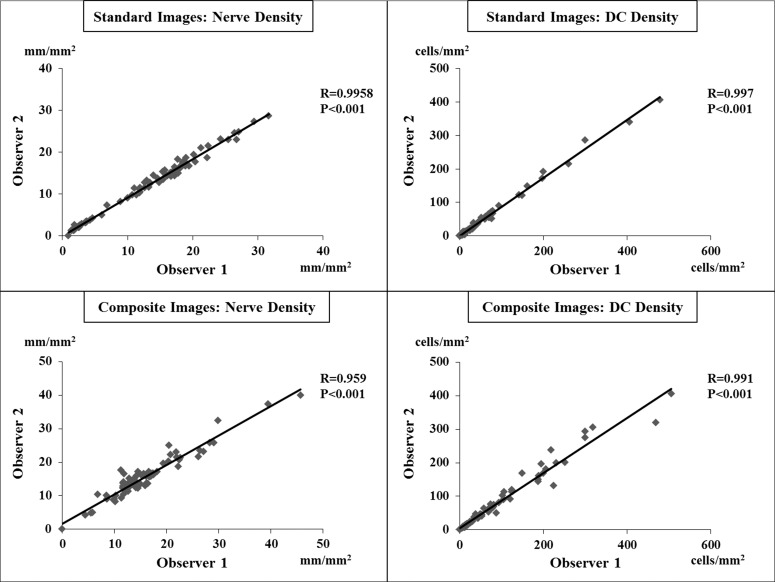
Interobserver variability analysis showed that there were significant correlations between the two observers in measuring both nerve and DC densities in the standard and composite images (Fig. 5). Intraclass correlation coefficients were 0.991 (95% confidence interval [CI] of 0.926–0.997) for nerve density in the standard images, 0.992 (95% CI of 0.983–0.996) for the DC density in the standard images, and 0.977 (95% CI of 0.964–0.986) and 0.979 (95% CI of 0.958–0.989) for the nerve and DC densities, respectively, in the wide-field composite images, with all P values < 0.001.
Figure 5.
Interobserver variability between the two observers for measuring the nerve and DC densities in the standard and composite images. There were significant correlations between the two observers in measuring these parameters.
Discussion
In the current study, there were no statistically significant differences observed in mean subbasal nerve and DC densities between the wide-field composite images and the average value of three representative standard images. Further, both methods had a high interclass correlation coefficient between two masked observers, demonstrating the high accuracy of the measurement techniques.
Although IVCM has been shown to be a valid and reliable method to measure the density of corneal cellular structures, particularly in the subbasal layer,34–37 the fact that only a small area of the cornea is imaged at a time is one of its limitations. To address this limitation, multiple images of the central subbasal layer may be chosen for analysis to represent a larger overview of the central cornea. To date, different numbers of standard images have been analyzed by various research groups.21,23,24,33 More recently, three to five images were suggested for the analysis at the Corneal Nerve Quantification consensus meeting in Rostock, Germany, March 17, 2013. However, to date it is not clear whether the nerve and DC densities in this sample number are comparable to the wide-field composite map of the subbasal area.
In our study, using a method described before,26,32 successful mapping of the wide-field composite images was performed, resulting in a mean subbasal area of 1.29 ± 0.64 mm2, which was 7.7 ± 4.2 times that of a standard image. However, the methods for wide-field composite image mapping in previously published studies require extensive image acquisition or processing times and specialized software, lack regulatory approval, or are operator dependent,25–31 all mitigating their widespread use. Thus, most clinicians and researchers are still using the standard images of IVCM, particularly in the United States where the software is not available.
Interestingly, the mean densities of subbasal nerves and DCs were not significantly different between the average values of three representative standard images and the wide-field composite images (Fig. 2). In addition, there were significant correlations between these two methods in measuring subbasal nerve and DC densities (Fig. 3). Furthermore, Bland-Altman plots revealed significant agreements between the wide-field composite images and the three-set standard images in measuring subbasal nerve and DC densities (Fig. 4). Therefore, the results show that these two methods for measuring the subbasal nerve and DC densities are comparable and support the notion that standard images may be used in lieu of composite images, resulting in very similar values.
Despite this comparability, however, under- or overestimation of subbasal nerve and DC densities still occurred in some cases as compared with the composite images (Fig. 4). In a recent study on 20 subjects with diabetes, Vagenas and colleagues38 compared the accuracy of the nerve density calculated from 2 to 15 randomly selected standard IVCM images from the central cornea to that of 16 standard images.38 They found that the average value of eight standard images would provide a mean that would be approximately within 20% of true mean of the 16-image value 80% of the time and that 5 images were within 30% of true mean of the 16-image value 95% of the time.38 Therefore, although there is a regional variation in subbasal nerve distribution,25,39 it does not hinder the use of three-set standard images for measuring the nerve density. In contrast, the higher relative variation in measuring DC density in standard images in our study may reflect a more uneven distribution of DCs across the central cornea, possibly due to regional variation in corneal immune responses. Despite this variation, the differences between the standard and composite images in terms of nerve and DC densities were less than one standard deviation in 90% or more of the eyes in our study.
As Bland-Altman plots revealed, eyes with very low nerve density or very high DC density had an increased disparity between the two methods. Therefore, although the three-set standard images may be generally sufficient, eyes with higher DC density or low nerve density may require larger sample sizes for standard images. Thus, the optimal number of the images to be analyzed, in particular for DC density for highly inflammatory conditions, may need to be determined in future studies.
We demonstrated a significant agreement between the two masked, independent observers for measuring the subbasal nerve and DC densities for both standard and composite images (Fig. 5). Although both methods showed good reproducibility, they are associated with some shortcomings. Selection of the representative images from the subbasal layer can be challenging and observer dependent. It may take around 20 to 30 minutes to choose three representative images out of 300 to 400 images from the central cornea. However, nerve tracing and cell counting can be performed easily in these standard images within few minutes. On the other hand, manual cell counting and semiautomatic tracing of corneal nerves, though accurate, are laborious for wide-field composite images, with hours of time needed to trace all nerves in one large composite image. Automated measurement of cellular structures for IVCM images, particularly for subbasal nerves, is an active area of the investigation, and recent studies have shown promising results for using such programs for future research.40–43
In conclusion, our study demonstrates that the average values obtained from three representative standard IVCM images for the subbasal nerve and DC densities are comparable to those from the wide-field mapped composite images. Therefore, these standard images can be used in clinical studies to accurately measure cellular structures in the subbasal layer.
Acknowledgments
Supported by German Research Foundation (DFG Exc. 257) (AUB), NIH R01-EY022695 (PH), Falk Medical Research Foundation (PH), Massachusetts Eye and Ear Infirmary Foundation (PH), and a Career Development Award from Research to Prevent Blindness (PH). The authors alone are responsible for the content and writing of the paper.
Disclosure: A. Kheirkhah, None; R. Muller, None; J. Mikolajczak, None; A. Ren, None; E.M. Kadas, None; H. Zimmermann, None; H. Pruess, None; F. Paul, None; A.U. Brandt, None; P. Hamrah, None
References
- 1. Lemp MA,, Dilly PN,, Boyde A. Tandem-scanning (confocal) microscopy of the full-thickness cornea. Cornea. 1985; 4: 205–209. [PubMed] [Google Scholar]
- 2. Niederer RL,, McGhee CN. Clinical in vivo confocal microscopy of the human cornea in health and disease. Prog Retin Eye Res. 2010; 29: 30–58. [DOI] [PubMed] [Google Scholar]
- 3. Patel DV,, McGhee CN. Quantitative analysis of in vivo confocal microscopy images: a review. Surv Ophthalmol. 2013; 58: 466–475. [DOI] [PubMed] [Google Scholar]
- 4. Villani E,, Baudouin C,, Efron N,, et al. In vivo confocal microscopy of the ocular surface: from bench to bedside. Curr Eye Res. 2014; 39: 213–231. [DOI] [PMC free article] [PubMed] [Google Scholar]
- 5. Mastropasqua L,, Nubile M,, Lanzini M,, et al. Epithelial dendritic cell distribution in normal and inflamed human cornea: in vivo confocal microscopy study. Am J Ophthalmol. 2006; 142: 736–744. [DOI] [PubMed] [Google Scholar]
- 6. Cruzat A,, Pavan-Langston D,, Hamrah P. In vivo confocal microscopy of corneal nerves: analysis and clinical correlation. Semin Ophthalmol. 2010; 25: 171–177. [DOI] [PMC free article] [PubMed] [Google Scholar]
- 7. Patel DV,, McGhee CN. In vivo confocal microscopy of human corneal nerves in health, in ocular and systemic disease, and following corneal surgery: a review. Br J Ophthalmol. 2009; 93: 853–860. [DOI] [PubMed] [Google Scholar]
- 8. Zhivov A,, Stave J,, Vollmar B,, Guthoff R. In vivo confocal microscopic evaluation of Langerhans cell density and distribution in the normal human corneal epithelium. Graefes Arch Clin Exp Ophthalmol. 2005; 243: 1056–1061. [DOI] [PubMed] [Google Scholar]
- 9. Cruzat A,, Witkin D,, Baniasadi N,, et al. Inflammation and the nervous system: the connection in the cornea in patients with infectious keratitis. Invest Ophthalmol Vis Sci. 2011; 52: 5136–5143. [DOI] [PMC free article] [PubMed] [Google Scholar]
- 10. Dana MR. Corneal antigen-presenting cells: diversity, plasticity, and disguise: the Cogan lecture. Invest Ophthalmol Vis Sci. 2004; 45: 722–727. [DOI] [PubMed] [Google Scholar]
- 11. Hamrah P,, Dana MR. Corneal antigen-presenting cells. Chem Immunol Allergy. 2007; 92: 58–70. [DOI] [PubMed] [Google Scholar]
- 12. Hamrah P,, Zhang Q,, Liu Y,, Dana MR. Novel characterization of MHC class II-negative population of resident corneal Langerhans cell-type dendritic cells. Invest Ophthalmol Vis Sci. 2002; 43: 639–646. [PubMed] [Google Scholar]
- 13. Hamrah P,, Dana R. Antigen-presenting cells in the eye and ocular surface. In: Dartt DA. Encyclopedia of the Eye . Vol. 1. Oxford: Academic Press; 2010: 120–127.
- 14. Marfurt CF,, Cox J,, Deek S,, Dvorscak L. Anatomy of the human corneal innervation. Exp Eye Res. 2010; 90: 478–492. [DOI] [PubMed] [Google Scholar]
- 15. Muller LJ,, Marfurt CF,, Kruse F,, Tervo TM. Corneal nerves: structure, contents and function. Exp Eye Res. 2003; 76: 521–542. [DOI] [PubMed] [Google Scholar]
- 16. Hamrah P,, Sahin A,, Dastjerdi MH,, et al. In vivo confocal microscopic changes of the corneal epithelium and stroma in patients with herpes zoster ophthalmicus. Am J Ophthalmol. 2015; 159: 1036–1044. [DOI] [PMC free article] [PubMed] [Google Scholar]
- 17. Hamrah P,, Sahin A,, Dastjerdi MH,, et al. Cellular changes of the corneal epithelium and stroma in herpes simplex keratitis: an in vivo confocal microscopy study. Ophthalmology. 2012; 119: 1791–1797. [DOI] [PMC free article] [PubMed] [Google Scholar]
- 18. Torens S,, Berger E,, Stave J,, Guthoff R. Imaging of the microarchitecture and dynamics of the break-up phenomena of the preocular tear film with the aid of laser scanning microscopy. Ophthalmologe. 2000; 97: 635–639. [DOI] [PubMed] [Google Scholar]
- 19. Tuisku IS,, Konttinen YT,, Konttinen LM,, Tervo TM. Alterations in corneal sensitivity and nerve morphology in patients with primary Sjogren's syndrome. Exp Eye Res. 2008; 86: 879–885. [DOI] [PubMed] [Google Scholar]
- 20. Malik RA,, Kallinikos P,, Abbott CA,, et al. Corneal confocal microscopy: a non-invasive surrogate of nerve fibre damage and repair in diabetic patients. Diabetologia. 2003; 46: 683–688. [DOI] [PubMed] [Google Scholar]
- 21. Hamrah P,, Cruzat A,, Dastjerdi MH,, et al. Corneal sensation and subbasal nerve alterations in patients with herpes simplex keratitis: an in vivo confocal microscopy study. Ophthalmology. 2010; 117: 1930–1936. [DOI] [PMC free article] [PubMed] [Google Scholar]
- 22. Efron N. Contact lens-induced changes in the anterior eye as observed in vivo with the confocal microscope. Prog Retin Eye Res. 2007; 26: 398–436. [DOI] [PubMed] [Google Scholar]
- 23. Kim G,, Singleton JR,, Mifflin MD,, Digre KB,, Porzio MT,, Smith AG. Assessing the reproducibility of quantitative in vivo confocal microscopy of corneal nerves in different corneal locations. Cornea. 2013; 32: 1331–1338. [DOI] [PubMed]
- 24. Pritchard N,, Edwards K,, Shahidi AM,, et al. Corneal markers of diabetic neuropathy. Ocul Surf. 2011; 9: 17–28. [DOI] [PubMed] [Google Scholar]
- 25. Patel DV,, McGhee CN. Mapping of the normal human corneal sub-Basal nerve plexus by in vivo laser scanning confocal microscopy. Invest Ophthalmol Vis Sci. 2005; 46: 4485–4488. [DOI] [PubMed] [Google Scholar]
- 26. Allgeier S,, Zhivov A,, Eberle F,, et al. Image reconstruction of the subbasal nerve plexus with in vivo confocal microscopy. Invest Ophthalmol Vis Sci. 2011; 52: 5022–5028. [DOI] [PubMed] [Google Scholar]
- 27. Zhivov A,, Blum M,, Guthoff R,, Stachs O. Real-time mapping of the subepithelial nerve plexus by in vivo confocal laser scanning microscopy. Br J Ophthalmol. 2010; 94: 1133–1135. [DOI] [PubMed] [Google Scholar]
- 28. Edwards K,, Pritchard N,, Gosschalk K,, et al. Wide-field assessment of the human corneal subbasal nerve plexus in diabetic neuropathy using a novel mapping technique. Cornea. 2012; 31: 1078–1082. [DOI] [PubMed] [Google Scholar]
- 29. Turuwhenua JT,, Patel DV,, McGhee CN. Fully automated montaging of laser scanning in vivo confocal microscopy images of the human corneal subbasal nerve plexus. Invest Ophthalmol Vis Sci. 2012; 53: 2235–2242. [DOI] [PubMed] [Google Scholar]
- 30. Efron N. The Glenn A. Fry award lecture 2010: Ophthalmic markers of diabetic neuropathy. Optom Vis Sci. 2011; 88: 661–683. [DOI] [PubMed] [Google Scholar]
- 31. Yokogawa H,, Kobayashi A,, Sugiyama K. Mapping of normal corneal K-structures by in vivo laser confocal microscopy. Cornea. 2008; 27: 879–883. [DOI] [PubMed] [Google Scholar]
- 32. Allgeier S,, Maier S,, Mikut R,, et al. Mosaicking the subbasal nerve plexus by guided eye movements. Invest Ophthalmol Vis Sci. 2014; 55: 6082–6089. [DOI] [PubMed] [Google Scholar]
- 33. Hamrah P,, Cruzat A,, Dastjerdi MH,, et al. Unilateral herpes zoster ophthalmicus results in bilateral corneal nerve alteration: an in vivo confocal microscopy study. Ophthalmology. 2013; 120: 40–47. [DOI] [PMC free article] [PubMed] [Google Scholar]
- 34. Eckard A,, Stave J,, Guthoff RF. In vivo investigations of the corneal epithelium with the confocal Rostock Laser Scanning Microscope (RLSM). Cornea. 2006; 25: 127–131. [DOI] [PubMed] [Google Scholar]
- 35. Midena E,, Cortese M,, Miotto S,, Gambato C,, Cavarzeran F,, Ghirlando A. Confocal microscopy of corneal sub-basal nerve plexus: a quantitative and qualitative analysis in healthy and pathologic eyes. J Refract Surg. 2009; 25 (1 suppl): S125–S130. [DOI] [PubMed] [Google Scholar]
- 36. Petropoulos IN,, Manzoor T,, Morgan P,, et al. Repeatability of in vivo corneal confocal microscopy to quantify corneal nerve morphology. Cornea. 2013; 32: e83–e89. [DOI] [PubMed] [Google Scholar]
- 37. Popper M,, Morgado AM,, Quadrado MJ,, Van Best JA. Corneal cell density measurement in vivo by scanning slit confocal microscopy: method and validation. Ophthalmic Res. 2004; 36: 270–276. [DOI] [PubMed] [Google Scholar]
- 38. Vagenas D,, Pritchard N,, Edwards K,, et al. Optimal image sample size for corneal nerve morphometry. Optom Vis Sci. 2012; 89: 812–817. [DOI] [PubMed] [Google Scholar]
- 39. Patel DV,, Tavakoli M,, Craig JP,, Efron N,, McGhee CN. Corneal sensitivity and slit scanning in vivo confocal microscopy of the subbasal nerve plexus of the normal central and peripheral human cornea. Cornea. 2009; 28: 735–740. [DOI] [PubMed] [Google Scholar]
- 40. Dabbah MA,, Graham J,, Petropoulos I,, Tavakoli M,, Malik RA. Dual-model automatic detection of nerve-fibres in corneal confocal microscopy images. Med Image Comput Comput Assist Interv. 2010; 13 (pt 1): 300–307. [DOI] [PMC free article] [PubMed] [Google Scholar]
- 41. Dabbah MA,, Graham J,, Petropoulos IN,, Tavakoli M,, Malik RA. Automatic analysis of diabetic peripheral neuropathy using multi-scale quantitative morphology of nerve fibres in corneal confocal microscopy imaging. Med Image Anal. 2011; 15: 738–747. [DOI] [PubMed] [Google Scholar]
- 42. Scarpa F,, Grisan E,, Ruggeri A. Automatic recognition of corneal nerve structures in images from confocal microscopy. Invest Ophthalmol Vis Sci. 2008; 49: 4801–4807. [DOI] [PubMed] [Google Scholar]
- 43. Sindt CW,, Lay B,, Bouchard H,, Kern JR. Rapid image evaluation system for corneal in vivo confocal microscopy. Cornea. 2013; 32: 460–465. [DOI] [PubMed] [Google Scholar]


