

Abstract
Background
After stroke, impairment of the upper and lower limb can limit patients’ motor function and ability to perform activities of daily living (ADL). Physiotherapy (PT) is an established clinical practice for stroke patients, playing an important role in improving limb function. Recently, several randomized trials have evaluated the effect of higher-intensity physiotherapy (increased duration and/or frequency) on patients’ functional ability.
Objectives
Our objective is to investigate whether an increased intensity of PT after stroke results in better outcomes for patients.
Data Sources
A literature search was performed on June 7, 2013, for English-language randomized controlled trials published from January 1, 2003, to June 7, 2013. Ovid MEDLINE, Ovid MEDLINE In-Process and Other Non-Indexed Citations, Ovid Embase, EBSCO Cumulative Index to Nursing & Allied Health Literature (CINAHL), and EBM Reviews were searched.
Review Methods
We reviewed the full text of articles that compared 2 or more levels of PT intensity. Outcomes of interest included motor function, ADL, and quality of life (QOL).
Results
High-quality evidence showed that higher-intensity upper-limb PT and higher-intensity lower-limb PT both resulted in significantly greater improvements in motor function. Moderate-quality evidence showed that higher-intensity general PT did not.
Moderate-quality evidence showed a significant improvement in ADL performance with higher-intensity upper-limb PT, but no improvement with higher-intensity general PT; no studies reported on ADL outcomes on lower-limb PT specifically. According to moderate-quality evidence, patient QOL did not change significantly after increased intensity of upper-limb, lower-limb, or general PT.
When considering the results, one difference should be noted: Compared with the studies examining upper- and lower-limb PT, the studies examining general PT looked at a smaller increase—2 hours or less of additional therapy per week.
Limitations
This analysis is limited to the earlier post-stroke phase and is not equipped to comment on expected outcomes of later-stage PT.
Conclusions
Overall, this analysis found support for the use of more intensive PT to improve motor function and ability to perform ADL after stroke.
PLAIN LANGUAGE SUMMARY
Physiotherapy (PT) is a standard treatment after stroke, helping to reduce patients’ impairment of motor function. In this analysis, we looked at whether patients do better if they receive more PT (either longer sessions or more frequent ones) in the early phase after stroke.
We searched the available medical literature for studies that compared at least 2 levels of PT intensity. We looked at patient outcomes in key areas including:
motor function (e.g., ability to use upper-limb muscles to manipulate objects and/or to use lower-limb muscles for walking)
ability to perform activities of daily living (such as eating, dressing, and bathing)
quality of life
Some of the studies were on patients who received upper-limb PT, some on those who received lower-limb PT, and some on those who received general PT.
As part of our process at Health Quality Ontario, we assess the quality of the evidence for each study we include in our reports. In this case, we deemed all the evidence to be of high or moderate quality.
The most consistent differences were seen in motor function. Patients who received more PT of either the upper or lower limb showed significantly greater improvements in motor function, compared with patients who received a standard amount of PT. A higher intensity of general PT did not have the same effect. However, the studies on general PT were looking at smaller increases, with ‘higher intensity’ meaning 2 hours, or less, of extra PT per week.
Evidence also showed that more PT time improved patients’ abilities to perform activities of daily living. This varied, though, depending on which tool was used to measure the results. No difference was seen in quality of life.
Overall, this analysis found support for the use of more intensive PT to improve stroke patients’ functional ability in terms of motor function and ability to perform activities of daily living.
BACKGROUND
Objective of Analysis
The objective of this analysis is to investigate whether an increased intensity of physiotherapy after stroke results in better outcomes for patients.
Clinical Need and Target Population
Stroke is a leading cause of long-term disability in older adults, consuming significant health care resources. Severe physical and/or mental impairment can result in extended hospitalizations and long-term care for stroke survivors. Any treatment that helps reduce stroke-related disability can improve stroke survivors’ independence in performing activities of daily living (ADL) and reduce the need for institutional care.
Physiotherapy plays an important role in improving functional recovery of stroke survivors and reducing inactivity-related complications. Increasing the intensity of rehabilitation after stroke may be beneficial, and the hypothesis that “more is better” has been the subject of discussion over the last decade.
Description of Disease/Condition
Most post-stroke recovery occurs in the first 30 days, but improvement may continue for 6 to 12 months. (1) Most stroke survivors are able to walk again. Friedman et al (2) found that 57% of survivors could not walk without assistance on day 7 post-stroke, but about 40% of this group achieved gait independence within 4 months. Arm function recovery, however, is slower than leg function recovery. (3) Of all the impairments that can result from stroke, perhaps the most serious and most in need of rehabilitation studies is the paretic upper limb. (4) An Australian study reported that stroke survivors viewed upper limb recovery as a critical but neglected issue, where the magnitude of their loss was poorly understood or appreciated. (5) The upper limbs are of special concern because their impact on ADLs are so marked.
It is important to understand the distinction between restoration of function and compensation in a patient's performance of ADLs. Although these two may parallel each other in the earlier days after stroke, ADL performance may continue to improve when no further restoration of function can be seen. This suggests that behavioural adaptation (i.e., compensation) plays a role in the performance of ADLs. (1) For example, people with right-arm paresis may compensate for loss of functionality by learning to perform ADLs with their left arm. (1)
Recovery of arm movement is generally believed to occur to a lesser extent than recovery of leg movement. However, this clinical observation is often based on measures of disability rather than on tests of specific motor impairment of the upper and lower extremities. Even with major impairment, disability in the lower extremities may be limited. Function in the upper extremities, however, requires finer motor control. This results in less disparity between impairment and disability. (1)
Prevalence and Incidence
About 50,000 strokes occur each year in Canada. (6) According to the Public Health Agency of Canada, (7) about 315,000 (1.1%) of Canadians living in the community (i.e., outside of institutions) reported living with the effects of stroke.
In 2005/2006, 41.7% of patients hospitalized for stroke were discharged home, 39.5% were transferred to another facility, and 18.3% died in hospital. (7)
Global Prevalence and Incidence
Each year, about 795,000 people in the United States have a stroke. About 610,000 of these are first attacks and about 185,000 are recurrent attacks. (8)
In Europe, the incidence rate of stroke was 182 per 100,000 (200 per 100,000 for men and 170 per 100,000 for women). (9) The overall fatality rates at 28 days, 3 months, and 1 year were 19.4 %, 28.5 %, and 37.3 % respectively. This incidence rate was similar to those reported from other population-based studies in western industrialized countries. (9)
EVIDENCE-BASED ANALYSIS
Research Questions
For the purpose of this review, intensity of physiotherapy (PT) was defined as the time spent in exercise training (for the entire period, and for each week). Groups of survivors receiving more-intensive and less-intensive PT were compared, with the following questions examined:
Does higher-intensity PT result in greater improvement in motor function after stroke? If yes, is there a dose-response relationship?
Does higher-intensity PT result in a greater improvement in patients’ performance of activities of daily living (ADLs)?
Does higher-intensity PT result in a greater improvement in quality of life?
Does higher-intensity PT shorten the length of stay in rehabilitation facilities?
Does higher-intensity PT result in any adverse events?
In this review, ‘higher-intensity’ and ‘increased intensity’ of PT are synonymous with more PT, i.e., extended duration or frequency of PT sessions.
Research Methods
Literature Search
Search Strategy
A literature search was performed on June 7, 2013, using Ovid MEDLINE, Ovid MEDLINE In-Process and Other Non-Indexed Citations, Ovid Embase, EBSCO Cumulative Index to Nursing & Allied Health Literature (CINAHL), and EBM Reviews, for studies published from January 1, 2003, to June 7, 2013. (Appendix 1 provides details of the search strategies.) Abstracts were reviewed by a single reviewer and, for those studies meeting the eligibility criteria, full-text articles were obtained. Reference lists were also examined for any additional relevant studies not identified through the search.
Inclusion Criteria
English-language full-text publications
published between January 1, 2003, and June 7, 2013
randomized controlled trials (RCTs)
studies on stroke survivors
studies comparing 2 or more levels of intensity of PT
Exclusion Criteria
studies in which patients in different study arms received the same amount of therapy
studies that compared 1 dose of therapy with no treatment
studies that did not report the frequency and duration of PT
studies that included patients with other neurological conditions
studies in which therapy involved using drugs to enhance the effect of PT
studies on constraint-induced movement therapy
studies that used robot-assisted repetitive transcranial magnetic stimulation (rTMS), neuromuscular electrical stimulation, virtual reality, or computerized training
studies with sample size < 30 patients
Outcomes of Interest
motor function
ADL
quality of life
length of stay in rehabilitation facility
adverse events
Statistical Analysis
Intensive PT was defined as the extra time spent in therapy. We compared the intensive (experimental) group, who spent more time in PT, against the control (conventional) group.
We calculated the difference in PT time, in hours, from the reported total duration of therapy and from the reported duration of therapy per week.
Since the interventions performed in the identified studies were not necessarily comparable, and since the outcomes they measured differed, we categorized the RCTs by 3 types of PT:
PT of upper limb
PT of lower limb
general PT
We analyzed the 3 types separately.
For meta-analyses of various outcomes and graphical presentation of data, we used Review Manager 5.1. (10) Data were analyzed by pooling the effect sizes. These were calculated as weighted mean differences and corresponding 95% confidence intervals (CIs) for continuous outcomes, using a fixed effects model. Where combining of data was not possible, this review included the statistical results of individual studies.
Quality of Evidence
The quality of the body of evidence for each outcome was examined according to the Grading of Recommendations Assessment, Development, and Evaluation (GRADE) Working Group criteria. (11) The overall quality was determined to be high, moderate, low, or very low using a step-wise, structural methodology.
Study design was the first consideration; the starting assumption was that RCTs are high quality, whereas observational studies are low quality. Five additional factors—risk of bias, inconsistency, indirectness, imprecision, and publication bias—were then taken into account. Any limitations in these areas resulted in downgrading the quality of evidence. Finally, 3 main factors that may raise the quality of evidence were considered: large magnitude of effect, dose response gradient, and accounting for all residual confounding factors. (11) For more detailed information, please refer to the latest series of GRADE articles. (11)
As stated by the GRADE Working Group, the final quality score can be interpreted using the following definitions:
| High | High confidence in the effect estimate—the true effect lies close to the estimate of the effect |
| Moderate | Moderate confidence in the effect estimate—the true effect is likely to be close to the estimate of the effect, but may be substantially different |
| Low | Low confidence in the effect estimate—the true effect may be substantially different from the estimate of the effect |
| Very Low | Very low confidence in the effect estimate—the true effect is likely to be substantially different from the estimate of the effect |
Results of Evidence-Based Analysis
The database search yielded 1,250 citations published between January 1, 2003, and June 7, 2013 (with duplicates removed). Articles were excluded based on information in the title and abstract. The full texts of potentially relevant articles were obtained for further assessment. Figure 1 shows the breakdown of when and for what reason citations were excluded from the analysis.
Figure 1: Citation Flow Chart.

Eight studies met the inclusion criteria. The reference lists of the included studies were hand-searched to identify other relevant studies, and no additional citation was identified.
For each included study, the study design was identified and is summarized below in Table 1, a modified version of a hierarchy of study design by Goodman. (12)
Table 1:
Body of Evidence Examined According to Study Design
| Study Design | Number of Eligible Studies |
|---|---|
| RCTs | |
| Systematic review of RCTs | |
| Large RCT | |
| Small RCT | 8 |
| Observational Studies | |
| Systematic review of non-RCTs with contemporaneous controls | |
| Non-RCT with non-contemporaneous controls | |
| Systematic review of non-RCTs with historical controls | |
| Non-RCT with historical controls | |
| Database, registry, or cross-sectional study | |
| Case series | |
| Retrospective review, modelling | |
| Studies presented at an international conference | |
| Expert opinion | |
| Total | 8 |
Abbreviation: RCT, randomized controlled trial.
Four studies focused on the effectiveness of PT in restoring upper-limb function, (13–16) 1 study (17) on the effectiveness of PT in restoring lower-limb function, and 3 studies (18–20) on the effectiveness of general PT.
Effects of Higher-Intensity Physiotherapy on Motor Function
To evaluate the effects of higher-intensity PT on motor function, the 2 most commonly reported outcomes or 2 main motor-related outcomes were considered for evaluation.
Changes in Motor Function After Physiotherapy of the Upper Limb
The 4 studies (13–16) that examined the effectiveness of higher-intensity PT in restoring upper-limb function are described in Table 2. The quality of evidence was considered high (see Appendix 2).
Table 2:
Randomized Controlled Trials on Physiotherapy of Upper Limb After Stroke
| Study | Sample Size | Study Arms | Mean Age (SD), years | Mean Time (SD) Since Stroke,a days | Duration of Exercise, weeks | Time, hours | Outcome Measures | ||
|---|---|---|---|---|---|---|---|---|---|
| Total | Weekly | ||||||||
| Han et al, 2013 (13) | 32 | A: | Arm training 1 hour/day, 5 days/week | 52.4 (12.47) | 41.4 (18.82) | 6 | 30 | 5 | FMA ARAT |
| B: | Arm training 2 hours/day, 5 days/week | 53.7 (11.13) | 42.9 (37.68) | 6 | 60 | 10 | BI | ||
| C: | Arm training 3 hours/day, 5 days/week | 44.6 (12.87) | 38.3 (20.96) | 6 | 90 | 15 | |||
| Hunter et al, 2011 (14) | 76 | A: | PT: NR | 71.6 (14.2) | 29.4 (15.2) | 2 | NR | NR | MI arm section |
| B: | PT plus MTSb 23 min/day | 73.3 (7.3) | 35.6 (23.6) | 2 | 5.4 | 2.7 | ARAT | ||
| C: | PT plus MTS 37 min/day | 72.9 (7.9) | 25.7 (16.4) | 2 | 8.7 | 4.35 | |||
| D: | PT plus MTS 66 min/day | 72.5 (15.3) | 28.3 (19.5) | 2 | 15.4 | 7.7 | |||
| Harris et al, 2009 (15) | 103 | A: | PT 8 hours/week plus education | 69.3 (15.3) | 20.8 (7.0) | 4 | 32 | 8 | CAHAI ARAT |
| B: | PT 8 hours/week plus self-administered GRASP for 7 hours/week | 69.4 (11.7) | 20.5 (7.1) | 4 | 60 | 15 | MAL Isometric strength SF-12 Pain and fatigue | ||
| Donaldson et al, 2009 (16) | 30 | A: | PT for a mean of 2.8 hours/6 weeks | 72.6 (15) | 13.4 (4.4) | 6 | 2.8 | 0.47 | ARAT Nine-hole peg test |
| B: | PT for a mean of 13.8 hours/6 weeks | 73.3 (8.6) | 25.6 (15.5) | 6 | 13.8 | 2.3 | Upper limb strength | ||
| C: | PT + FST for a mean of 17.7 hours/6 weeks | 2.6 (12.5) | 21.7 (16.8) | 6 | 17.7 | 3 | |||
Abbreviations: ARAT, Action Research Arm Test; BI, Barthel Index; CAHAI, Chedoke Arm and Hand Activity Inventory; FMA, Fugl-Meyer Assessment; FST, functional strength training; GRASP, Graded Repetitive Arm Supplementary Program; MAL, Motor Activity Log-14; MI, Motricity Index; min, minutes; MTS, mobilization and tactile stimulation; NR, not reported; PT, physiotherapy; RCT, randomized controlled trial; SF-12 Short Form health survey.
For the Han et al study, this means days from stroke to randomization; for the Harris et al study it means days from stroke to study start day; for the other 2 studies no explanation was provided.
MTS (mobilization and tactile stimulation) is a form of physiotherapy.
Since the ARAT (Action Research Arm Test) was the most commonly reported outcome measure of motor function in the studies on the upper limb, we focused on changes in ARAT scores in our analysis.
As shown in Table 2, patients in the Han et al study (13) were younger than those in the other studies, and their mean time since stroke was longer. We placed the 4 RCTs in order by the differences in PT time between their study arms. The arms of the Han et al (13) study differed the most in PT time. This study found that higher-intensity PT results in a greater improvement in ARAT scores at 6 weeks. The effect sizes for difference in ARAT scores between baseline and 6 weeks for 30, 60, and 90 hours of PT were 4.50 (95% confidence interval [CI], 2.38–6.62), 7.20 (95% CI, 4.17–10.23), and 9.80 (95% CI, 7.49–12.11), respectively (see Figure 2).
Figure 2: Changes in ARAT Scores After 6 Weeks of Physiotherapy.

Abbreviations: ARAT, Action Research Arm Test; CI, confidence interval; IV, inverse variance.
Source: Han et al, 2013. (13)
While an additional 30 hours of PT over 6 weeks did not result in a significant difference in ARAT scores, an additional 60 hours did (i.e., an additional 2 hours a day/10 hours a week, for a total of 90 hours versus 30 hours). This more intensive therapy resulted in a significant difference between arms a and c of the study as early as 2 weeks after therapy began. The mean differences between the 2 arms at 2, 4, and 6 weeks were 2.70 (95% CI, 0.33–5.07; P = 0.03), 4.00 (95% CI, 1.55–6.45; P = 0.001), and 5.60 (95% CI, 2.67–8.53; P = 0.002), respectively (see Figure 3).
Figure 3: Comparison of ARAT Scores at Different Time Points According to Difference in Physiotherapy Time.

Abbreviations: ARAT, Action Research Arm Test; CI, confidence interval; IV, inverse variance.
Source: Han et al, 2013. (13)
Han et al found that a larger increase in PT time also resulted in higher Fugl-Meyer Assessment (FMA) scores. At 6 weeks the mean difference in effect of 5 additional hours of PT per week (15 hours, versus 10) on FMA scores was not significant (4.8 [95% CI, −1.64 to 11.24; P = 0.14]). However, the effect was statistically significant for the difference of 10 hours a week (15 hours, versus 5) (11.5 [5.47–17.53; P = 0.0002]).
The 2 arms of the study by Harris et al (15) had a difference in PT time of 28 hours over a 4–week period (7 hours per week), which also resulted in significantly higher ARAT scores in the group who received the more intensive PT. The mean difference in effect was 4.80 (95% CI, 4.73–4.87; P < 0.00001).
In the Hunter et al (14) study, where exercise was focused on forearms and hands, an additional 3.4 hours of PT time over 2 weeks (total of 8.7 hours, versus 5.4) did not result in a significant difference in ARAT scores. However, a difference of 6.7 hours over 2 weeks (total of 15.4 hours, versus 8.7) and 10 hours over 2 weeks (total of 15.4 hours, versus 5.4) did result in a significant difference. Mean difference in ARAT scores: 3.20 (95% CI, 2.62–3.78; P < 0.0001) for difference of 6.7 hours, and 3.0 (95% CI, 2.50–3.50; P < 0.001) for difference of 10 hours. See Figure 4.
Figure 4: Comparison of ARAT Scores After 14 Days of Forearm and Hand Training.

Abbreviations: ARAT, Action Research Arm Test; CI, confidence interval; IV, inverse variance.
Hunter et al, 2011 (14)
The study by Donaldson et al (16), in which the difference in PT time was less than in the other studies (11 hours over a 6–week period), did not show any significant difference between the arms of the study.
Changes in Motor Function After Physiotherapy of the Lower Limb
In the one RCT that looked at the effectiveness of PT in restoring lower-limb function, Cooke et al (17) randomly allocated patients into 3 groups: PT for about 1.5 hours per week, PT for about 4 hours per week, and functional strength training (FST) for about 4 hours per week, each for 6 weeks. Since FST is a different intervention, this evidence-based analysis compared only the 2 groups who received PT. The RCT by Cooke et al is described in Table 3. The quality of evidence was considered high (see Appendix 2).
Table 3:
Randomized Controlled Trial on Physiotherapy of Lower Limb After Stroke
| Study | Sample Size | Study Arms | Mean Age (SD), years | Mean Time (SD) Since Stroke, days | Duration of Exercise, weeks | Time, hours | Outcome Measures | ||
|---|---|---|---|---|---|---|---|---|---|
| Total | Weekly | ||||||||
| Cooke et al, 2010 (17) | 109 | A: | PT | 66.37 (13.7) | 36.76 (22.41) | 6 | 9.2 | 1.5 | Walking speed Ability to walk at 0.8 m/s or more |
| B: | PT + PT 1 hour per day, 4 days per week | 67.46 (11.3) | 36.76 (22.41) | 6 | 23.0 | 3.8 | Modified RMI Torque of paretic knee | ||
| C: | PT + FST 1 hour per day, 4 days per week | 71.17 (10.6) | 33.86 (16.50) | 6 | 23.5 | 3.9 | Symmetry step time and length EuroQol-5D | ||
Abbreviations: FST, functional strength training; m/s, metres per second; PT, physiotherapy; RMI, Rivermead Mobility Index; SD, standard deviation.
The results showed that an additional 2.5 hours of PT per week for 6 weeks significantly improved walking speed measures. The mean difference in walking speed was 0.25 m/s (95% CI, 0.05–0.45; P = 0.01). However, the control group also improved over time. At 12 weeks, the mean difference between the 2 groups was no longer statistically significant (0.15 m/s (95% CI, −0.05 to 0.15; P = 0.14). See Figure 5.
Figure 5: Comparison of Walking-Speed Scores After 6 Weeks of Lower-Limb Physiotherapy.

Abbreviations: CI, confidence interval; IV, inverse variance; SD, standard deviation.
Source: Cooke et al, 2010 (17)
Cooke et al (17) found that a higher proportion of the patients who received more intensive PT (35%) were able to walk at 0.8 m/s or faster at 6 weeks compared with only 13% of the patients who received less intensive PT (P = 0.038). However, there was no significant difference between the 2 groups at 12 weeks (37% versus 17%, P = 0.14).
Neither walking performance measures (symmetry step time and length) nor functional mobility measures (modified Rivermead Mobility Index) showed significant differences at 6 or 12 weeks.
Changes in Motor Function After General Physiotherapy
Three RCTs assessed general PT for stroke survivors, including its effect on upper- and lower-limb functional recovery. (18–20) Two of these studies included patients in the acute phase of stroke. (18;20) The study by Di Lauro et al (20) did not report on changes in motor function but on changes in Barthel Index. The 3 RCTs are described in Table 4. The quality of evidence was considered moderate (see Appendix 2).
Table 4:
Randomized Controlled Trials on General Physiotherapy After Stroke
| Study | Sample Size | Study Arms | Mean Age (SD), years | Mean Time (SD) Since Stroke, days | Duration of Exercise, weeks | Time, hours | Outcome Measures | ||
|---|---|---|---|---|---|---|---|---|---|
| Total | Weekly | ||||||||
| Askim et al, 2010 (18) | 62 | A: | 30 min PT 2 times a day, 5 days/week for 4 weeks | 77.6 (9.6) | 4–14 | 4 | 20 | 5 | BBS MAS |
| B: | 3 additional sessions of motor training (intended to last 30–50 minutes) per week (bringing total therapy to about 28 hours) and 1 additional session every week for the next 8 weeks | 75.4 (7.9) | 12 (4 + 8) | 33 (28 + 5) | 7 | 5MWT Step test BI SIS | |||
| Glasgow Augmented Physiotherapy Study (GAPS), 2004 (19) | 70 | A: | Conventional inpatient stroke services including PT 30–40 minutes per day, 5 days/week (total of 21 hours: 5 hours upper limb, 5 hours lower limb, 11 hours other work) | 67 (10) | 25 (6–71) | 6.6 | 21 | 3.2 | RMI Motricity Index Mobility milestones (10–metre WT, standing, 10 paces) |
| B: | Conventional inpatient stroke services plus PT 60–80 minutes per week (bringing total to 34 hours: 10 hours upper limb, 9 hours lower limb, 15 hours other work) | 68 (11) | 7.2 | 34 | 4.7 | BI Nottingham Extended ADL Index score EuroQuol LOS | |||
| Di Lauro et al, 2003 (20) | 60 | A: | Rehabilitation 45 minutes per day for 2 weeks | 67.6 (9.3) | < 14 | 2 | 10.5 | 5.25 | Modified NIHSS BI |
| B: | Rehabilitation 2 hours per day (morning and afternoon) for 2 weeks | 69.3 (8) | 2 | 28 | 14 | ||||
Abbreviations: 5MWT, 5–metre walk test; ADL, activities of daily living; BBS, Berg Balance Scale; BI, Barthel Index; LOS, length of stay (in rehabilitation facility); MAS, Motor Assessment Scale; NIHSS, National Institutes of Health Stroke Scale; PT, physiotherapy; RMI, Rivermead Mobility Index; SD, standard deviation; SIS, Stroke Impact Scale; WT, walking test.
In the Askim et al (18) study, where the difference in PT time was 2 hours per week for 4 weeks, outcome measures (Berg Balance Scale, Motor Assessment Scale, 5-metre walk test, step test, and Stroke Impact Scale) at 4, 12, and 26 weeks showed no significant differences.
Similarly, the difference in PT time of 1.5 hours per week for about 7 weeks in the Glasgow Augmented Physiotherapy Study (GAPS) (19) did not result in a significant difference in Rivermead Mobility Index scores, Motricity Index scores, and mobility milestones (standing, 10 paces, 10–metre walk test) at 4 weeks, 3 months, or 6 months.
The study by Di Lauro et al (20) did not report on changes in motor function. In this study, there was a difference of 9 hours of PT time per week for 2 weeks. The groups at 2 weeks and 6 months did not show any significant difference in neurological damage scores (modified National Institutes of Health Stroke Scale).
Effects of Higher-Intensity Physiotherapy on Activities of Daily Living
Changes in ADL After Physiotherapy of the Upper Limb
Two RCTs reported on the effect of upper-limb PT on activities of daily living (ADLs). Han et al (13) used the Barthel Index (BI) and Harris et al (15) used the Chedoke Arm and Hand Activity Inventory (CAHAI) as ADL measures. In each study, the group who received more intensive therapy had higher ADL scores at 4 weeks than the group who received conventional therapy. However, in the Han et al study, (13) the difference in scores was not statistically significant (see Figure 6). The quality of evidence in both RCTs was considered moderate (see Appendix 2).
Figure 6: Comparison of ADL Scores After Upper-Limb Physiotherapy, Using Barthel Index.

Abbreviations: ADL, activities of daily living; CI, confidence interval; IV, inverse variance; SD, standard deviation.
Source: Han et al, 2013. (13)
Harris et al, (15) using CAHAI to measure ADL related to the use of upper arm, observed a significant difference between the 2 study groups at 4 weeks (mean difference in scores, 6.60 (95% CI, 6.55–6.65; P < 0.0000) (see Figure 7). Patients in 1 group received PT for 8 hours per week, plus education; patients in the other group received PT for 8 hours per week, plus 7 hours a week of self-administered Graded Repetitive Arm Supplementary Program (GRASP).
Figure 7: Comparison of ADL Scores After Upper-Limb Physiotherapy, Using CAHAI.
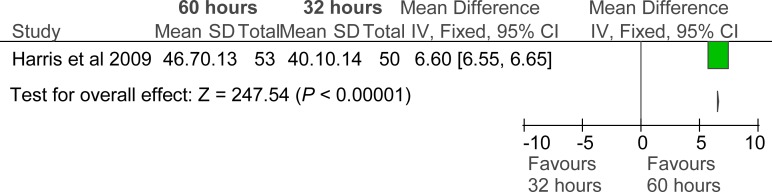
Abbreviations: ADL, activities of daily living; CAHAI, Chedoke Arm and Hand Activity Indicator; CI, confidence interval; IV, inverse variance; SD, standard deviation.
Source: Harris et al. (15)
Harris et al (15) also reported on the Motor Activity Log, which measures use of paretic upper limbs in performing ADL. This showed significant differences between the 2 groups of study participants, with intensive training improving people's scores for both amount of use and quality of movement. The mean difference for amount of use was 0.40 (95% CI, 0.38–0.42; P < 0.0000). The mean difference for quality of movement was 0.30 (95% CI, 0.28–0.32; P < 0.0000).
Changes in ADL After Physiotherapy of the Lower Limb
The RCT on lower-limb PT did not report on ADL.
Changes in ADL After General Physiotherapy
Three studies reported on ADL after general PT, using the BI as a measure. (18–20) Their results showed no significant differences between the group who received higher-intensity PT and the group who received conventional PT (see Figure 8). The quality of evidence was considered moderate (see Appendix 2).
Figure 8: Comparison of ADL Scores After General Physiotherapy, Using Barthel Index.

Abbreviations: ADL, activities of daily living; CI, confidence interval; GAPS, Glasgow Augmented Physiotherapy Study; IV, inverse variance; SD, standard deviation.
Sources: Askim et al, 2010 (18); GAPS, 2004 (19); Di Lauro et al, 2003. (20)
The GAPS (19) also assessed ADL using the Nottingham Extended ADL Index. On this index, patients who received a higher intensity of general PT had better scores at 3 months. This finding was not statistically significant, but the P value was close to the significance level. See Figure 9.
Figure 9: Comparison of ADL Scores After General Physiotherapy, Using Nottingham Extended ADL Index.
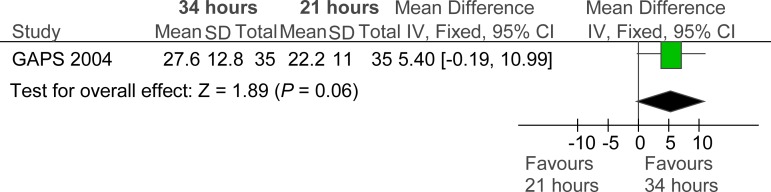
Abbreviations: ADL, activities of daily living; CI, confidence interval; GAPS, Glasgow Augmented Physiotherapy Study; IV, inverse variance; SD, standard deviation.
Source: GAPS, 2004. (19)
Effects of Higher-Intensity Physiotherapy on Quality of Life
Three RCTs reported on stroke survivors’ quality of life (QOL) after PT. The quality of evidence was considered moderate.
Harris et al (15) used the Short Form 12-item measure (SF-12) to determine the QOL of patients who received PT for the upper limb. This study found no differences in QOL between groups who received more intensive and less intensive PT.
Cooke et al (17) used the EuroQol 5–dimension (EQ-5D) instrument to measure the QOL of patients who received PT for the lower limb. This study also found no significant differences in QOL between the higher-intensity and conventional PT groups.
In the GAPS study, (19) EQ-5D scores at 6 months were higher for the higher-intensity group than for the conventional PT group, but the difference did not quite reach statistical significance. See Figure 10.
Figure 10: Comparison of Quality of Life Scores After General Physiotherapy.
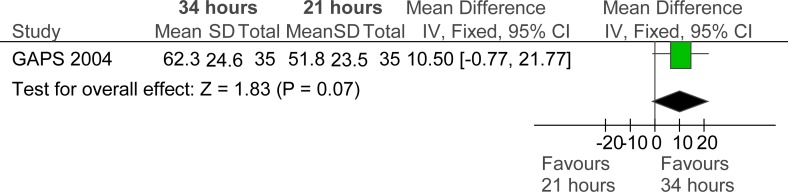
Abbreviations: CI, confidence interval; GAPS, Glasgow Augmented Physiotherapy Study; IV, inverse variance; SD, standard deviation.
Source: GAPS, 2004. (19)
Effects of Higher-Intensity Physiotherapy on Length of Stay
Only 1 RCT reported on the length of stay in a rehabilitation facility. (19) The GAPS study found that the mean length of stay was shorter for the higher-intensity group (45 days [range, 4–123]) than for the lower intensity group (54 days [range, 8–180]) but the difference was not statistically significant (P = 0.29). (19) The quality of evidence was considered moderate.
Adverse Events Associated with Higher-Intensity Physiotherapy
Two RCTs investigating higher-intensity PT of the upper limb reported on whether it might be associated with adverse events (14;15) and 2 RCTs investigating higher-intensity general PT (18;19) reported on whether it might be associated with adverse events. No adverse events were observed in any of the trials.
Summary of Evidence
A summary of outcomes is shown in Table 5.
Table 5:
Effectiveness of Higher-Intensity PT in Improving Motor Function, ADL, QOL, and LOS
| Outcome | Study/Time (Outcome Measure) | Mean Difference | P Value |
|---|---|---|---|
| Difference in PT Time: 3.4–10 Hours/Week | |||
| Motor Function | Han et al, 2013 (13) (6 weeks PT) | ||
| Difference: 10 hours/week (90 vs. 30 hours) | |||
| At 2 weeks (ARAT) | 2.70 (0.33 to 5.07) | 0.03 | |
| At 4 weeks (ARAT) | 4.00 (1.55 to 6.45) | 0.001 | |
| At 6 weeks (ARAT | 5.60 (2.67 to 8.53) | 0.0002 | |
| Difference: 5 hours/week (90 vs. 60 hours) | |||
| At 2 weeks (ARAT) | 1.10 (−1.79 to 3.99) | 0.46 | |
| At 4 weeks (ARAT) | 2.70 (−0.04 to 5.44) | 0.05 | |
| At 6 weeks (ARAT) | 2.20 (−1.37 to 5.77) | 0.23 | |
| Harris et al, 2009 (15) (4 weeks PT) | |||
| Difference: 7 hours/week (60 vs. 32 hours) | |||
| At 4 weeks (ARAT) | 4.80 (4.73 to 4.87) | < 0.00001 | |
| Hunter et al, 2011 (14) (2 weeks PT) | |||
| At 2 weeks (ARAT) | |||
| Difference: 5 hours/week (15.4 vs. 5.4 hours) | 3.00 (2.50 to 3.50) | < 0.00001 | |
| Difference: 3.4 hours/week (15.4 vs. 8.7 hours) | 3.20 (2.62 to 3.78) | < 0.00001 | |
| ADL | Han et al, 2013 (13) (6 weeks PT) | ||
| Difference: 10 hours/week 990 vs. 30 hours) | |||
| At 4 weeks (Barthel Index) | 10.0 (−3.69 to 23.69) | 0.15 | |
| At 6 weeks (Barthel Index) | 4.50 (−3.56 to 12.56) | 0.27 | |
| Difference: 5 hours/week (90 vs. 60 hours) | |||
| At 4 weeks (Barthel Index) | 8.00 (−6.93 to 22.93) | 0.29 | |
| At 6 weeks (Barthel Index) | 3.00 (−6.46 to 12.46) | 0.53 | |
| Harris et al, 2009 (15) (4 weeks PT) | |||
| Difference: 7 hours/week (60 vs. 32 hours) | |||
| At 4 weeks (CAHAI) | 6.60 (6.55 to 6.65) | < 0.00001 | |
| At 4 weeks (MAL, amount of use) | 0.40 (0.38 to 0.42) | < 0.00001 | |
| At 4 weeks (MAL, quality of movement) | 0.30 (0.28 to 0.32) | < 0.00001 | |
| Di Lauro et al, 2003 (20) (2 weeks PT) | |||
| Difference: 9 hours/week (28 vs. 10.5 hours) | |||
| At 2 weeks (Barthel Index) | 0.00 (−1.17 to 1.17) | 1.0 | |
| At 6 months (Barthel Index) | 0.30 (−1.17 to 1.77) | 0.69 | |
| QOL | Harris et al, 2009 (15) (4 weeks PT) | ||
| Difference: 7 hours/week (60 vs. 32 hours) | |||
| At 4 weeks (SF-12) | NR | NS | |
| Difference in PT Time: ≤ 2.3 Hours/Week | |||
| Motor Function | Hunter et al, 2011 (14) (2 weeks PT) | ||
| At 2 weeks (ARAT) | |||
| Difference: 1.7 hours per week (8.7 vs. 5.4 hours) | –0.20 (–0.66 to 0.26) | 0.39 | |
| Donaldson et al, 2009 (16) (6 weeks PT) | |||
| Difference: 1.8 hours/week (13.8 vs. 2.81 hours) | |||
| At 6 weeks (ARAT) | –3.20 (–17.22 to 10.82) | 0.65 | |
| Cooke et al, 2010 (17) (6 weeks PT) | |||
| Difference: 2.3 hours/week (23 vs. 9.2 hours) | |||
| At 6 weeks (walking speed) | 0.25 (0.05 to 0.45) | 0.01 | |
| At 12 weeks (walking speed) | 0.15 (–0.05 to 0.35) | 0.14 | |
| Askim et al, 2010 (18) (4 weeks PT) | |||
| Difference: 2 hours/week (28–20 hours) | |||
| At 4 weeks (MAS) | 2.10 (–2.86 to 7.06) | 0.41 | |
| GAPS, 2004 (19) (7 weeks PT) | |||
| Difference: 1.5 hours/week (34 vs. 21 hours) | |||
| At 4 weeks (RMI) | 0.40 (–1.19 to 1.99) | 0.62 | |
| At 3 months (RMI) | 1.60 (–0.02 to 3.22) | 0.05 | |
| At 6 months (RMI) | 1.10 (–0.58 to 2.78) | 0.20 | |
| ADL | Askim et al, 2010 (18) (4 weeks PT) | ||
| Difference: 2 hours/week (28 vs. 20 hours) | |||
| At 4 weeks (Barthel Index) | 88.00 vs. 86.30 | NS | |
| At 12 weeks (Barthel Index) | 92.00 vs. 91.00 | NS | |
| At 6 months (Barthel Index) | 92.50 vs. 91.40 | NS | |
| GAPS, 2004 (19) (7 weeks PT) | |||
| Difference: 1.5 hours/week (34 vs. 21 hours) | |||
| At 4 weeks (Barthel Index) | 0.50 (–1.16 to 2.16) | 0.56 | |
| At 3 months (Barthel Index) | 0.50 (–0.93 to 1.93) | 0.49 | |
| At 6 months (Barthel Index) | 0.70 (–0.95 to 2.35) | 0.41 | |
| QOL | GAPS, 2004 (19) (7 weeks PT) | ||
| Difference: 1.5 hours/week (34 vs. 21 hours) | |||
| At 6 months (EuroQol) | 10.50 (–0.77 to 21.77) | 0.07 | |
| Cooke et al, 2010 (17) (6 weeks PT) | |||
| Difference: 2.3 hours/week (23 vs. 9.2 hours) | |||
| At 6 weeks (EuroQol) | 5.20 (–3.73 to 14.13) | 0.25 | |
| LOS | GAPS, 2004 (19) (7 weeks PT) | Mean (range, days) | |
| Difference: 1.5 hours/week (34 vs. 21 hours) | |||
| N/A | 45 (4 to 123) vs. 54 (8 to 18) | NS | |
Abbreviations: ADL, activities of daily living; ARAT, Action Research Arm Test; CAHAI, Chedoke Arm and Hand Activity Inventory; GAPS, Glasgow Augmented Physiotherapy Study; LOS, length of stay; MAL, Motor Activity Log; MAS, Motor Assessment Scale; N/A, not applicable; NS, not significant; PT, physiotherapy; QOL, quality of life; RMI, Rivermead Mobility Index; SF-12, Short Form 12 item.
Conclusions
Upper-Limb Physiotherapy
Higher-intensity physiotherapy (PT) of the upper limb, provided by adding an extra 5 to 10 hours of PT per week, resulted in a positive effect on motor function that showed a dose–response relationship between amount of PT and positive effect. (13)
Results for the effect on activities of daily living (ADL) were mixed. When the Chedoke Arm and Hand Activity Inventory (CAHAI) and the Motor Activity Log (MAL) were used to evaluate changes in activities of ADL, there were significant results in favour of higher-intensity PT of the upper limb. (15) However, Barthel Index (BI) scores showed that ADL were not significantly affected by higher-intensity PT of the upper limb. (13;20)
No difference was found between the higher-intensity and conventional PT groups with respect to quality of life (QOL), using Short Form 12–item (SF-12) to measure the effect of increasing upper-limb physiotherapy. (15)
Studies investigating whether a higher intensity of upper-limb PT might be associated with adverse events found no adverse events occurring in the trials. (14;15)
None of the included studies compared the effects of higher-intensity versus conventional upper-limb PT on length of stay (LOS) in a rehabilitation facility.
Lower-Limb Physiotherapy
Higher-intensity PT of the lower limb, provided by adding an extra 2.5 hours per week, resulted in a significantly greater improvement in motor function (e.g., walking speed and knee flexion peak). However, it did not result in improvement in QOL. (17)
None of the studies included in this report compared the effects of higher-intensity versus conventional lower-limb PT on ADL or LOS; nor did they report on adverse events.
General Physiotherapy
Higher-intensity general physiotherapy did not significantly improve motor function, ADL, or QOL, (18–20); nor did it affect LOS. (19) Note, however, that the studies examining general PT were looking at 2 hours or less of additional PT per week.
Studies investigating whether higher-intensity general PT might be associated with adverse events found no adverse events occurring in the trials. (18;19)
Overall Considerations
The results of this analysis are limited to the earlier (i.e., acute) phase of stroke, with the mean time since stroke being 6 weeks or less for most of the evidence in the included studies. Therefore, this evidence-based analysis concludes that positive outcomes can be expected following higher-intensity PT in the earlier phase of stroke. This analysis is not equipped to comment on expected outcomes of PT administered at a later stage post-stroke.
Overall, this evidence-based analysis found support for the use of higher-intensity PT to improve limb function and the capacity to perform ADL after stroke. It should be noted that those studies which demonstrated effectiveness of higher-intensity PT focused on specific exercises aimed at improving the function of one paretic limb. This implies that more time and more focused therapy is needed to achieve functional goals in either upper or lower limb.
ACKNOWLEDGEMENTS
Editorial Staff
Joanna Odrowaz, BSc (Hons)
Sue MacLeod, BA
Medical Information Services
Kellee Kaulback, BA(H), MISt
Corinne Holubowich, BEd, MLIS
APPENDICES
Appendix 1: Literature Search Strategies
Literature Search – Stroke Mega – Rehab Intensity EBA
Search date: June 7, 2013
Databases searched: OVID MEDLINE, MEDLINE In-Process and Other Non-Indexed Citations, EMBASE; All EBM Reviews - Cochrane DSR, ACP Journal Club, DARE, CCTR, CMR, HTA, and NHSEED; CINAHL
Limits: 2003–current; English
Filters: Meta-analyses, systematic reviews, health technology assessments, RCTs
Database: EBM Reviews - Cochrane Database of Systematic Reviews <2005 to April 2013>, EBM Reviews - ACP Journal Club <1991 to May 2013>, EBM Reviews - Database of Abstracts of Reviews of Effects <2nd Quarter 2013>, EBM Reviews - Cochrane Central Register of Controlled Trials <May 2013>, EBM Reviews - Cochrane Methodology Register <3rd Quarter 2012>, EBM Reviews - Health Technology Assessment <2nd Quarter 2013>, EBM Reviews -NHS Economic Evaluation Database <2nd Quarter 2013>, Embase <1980 to 2013 Week 22>, Ovid MEDLINE(R) <1946 to May Week 5 2013>, Ovid MEDLINE(R) In-Process & Other Non-Indexed Citations <June 06, 2013>
| # | Searches | Results |
|---|---|---|
| 1 | exp Stroke/ or exp brain ischemia/ | 261975 |
| 2 | exp intracranial hemorrhages/ use mesz,acp,cctr,coch,clcmr,dare,clhta,cleed | 54360 |
| 3 | exp brain hemorrhage/ use emez | 78701 |
| 4 | exp stroke patient/ use emez | 7849 |
| 5 | (stroke or tia or transient ischemic attack or cerebrovascular apoplexy or cerebrovascular accident or cerebrovascular infarct* or brain infarct* or CVA or (brain adj2 isch?emia) or (cerebral adj2 isch?emia) or (intracranial adj2 hemorrhag*) or (brain adj2 hemorrhag*)).ti,ab. | 402906 |
| 6 | or/1–5 | 593865 |
| 7 | exp Rehabilitation/ or exp Rehabilitation Nursing/ | 358247 |
| 8 | exp Rehabilitation Centers/ use mesz,acp,cctr,coch,clcmr,dare,clhta,cleed | 12317 |
| 9 | exp rehabilitation center/ use emez | 8433 |
| 10 | exp rehabilitation medicine/ use emez or exp rehabilitation research/ use emez | 4826 |
| 11 | exp rehabilitation care/ use emez | 7785 |
| 12 | exp Stroke/rh [Rehabilitation] | 9262 |
| 13 | exp Physiotherapy Modalities/ use mesz,acp,cctr,coch,clcmr,dare,clhta,cleed | 131082 |
| 14 | exp physical medicine/ use emez | 371840 |
| 15 | exp mobilization/ use emez (rehabilitat* or habilitat* or movement therap* or physiotherap* or physical therap* | 16105 |
| 16 | or exercis* or occupational therap* or mobilization or mobilisation or strength train*).ti,ab. | 815697 |
| 17 | or/7–16 | 1453011 |
| 18 | exp Time/ | 1659341 |
| 19 | exp dose response/ use emez | 338020 |
| 20 | exp treatment duration/ or exp exercise intensity/ use emez | 94600 |
| 21 | ((time* or interval* or intens* or duration or augment* or dose-response or dose or dosing or dosage or frequency or enhance* or amount* or quantit*) adj4 (rehabilitat* or habilitat* or movement therap* or physiotherap* or physical therap* or exercis* or occupational therap* or mobilization or mobilisation or strength train*)).ti,ab. | 80907 |
| 22 | or/18–21 | 2140005 |
| 23 | 6 and 17 and 22 | 7516 |
| 24 | (Meta Analysis or Controlled Clinical Trial or Randomized Controlled Trial).pt. | 889302 |
| 25 | Meta-Analysis/ use mesz,acp,cctr,coch,clcmr,dare,clhta,cleed or exp Technology Assessment, Biomedical/ use mesz,acp,cctr,coch,clcmr,dare,clhta,cleed | 52161 |
| 26 27 | Meta Analysis/ use emez or Biomedical Technology Assessment/ use emez (meta analy* or metaanaly* or pooled analysis or (systematic* adj2 review*) or published studies or published literature or medline or embase or data synthesis or data extraction or cochrane or ((health technolog* or biomedical technolog*) adj2 assess*)).ti,ab. | 82690 363072 |
| 28 | exp Random Allocation/ use mesz,acp,cctr,coch,clcmr,dare,clhta,cleed or exp Double-Blind Method/ use mesz,acp,cctr,coch,clcmr,dare,clhta,cleed or exp Control Groups/ use mesz,acp,cctr,coch,clcmr,dare,clhta,cleed or exp Placebos/ use mesz,acp,cctr,coch,clcmr,dare,clhta,cleed | 337927 |
| 29 | Randomized Controlled Trial/ use emez or exp Randomization/ use emez or exp RANDOM SAMPLE/ use emez or Double Blind Procedure/ use emez or exp Triple Blind Procedure/ use emez or exp Control Group/ use emez or exp PLACEBO/ use emez | 616263 |
| 30 | (random* or RCT or placebo* or sham* or (control* adj2 clinical trial*)).ti,ab. | 2129842 |
| 31 | or/24–30 | 2954384 |
| 32 | 23 and 31 | 2523 |
| 33 | limit 32 to english language [Limit not valid in CDSR,ACP Journal Club,DARE,CCTR,CLCMR; records were retained] | 2410 |
| 34 | limit 33 to yr=“2003 -Current” [Limit not valid in DARE; records were retained] | 1758 |
| 35 | remove duplicates from 34 | 1134 |
CINAHL
Top of Form
| # | Query | Results |
|---|---|---|
| S21 | S6 AND S12 AND S16 AND S19 Limiters - Published Date from: 20030101–20131231; English Language | 278 |
| S20 | S6 AND S12 AND S16 AND S19 | 371 |
| S19 | S17 OR S18 | 232,710 |
| S18 | ((health technology N2 assess*) or meta analy* or metaanaly* or pooled analysis or (systematic* N2 review*) or published studies or medline or embase or data synthesis or data extraction or cochrane or random* or sham*or rct* or (control* N2 clinical trial*) or placebo*) | 223,385 |
| S17 | (MH “Random Assignment”) or (MH “Random Sample+”) or (MH “Meta Analysis”) or (MH “Systematic Review”) or (MH “Double-Blind Studies”) or (MH “Single-Blind Studies”) or (MH “Triple-Blind Studies”) or (MH “Placebos”) or (MH “Control (Research)”) or (MH “Randomized Controlled Trials”) | 135,585 |
| S16 | S13 OR S14 OR S15 | 116,238 |
| S15 | (time* or interval* or intens* or duration or augment* or dose-response or dose or dosing or dosage or frequency or enhance* or amount* or quantit*) N4 (rehabilitat* or habilitat* or movement therap* or physiotherap* or physical therap* or exercis* or occupational therap* or mobilization or mobilisation or strength train*) | 14,978 |
| S14 | (MH “Treatment Duration”) | 4,150 |
| S13 | (MH “Time+”) | 99,240 |
| S12 | S7 OR S8 OR S9 OR S10 OR S11 | 296,683 |
| S11 | (rehabilitat* or habilitat* or movement therap* or physiotherap* or physical therap* or exercis* or occupational therap* or mobilization or mobilisation or strength train*) | 237,534 |
| S10 | (MH “Physical Medicine”) | 1,144 |
| S9 | (MH “Stroke+/RH”) | 7,150 |
| S8 | (MH “Rehabilitation Nursing”) | 2,129 |
| S7 | (MH “Rehabilitation+”) OR (MH “Rehabilitation Centers+”) | 167,454 |
| S6 | S1 OR S2 OR S3 OR S4 OR S5 | 61,146 |
| S5 | (MH “Stroke Patients”) | 2,333 |
| S4 | (stroke or tia or transient ischemic attack or cerebrovascular apoplexy or cerebrovascular accident or cerebrovascular infarct* or brain infarct* or CVA or (brain N2 isch?emia) or (cerebral N2 isch?emia) or (intracranial N2 hemorrhag*) or (brain N2 hemorrhag*)) | 54,078 |
| S3 | (MH “Intracranial Hemorrhage+”) | 7,248 |
| S2 | (MH “Cerebral Ischemia+”) | 8,057 |
| S1 | (MH “Stroke”) | 35,155 |
Appendix 2: Evidence Quality Assessment
Table A1:
GRADE Evidence Profile for Comparison of Higher-Intensity Versus Conventional Physiotherapy
| Number of Studies (Design) | Risk of Bias | Inconsistency | Indirectness | Imprecision | Publication Bias | Upgrade Considerations | Quality |
|---|---|---|---|---|---|---|---|
| Motor Function | |||||||
| PT of upper limb | |||||||
| 4 RCTs | No serious limitations | No serious limitations | No serious limitations | No serious limitations | Undetected | Large magnitude of effect (+1) Dose-response gradient (+1) | ⊕⊕⊕⊕ High |
| PT of Lower Limb | |||||||
| 1 RCT | No serious limitations | Undetected | No serious limitations | No serious limitations | Undetected | N/A | ⊕⊕⊕⊕ High |
| General PT | |||||||
| 3 RCTs | Serious limitations (–1)a | No serious limitations | No serious limitations | No serious limitations | Undetected | N/A | ⊕⊕⊕ Moderate |
| ADL | |||||||
| PT of Upper Limb | |||||||
| 2 RCTs | No serious limitations | No serious limitations | Serious limitations (–1)b | No serious limitations | Undetected | N/A | ⊕⊕⊕ Moderate |
| PT of Lower Limb | |||||||
| No RCT | |||||||
| General PT | |||||||
| 3 RCTs | Serious limitations (–1)a | No serious limitations | No serious limitations | No serious limitations | Undetected | N/A | ⊕⊕⊕ Moderate |
| QOL | |||||||
| PT of Upper Limb | |||||||
| 1 RCT | No serious limitations | No serious limitations | Serious limitations (–1)c | No serious limitations | Undetected | N/A | ⊕⊕⊕ Moderate |
| PT of Lower Limb | |||||||
| 1 RCT | No serious limitations | No serious limitations | Serious limitations (–1)c | No serious limitations | Undetected | N/A | ⊕⊕⊕ Moderate |
| General PT | |||||||
| 1 RCT | Serious limitations (–1)a | No serious limitations | No serious limitations | No serious limitations | No serious limitations | N/A | ⊕⊕⊕ Moderate |
| LOS | |||||||
| PT of Upper Limb | |||||||
| No RCT | |||||||
| PT of Lower Limb | |||||||
| No RCT | |||||||
| General PT | |||||||
| 1 RCT | Serious limitations (–1)a | No serious limitations | No serious limitations | No serious limitations | No serious limitations | N/A | ⊕⊕⊕ Moderate |
Abbreviations: ADL, activities of daily living; GRADE, Grading of Recommendations Assessment, Development, and Evaluation; LOS, length of stay; N/A, not applicable; PT, physiotherapy; QOL, quality of life; RCT, randomized controlled trial.
Studies did not report on the method of sequence generation or did not report on the method of allocation concealment.
Studies used different methods to measure ADL.
Outcome was reported by only one study.
References
- (1).Duncan PW, Goldstein LB, Horner RD, Landsman PB, Samsa GP, Matchar DB. Similar motor recovery of upper and lower extremities after stroke. Stroke. 1994. Jun; 25(6): 1181–8. [DOI] [PubMed] [Google Scholar]
- (2).Friedman PJ. Gait recovery after hemiplegic stroke. Int Disabil Stud. 1990. Jul; 12(3): 119–22. [DOI] [PubMed] [Google Scholar]
- (3).Kwakkel G, Wagenaar RC, Twisk JW, Lankhorst GJ, Koetsier JC. Intensity of leg and arm training after primary middle-cerebral-artery stroke: a randomised trial. Lancet. 1999. Jul 17; 354(9174): 191–6. [DOI] [PubMed] [Google Scholar]
- (4).Winstein CJ, Rose DK, Tan SM, Lewthwaite R, Chui HC, Azen SP. A randomized controlled comparison of upper-extremity rehabilitation strategies in acute stroke: a pilot study of immediate and long-term outcomes. Arch Phys Med Rehabil. 2004; 85(4): 620–8. [DOI] [PubMed] [Google Scholar]
- (5).Barker RN, Brauer SG. Upper limb recovery after stroke: the stroke survivors' perspective. Disabil Rehabil. 2005. Oct 30; 27(20): 1213–23. [DOI] [PubMed] [Google Scholar]
- (6).Hakim AM, Silver F, Hodgson C. Is Canada falling behind international standards for stroke care? CMAJ. 1998. Sep 22; 159(6): 671–3. [PMC free article] [PubMed] [Google Scholar]
- (7).Public Health Agency of Canada. Tracking heart disease and stroke in Canada - stroke highlights, 2011[Internet]. Public Health Agency of Canada: 2011. [cited 2013 Oct 10]. Available from: http://www.phac-aspc.gc.ca/cd-mc/cvd-mcv/sh-fs-2011/pdf/StrokeHighlights_EN.pdf [Google Scholar]
- (8).Lloyd-Jones D, Adams R, Carnethon M, De SG, Ferguson TB, Flegal K, et al. Heart disease and stroke statistics–2009 update: a report from the American Heart Association Statistics Committee and Stroke Statistics Subcommittee. Circulation. 2009. Jan 27; 119(3): e21–181. [DOI] [PubMed] [Google Scholar]
- (9).Kolominsky-Rabas PL, Heuschmann PU. Incidence, etiology and long-term prognosis of stroke. Fortschr Neurol Psychiatr. 2002. Dec; 70(12): 657–62. [DOI] [PubMed] [Google Scholar]
- (10).Review Manager (RevMan) Computer Program, Version 5.1 Copenhagen (DK) The Nordic Cochrane Centre, Cochrane Collaboration; 2011. [Google Scholar]
- (11).Guyatt GH, Oxman AD, Schunemann HJ, Tugwell P, Knottnerus A. GRADE guidelines: a new series of articles in the Journal of Clinical Epidemiology. J Clin Epidemiol. 2011. Apr; 64(4): 380–2. [DOI] [PubMed] [Google Scholar]
- (12).Goodman C. Literature searching and evidence interpretation for assessing health care practices. Stockholm, Sweden: Swedish Council on Technology Assessment in Health Care; 1996. 81 p. SBU Report No. 119E. [DOI] [PubMed]
- (13).Han C, Wang Q, Meng PP, Qi MZ. Effects of intensity of arm training on hemiplegic upper extremity motor recovery in stroke patients: a randomized controlled trial. Clin Rehab. 2013; 27(1): 75–81. [DOI] [PubMed] [Google Scholar]
- (14).Hunter SM, Hammett L, Ball S, Smith N, Anderson C, Clark A, et al. Dose-response study of mobilisation and tactile stimulation therapy for the upper extremity early after stroke: a phase I trial. Neurorehabil Neural Repair. 2011; 25(4): 314–22. [DOI] [PubMed] [Google Scholar]
- (15).Harris JE, Eng JJ, Miller WC, Dawson AS. A self-administered graded repetitive arm supplementary program (GRASP) improves arm function during inpatient stroke rehabilitation: a multi-site randomized controlled trial. Stroke. 2009. Jun; 40(6): 2123–8. [DOI] [PubMed] [Google Scholar]
- (16).Donaldson C, Tallis R, Miller S, Sunderland A, Lemon R, Pomeroy V. Effects of conventional physiotherapy and functional strength training on upper limb motor recovery after stroke: a randomized phase II study. Neurorehabil Neural Repair. 2009; 23(4): 389–97. [DOI] [PubMed] [Google Scholar]
- (17).Cooke EV, Tallis RC, Clark A, Pomeroy VM. Efficacy of functional strength training on restoration of lower-limb motor function early after stroke: phase I randomized controlled trial. Neurorehabil Neural Repair. 2010; 24(1): 88–96. [DOI] [PubMed] [Google Scholar]
- (18).Askim T, Morkved S, Engen A, Roos K, Aas T, Indredavik B. Effects of a community-based intensive motor training program combined with early supported discharge after treatment in a comprehensive stroke unit: A randomized, controlled trial. Stroke. 2010; 41(8): 1697–703. [DOI] [PubMed] [Google Scholar]
- (19).Glasgow Augmented Physiotherapy Study (GAPS) group. Can augmented physiotherapy input enhance recovery of mobility after stroke? A randomized controlled trial. Clin Rehabil. 2004. Aug;18 (5): 529–37. [DOI] [PubMed] [Google Scholar]
- (20).Di Lauro A, Pellegrino L, Savastano G, Ferraro C, Fusco M, Balzarano F, et al. A randomized trial on the efficacy of intensive rehabilitation in the acute phase of ischemic stroke. J Neurol. 2003. Oct; 250(10): 1206–8. [DOI] [PubMed] [Google Scholar]