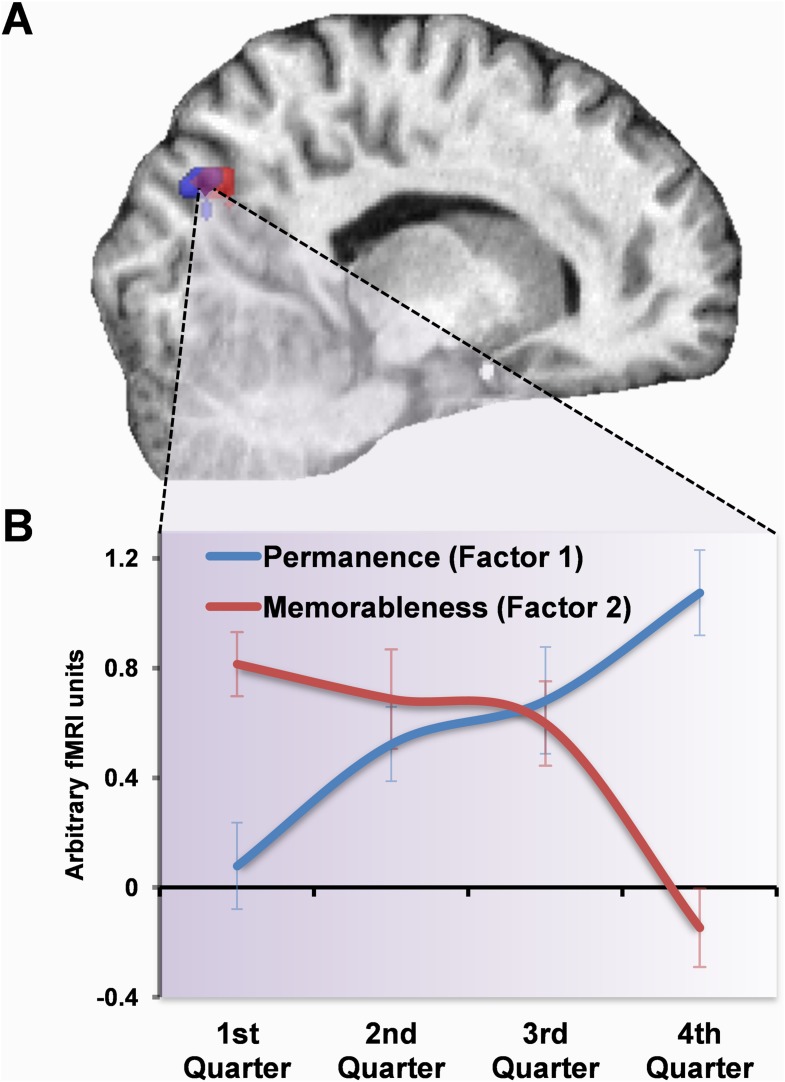
Figure 5. Response profile in POS.
(A) POS responded to memorable landmarks (those with higher factor 2 values) in the first quarter of learning (red) and permanent ones (with higher values for factor 1) in the final quarter (blue). The overlap of these activations is shown in purple. (B) The response profile of the overlapping (purple) voxels for the two factors throughout whole scan. Responses were initially greater for memorable landmarks but then switched over the course of learning to eventually become responsive to permanence. Plots show mean BOLD responses ±1 SEM. Activations are shown on a structural MRI brain scan of single representative subject at the default threshold of p < 0.05 (FWE).

