

Abstract
OBJECTIVES
The purpose of this study was to evaluate the ability of a novel cardiac magnetic resonance (CMR) real-time phase contrast (RT-PC) flow measurement technique to reveal the discordant respirophasic changes in mitral and tricuspid valve in flow indicative of the abnormal hemodynamics seen in constrictive pericarditis (CP).
BACKGROUND
Definitive diagnosis of CP requires identification of constrictive hemodynamics with or without pericardial thickening. CMR to date has primarily provided morphological assessment of the pericardium.
METHODS
Sixteen patients (age 57 ± 13 years) undergoing CMR to assess known or suspected CP and 10 controls underwent RT-PC that acquired simultaneous mitral valve and tricuspid valve inflow velocities over 10 s of unrestricted breathing. The diagnosis of CP was confirmed via clinical history, diagnostic imaging, cardiac catheterization, intraoperative findings, and histopathology.
RESULTS
Ten patients had CP, all with increased pericardial thickness (6.2 ± 1.0 mm). RT-PC imaging demonstrated discordant respirophasic changes in atrioventricular valve inflow velocities in all CP patients, with mean ± SD mitral valve and tricuspid valve inflow velocity variation of 46 ± 20% and 60 ± 15%, respectively, compared with 16 ± 8% and 24 ± 11% in patients without CP (p < 0.004 vs. patients with CP for both) and 17 ± 5% and 31 ± 13% in controls (p < 0.001 vs. patients with CP for both). There was no difference in atrioventricular valve inflow velocity variation between patients without CP compared with controls (p > 0.3 for both). Respiratory variation exceeding 25% across the mitral valve yielded a sensitivity of 100%, a specificity of 100%, and an area under the receiver-operating characteristic curve of 1.0 to detect CP physiology. Using a cutoff of 45%, variation of transtricuspid valve velocity had a sensitivity of 90%, a specificity of 88%, and an area under the receiver-operating characteristic curve of 0.98.
CONCLUSIONS
Accentuated and discordant respirophasic changes in mitral valve and tricuspid valve inflow velocities characteristic of CP can be identified noninvasively with RT-PC CMR. When incorporated into existing CMR protocols for imaging pericardial morphology, RT-PC CMR provides important hemodynamic evidence with which to make a definite diagnosis of CP.
Keywords: cardiac magnetic resonance, constrictive pericarditis, pericardial disease
Constrictive pericarditis (CP), an important cause of heart failure, requires accurate diagnosis due to the potentially curative effect of directed treatment that is distinct from usual heart failure therapies (1). Despite the availability of noninvasive modalities commonly used for clinical evaluation such as transthoracic echocardiography, computed tomography (CT), and cardiac magnetic resonance (CMR), the diagnosis of CP remains challenging (2–4). Although CMR can visualize the entire pericardium without limitation imposed by body habitus or previous surgical procedures, approximately 20% of patients with CP do not have pericardial thickening, and a thickened pericardium itself is not necessarily diagnostic of CP (5–7). To make the diagnosis, it is essential to demonstrate the characteristic hemodynamic changes caused by constricted filling of the right and left ventricles. Cine imaging may show an early diastolic septal bounce and respirophasic septal shift (8–11), or one may infer the presence of increased right-sided pressures by identifying inferior vena cava (IVC) plethora; however, these secondary findings are not diagnostic of CP.
Historically, Doppler echocardiography has been pivotal in the noninvasive diagnosis of CP due to its ability to demonstrate dissociation between intracardiac and intrathoracic pressures and ventricular interdependence via respiratory variations in transvalvular inflow velocities (12–14). With this approach, one serially examines mitral valve (MV) and tricuspid valve (TV) inflow variation over respiratory cycles. Magnetic resonance–based real-time phase contrast (RT-PC) imaging is capable of measuring velocities with improved temporal resolution without the need for breath holding (15). The aims of this study were: 1) to evaluate the accuracy of RT-PC as part of a comprehensive CMR-based evaluation of CP; and 2) to compare RT-PC flow measurements among patients with CP, patients without CP, and healthy controls.
METHODS
Patients
Consecutive patients (November 2009 to November 2010) with known or suspected CP referred for CMR were prospectively screened for participation in an institutional review board–approved human subjects protocol. Ten healthy controls (reference group) were recruited from advertisements for an ongoing, institutional review board–approved CMR technique development protocol. Exclusion criteria consisted of the presence of mechanical valves, valvular heart disease that was more than moderate in severity, history of right ventricular infarction, restrictive cardiomyopathy, significant pulmonary disease, or atrial fibrillation at the time of CMR examination. The reference standards for diagnosis of CP included: 1) standard noninvasive imaging such as transthoracic echocardiography (TTE) and cardiac CT and CMR findings of respirophasic septal shift, diastolic septal bounce, IVC plethora (>2.5 cm), and pericardial thickness >4 mm; 2) invasive hemodynamic evidence from cardiac catheterization; and/or 3) intraoperative and histopathology findings consistent with CP in the context of a consistent clinical history (2, 3, 5–7, 14, 16). The catheterization criteria included left ventricular end-diastolic pressure/right ventricular end-diastolic pressure ≤5 mm Hg, pulmonary arterial systolic pressure <55 mm Hg, right ventricular end-diastolic pressure/right ventricular systolic pressure >1/3, inspiratory decrease in right atrial pressure <5 mm Hg, inspiratory decrease in pulmonary capillary wedge pressure/left ventricular end-diastolic pressure difference of >5 mm Hg, and systolic area index >1.1 (7).
The diagnosis of CP was adjudicated by 2 observers blinded to CMR RT-PC imaging. All patients must have had a clinical history in which CP was in the differential diagnosis. Then if cardiac catheterization was available and the findings were consistent with CP, the diagnosis was made. The diagnosis was further confirmed on intraoperative and histopathologic findings (if available). If cardiac catheterization was not available or the findings were equivocal, physiological and morphological changes with echocardiography, CMR, and/or CT were used for the diagnosis. For exclusion of CP, hemodynamic changes must have been absent on cardiac catheterization and/or echocardiography.
CMR methods
All CMR studies were performed on a 1.5-T scanner (MAGNETOM Avanto, Siemens Healthcare, Erlangen, Germany) with a maximum gradient amplitude of 45 mT/m, slew rate of 200 mT/m/ms, and 12-channel phased-array coil. In addition to RT-PC imaging, a complete CMR protocol for CP evaluation included: 1) coronal, axial, and transverse stacks of dark blood half-Fourier single-shot turbo spin echo images; 2) segmented steady-state free-precession cine images in contiguous short-axis planes covering the heart when breath holding was possible or real-time cines when breath holding was not possible; 3) T1-weighted turbo spin echo and T2-weighted short tau inversion recovery imaging in additional planes of interest; 4) real-time cine imaging in the midshort axis plane during 10 s of free breathing to visually assess respirophasic septal shift; 5) real-time cine imaging of the IVC for 10 s to assess IVC plethora; and 6) multiplane late gadolinium enhancement imaging (see Table 1 for typical sequence parameters).
Table 1.
CMR Acquisition Parameters
| Sequence | HASTE | B-SSFP CINE | T2-STIR | T1W-TSE | LGE | ||
|---|---|---|---|---|---|---|---|
| Breath hold | No (single shot) | Yes (segmented) | No (real-time cines)* | Yes | Yes | Yes (segmented) | No (single shot)* |
| Parallel acceleration | GRAPPA rate 2 | GRAPPA rate 2 | TSENSE rate 3 | GRAPPA rate 2 | None | None | GRAPPA rate 2 |
| In-plane resolution, mm | 1.6 × 1.6 | 1.5 × 1.5 | 3.5 × 2.1 | 2.2 × 1.5 | 1.3 × 1.3 | 2.2 × 2 | 2.5 × 1.9 |
| Slice thickness, mm | 6 | 8 | 8 | 8 | 5 | 8 | 8 |
| TR/TE, ms | 2 × R-R/55 | 3.0/1.3 | 2.3/1.0 | 2 × R-R/60 | 1 × R-R/33 | 1 × R-R/4.2 | 2.8/1.1 |
| Bandwidth, Hz/pixel | 1,030 | 930 | 1,630 | 930 | 1,030 | 130 | 1,150 |
| Flip angle | 90° | 65° | 74° | 90° | 90° | 25° | 40° |
Performed in patients unable to breath hold.
CMR = cardiac magnetic resonance; B-SSFP = balanced steady-state free precession; GRAPPA = generalized autocalibrating partially parallel acquisitions; HASTE = half Fourier single-shot turbo spin echo; LGE = late gadolinium enhancement; TE = echo time; TR = repetition time; TSENSE = temporal sensitivity encoding; T1W-TSE = T1-weighted turbo spin echo; T2-STIR = T2-weighted short tau inversion recovery.
RT-PC ACQUISITION
RT-PC acquisition using a custom-made sequence with through-plane velocity encoding to simultaneously measure MV and TV inflow velocities was performed by prescribing a slice position across both atrioventricular valves from a horizontal long-axis view (Fig. 1A). Patients were instructed to breathe freely (12) with video monitoring to ensure that several respiratory cycles were completed during acquisition. RT-PC imaging was performed with the following parameters: repetition time/echo time of 13.7 ms/2.5 ms, water excitation pulse with flip angle of 25°, 10-mm slice thickness, 160 × 120 matrix, echo-planar imaging factor of 15, and temporal sensitivity encoding rate of 2 (17). The aliasing velocity was set at 150 cm/s. Shared velocity encoding was used to achieve an effective temporal resolution of 55 ms (15, 18). RT-PC data were acquired over 10 to 20 s, and typically 200 to 400 phases were acquired spanning multiple cardiac and respiratory cycles. The data reconstruction was performed in real time on the scanner.
Figure 1. RT-PC Acquired Across MV and TV.
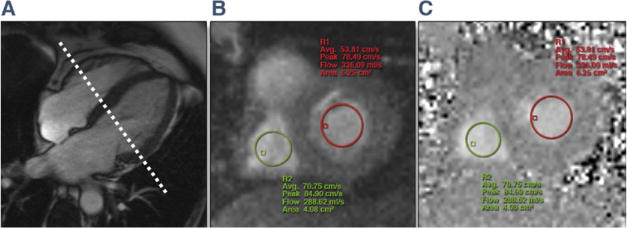
(A) Diastolic frame from a horizontal long-axis cine acquisition shows how the plane for through-plane real-time phase-contrast (RT-PC) imaging was prescribed. Resulting magnitude (B) and phase (C) images from RT-PC imaging are shown. Regions of interest for the mitral valve (MV) (red) and tricuspid valve (TV) (green) are illustrated in both the phase and magnitude images.
Image analysis
Pericardial thickness was measured from half Fourier single-shot turbo spin echo or T1-weighted turbo spin echo images on a workstation equipped with standardized software for CMR image analysis (Leonardo, Siemens Healthcare). The maximal pericardial thickness was measured in a plane with the best depiction of the pericardium. RT-PC velocity measurements were performed offline. Regions of interest (ROIs) were drawn encircling the central portion of MV and TV inflow from velocity-encoded images (Figs. 1B and 1C) and propagated across all frames. ROIs were reviewed in each frame to ensure that they were within the MV and TV inflow regions. Standard software for analysis of phase-contrast data (Argus, Siemens HealthCare) displayed a graph of peak velocities over time (Fig. 2). The peak velocity for each frame was automatically obtained by Argus by averaging of 4 neighboring pixels with the highest velocity within the chosen ROI for each valve (Fig. 2). The velocity data were exported to an Excel (Microsoft Corp., Redmond, Washington) worksheet for each patient, and the peak velocities were recorded. Early velocities (E) for MV and TV inflow in expiration and inspiration were measured from the first heart beat of the respective respiratory phase (identified from diaphragm position evident from the magnitude images obtained with RT-PC acquisition). The percentage of maximal respiratory change in inflow velocity for the MV was calculated as follows: (MV expiratory E – inspiratory E)/(inspiratory E) (12, 14, 19). For the TV, it was calculated as: (TV inspiratory E – expiratory E)/(expiratory E) (12). MV and TV maximal velocity change >25% (12–14) was defined as indicating accentuated respirophasic variation. The flow analysis, the determination of the presence of discordant respirophasic changes between the MV and TV, and the calculation of the degree of this change were performed by 2 observers in consensus blinded to all clinical data as well as all other CMR findings (P.T., M.W.).
Figure 2. Respirophasic Variation in MV and TV Inflow Velocities by RT-PC CMR.
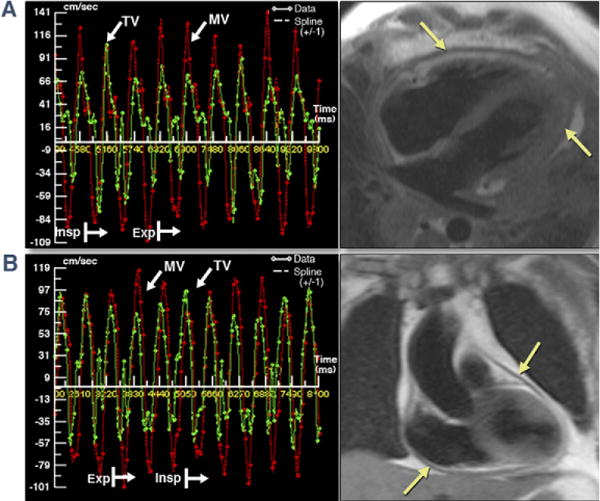
Two representative examples of RT-PC velocities across MV (red bars) and TV (green bars) show respirophasic variation, and the same patients’ corresponding dark blood images (half Fourier single-shot turbo spin echo and T1-weighted turbo spin echo) illustrate thickened pericardium. (A and B) Represent patients #8 and #3 from Table 2. Patient #3’s heart rate was 103 beats/min at acquisition resulting in E and A fusion (B). A = late mitral diastolic peak velocity; CMR = cardiac magnetic resonance; E = early mitral diastolic peak velocity; Exp = expiratory; Insp = inspiratory; other abbreviations as in Figure 1.
Clinical and imaging follow-up
Follow-up clinical history was obtained in patients without a CMR diagnosis of constriction either through follow-up clinic visit records or telephone conversation at 3 to 6 months after the CMR study. Two of the patients who had pericardiectomy were also referred for follow-up CMR.
Statistical analysis
Means and SDs were calculated for continuous data. An unpaired Student t test was used for comparison of continuous data between groups. All analysis was performed using MedCalc Version 11.0 (MedCalc Software, Mariakerke, Belgium). The Kolmogorov-Smirnov test was used to assess normality of all data analyzed using parametric tests. Receiver-operating characteristic curve analysis was performed to obtain sensitivity and specificity.
RESULTS
Clinical characteristics
During the recruitment period, 1,898 patients were referred to our CMR laboratory, and 17 were referred specifically for the assessment of CP. One patient was excluded due to a history of severe pulmonary hypertension. Six of the 10 controls were male, and the mean ± SD age was 31 ± 10 years (range 21 to 54 years). No control subject had any known cardiac disease or cardiac symptoms. All subjects were in sinus rhythm at the time of CMR. Clinical and imaging characteristics of the patients are provided in Table 2. Ten of 16 patients referred for CP evaluation met diagnostic criteria for CP by the reference standards (Fig. 3). All patients with CP had classic symptoms of right heart failure and findings of increased venous pressure in the absence of severe left heart disease. One had a history of pericarditis, 2 had undergone previous cardiac surgery, and 1 had received mediastinal irradiation; the remaining 6 patients had idiopathic CP. In the 6 patients not meeting diagnostic criteria for CP, the reasons for referral included dyspnea with pericardial or pleural effusion (n = 5) or equivocal TTE findings of CP (n = 1, patient #12).
Table 2.
Clinical Characteristics and CMR Findings of 10 Patients With (Patients #1 to #10) and 6 Patients Without (Patients #11 to #16) CP
| Patient# | Age, yrs |
Sex | Method to Confirm or Rule Out CP |
Pericardial Thickness, mm |
Diastolic Septal Bounce |
Respiratory Septal Shift |
IVC Plethora |
MV Inflow Velocity Change, % |
TV Inflow Velocity Change, % |
Cause of CP |
|---|---|---|---|---|---|---|---|---|---|---|
| 1 | 56 | M | Cath/echo, surgery/path | 4.6 | N | Y | Y | 32 | 59 | Idiopathic |
| 2 | 81 | M | Cath/echo | 5.5 | N | Y | Y | 31 | 78 | Idiopathic |
| 3 | 52 | M | Cath, surgery/path | 7.0 | Y | Y | Y | 57 | 52 | Recurrent pericarditis |
| 4 | 65 | M | Cath, surgery/path | 6.9 | N | N | Y | 41 | 78 | Post-CABG |
| 5 | 55 | M | Cath, surgery/path | 7.5 | N | Y | Y | 60 | 50 | Idiopathic |
| 6 | 48 | M | Cath, surgery/path | 5.4 | Y | Y | Y | 95 | 87 | Idiopathic |
| 7 | 80 | F | Cath/echo | 6.0 | Y | Y | Y | 30 | 49 | Post-CABG |
| 8 | 40 | F | Echo/CT | 5.7 | Y | Y | Y | 37 | 45 | Radiation |
| 9 | 30 | M | Cath, surgery/path | 7.5 | Y | Y | Y | 37 | 48 | Idiopathic |
| 10 | 57 | M | Cath, surgery/path | 6.0 | N | Y | Y | 41 | 60 | Idiopathic |
| Mean (SD) | 56 (16) | – | – | 6.2 (1.0) | – | – | – | 46 (20) | 60 (15) | – |
| 11 | 66 | F | Echo | 1.7 | N | N | N | 23 | 45 | Atrial tachycardia |
| 12 | 58 | F | Cath | 1.9 | Y | Y | N | 21 | 16 | Obesity |
| 13 | 52 | M | Cath/CT | 3.6 | N | Y | N | 19 | 16 | Pulmonary hypertension |
| 14 | 67 | M | Cath | 1.6 | N | N | N | 5 | 23 | Ischemic cardiomyopathy |
| 15 | 56 | F | Echo | 1.4 | N | N | N | 7 | 23 | Idiopathic pericardial effusion |
| 16 | 53 | F | Echo | 2.5 | N | N | N | 21 | 21 | Idiopathic pericardial effusion |
| Mean (SD) | 57 (6) | – | – | 2.1 (0.8) | – | – | – | 16 (8) ci | 24 (11) | – |
Dilated IVC was defined as a diameter >2.5 cm and absence of respiratory variation as <50% variation in diameter between inspiration and expiration. In patients without CP, the cause of CP column describes potential causes for the initial presenting symptoms.
CABG = coronary artery bypass graft; cath = cardiac catheterization; CMR = cardiac magnetic resonance; CP = constrictive pericarditis; CT = computed tomography; echo = echocardiography; F = female; IVC = inferior vena cava; M = male; MV = mitral valve; N = no; Path = pathology; TV = tricuspid valve; Y = yes.
Figure 3. Comprehensive Assessment of Patient #10 With Surgically Proven Constrictive Pericarditis.
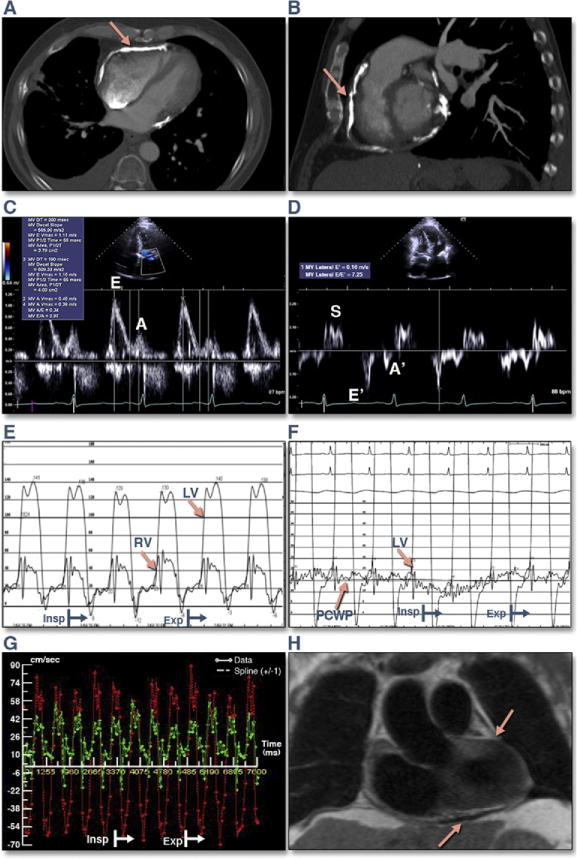
(A and B) Cardiac computed tomography images show extensive pericardial calcification (arrows). (C) Transmitral Doppler inflow illustrates a restrictive ventricular filling pattern (E/A >2.0, DT 149 ms). (D) Lateral mitral annulus tissue velocity demonstrates increased early mitral anular velocity (E′) velocity of 16 cm/s. (E) Simultaneous left and right heart catheterization demonstrates equalization of end-diastolic pressures (right ventricular [RV] end-diastolic pressure – left ventricular [LV] end-diastolic pressure ≤5 mm Hg), dip and plateau pattern of ventricular diastolic pressures, and ventricular interdependence (systolic area index 1.4). (F) Simultaneous LV and pulmonary capillary wedge pressure (PCWP) illustrating >5 mm Hg change in the gradient between inspiration and expiration, a sign of dissociation between intrathoracic and intracardiac pressures. (G) CMR real-time simultaneously measured transmitral and trans-TV flows (TV [green], MV [red]). (H) Dark blood half Fourier single-shot turbo spin echo coronal image shows thickened pericardium (arrows). Please see Online Videos 1 and 2. DT = deceleration time; other abbreviations as in Figures 1 and 2.
CP patients’ left ventricular ejection fraction averaged 58 ± 7%. Seven of 10 CP patients had surgical and histopathologic confirmation (7, 14, 16). Patients #2 and #7 had CP based on cardiac catheterization and noninvasive imaging; pericardiectomy was not pursued due to advanced age (20). Patient #8 had advanced metastatic breast cancer at the time of diagnosis and declined cardiac catheterization or surgical intervention. The diagnosis of CP was, however, evident by clinical history of right heart failure symptoms and previous chest irradiation with confirmatory TTE, CT, and CMR findings excluding RT-PC flow data. Among the 6 patients without CP, 3 patients had cardiac catheterization that confirmed the absence of CP, whereas 3 had echocardiography with hemodynamic assessment as well as other nonflow-based CMR findings that confirmed the absence of CP.
Feasibility of RT-PC flow measurement
RT-PC imaging was successfully completed in all patients and controls within 20 s. Because breath holding was not necessary, imaging was possible even in patients with decreased respiratory capacity. All acquired datasets yielded sufficient image quality for analysis.
Simultaneous MV and TV inflow velocities
In all patients with confirmed CP, RT-PC demonstrated discordant respirophasic changes in MV and TV inflow velocities (Figs. 2 and 3). In these patients, the mean ± SD trans-MV flow velocities at inspiration and expiration were 0.7 ± 0.3 m/s and 1.0 ± 0.3 m/s, respectively, whereas the trans-TV velocities were 0.8 ± 0.3 m/s and 0.5 ± 0.2 m/s, respectively. Kolmogorov-Smirnov tests indicated normality of all distributions evaluated with parametric statistics. The respirophasic velocity variations for MV and TV inflow averaged 46 ± 20% and 60 ± 15%, respectively, in patients with CP compared with 16 ± 8% and 24 ± 11% in patients without CP (p < 0.004 for both compared with patients with CP) and 17 ± 5% and 31 ± 13% in controls (p < 0.001 for both compared with patients with CP) (Fig. 3). There was no difference in MV and TV inflow velocity variation between patients without CP and controls (p = 0.8 and p = 0.3, respectively) (Fig. 4). All patients with CP had respiratory variation exceeding 25% across the MV, whereas none of the patients without CP or controls had this degree of change (sensitivity of 100% and specificity of 100%). For trans-TV velocity, all CP patients had respiratory variation exceeding 25%, whereas 17% of patients without CP and 50% of controls had a similar variation. However, using a higher cutoff of 45% variation, 9 of 10 patients with CP exceeded this threshold, whereas 1 of 6 patients without CP and 1 of 10 controls had this degree of variability (sensitivity of 90%, specificity of 88%).
Figure 4. Excluding Pericardial Constriction by RT-PC CMR.
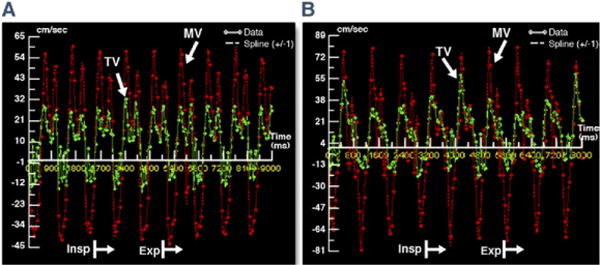
RT-PC trans-MV (red) and TV (green) flow velocity curves are shown from a patient without constrictive pericarditis (A) and a healthy control (B). Patient A was a 56-year-old woman and patient B was a 29-year-old man. Both lack the characteristic discordant flow pattern relative to the respiratory cycle seen in patients with constrictive pericarditis. DT = deceleration time; other abbreviations as in Figures 1 and 2.
Corroborating CMR findings of CP
All patients with CP had evident pericardial thickening (>4.0 mm) by dark blood CMR (Table 2) with a mean ± SD pericardial thickness of 6.2 ± 1.0 mm. Cine CMR demonstrated early diastolic septal bounce in half of CP patients, respirophasic septal shift of the interventricular septum (Online Video 1) in 80%, and IVC plethora (Online Video 2) in 90%. Among the 6 patients without CP, none had increased pericardial thickness (>4.0 mm); however, 1 patient had an early diastolic septal bounce, and 2 patients had respirophasic septal shift on cine imaging limited to early inspiration (Table 2). One of these 2 patients subsequently received a diagnosis of pulmonary hypertension. One patient with a previous coronary artery bypass graft had subendocardial hyperenhancement consistent with a previous myocardial infarction; however, late gadolinium enhancement was negative in all other patients. None of the healthy controls had any abnormal CMR findings.
Clinical outcomes
At 6-month follow-up, none of the patients without CMR diagnosis of CP required any further investigations for CP or developed symptoms of right heart failure or pericardial disease.
Patients #3 and #10 were referred for follow-up CMR examination post-pericardiectomy. In patient #3 (Fig. 5), the discordant respirophasic MV and TV flow variation was absent on the post-pericardiectomy examination, and real-time, free-breathing cine imaging (Online Video 3) did not demonstrate the respirophasic septal shift seen preoperatively (Online Video 1). In patient #10, there were remnant areas of pericardial thickness >4 mm, with a slight respirophasic septal bounce; however, the transvalvular flows were normal. Test characteristics are summarized in Figure 6.
Figure 5. Post-Pericardiectomy Improvement in Constrictive Hemodynamics.
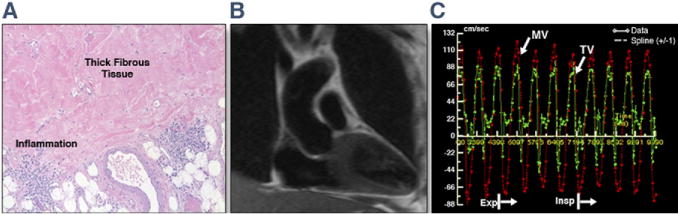
Histology and repeat CMR findings from patient #3 include histology of the thick pericardium with fibrous tissue and inflammation on hematoxylin and eosin staining (A). (B) Coronal plane half Fourier single-shot turbo spin echo image shows no residual thickened pericardium. (C) RT-PC MV and TV inflows illustrate resolution of the respirophasic flow variation that was seen preoperatively (Fig. 2B). The heart rate at acquisition was 112 beats/min, resulting in E and A fusion. Please see Online Video 3. Abbreviations as in Figures 1 and 2.
Figure 6. Receiver-Operating Characteristic Curves Comparing Patients With Constriction and Patients Without Constriction and Controls.
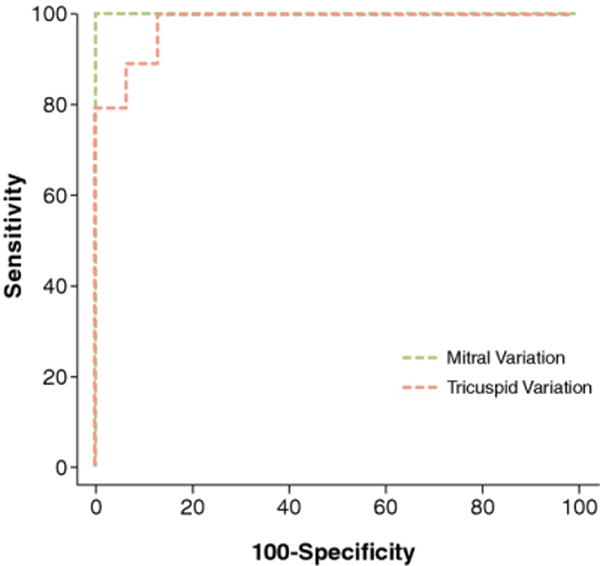
MV inflow variation of 25% had a sensitivity of 100%, a specificity of 100%, and an area under the curve of 1.0. For TV inflow variation of 45%, the sensitivity, specificity, and area under the curve were 90%, 88%, and 0.98, respectively. Abbreviations as in Figure 1.
DISCUSSION
In this work, we demonstrate that RT-PC CMR acquired over 10 s of unrestricted breathing and without electrocardiographic gating can demonstrate the characteristic hemodynamic changes of constrictive physiology. This technique accurately discriminated among patients with CP, those without CP, and healthy controls (Fig. 2). Similar to respiratory cycle-dependent pressure changes seen with simultaneous right and left heart catheterization, discordant trans-MV and TV flow velocity variations can be recorded and illustrated simultaneously using RT-PC CMR. Similar to Doppler echocardiography (12, 14), respiratory variation in trans-MV flow velocities exceeding 25% was seen in all patients with CP but not in patients without CP or controls. A greater variation of >45% was seen across the TVs in patients with CP compared with patients without CP or controls.
One of the most sensitive and specific markers of constrictive physiology is the demonstration of signs of dissociation between intrathoracic and intracardiac pressures and ventricular interdependence, by both invasive hemodynamics and noninvasive imaging (7, 12, 14, 16). TTE is the current initial diagnostic modality of choice in patients with suspected CP with Doppler-measured trans-MV velocity changes having a reported sensitivity and/or specificity as high as 88% to 100% in expert hands (12–14) for the diagnosis of CP. However, TTE does not reliably delineate pericardial thickness in most patients (21). Moreover, measurement of hemodynamic parameters is at times limited by inadequate acoustic windows.
The role of CMR in pericardial disease has evolved from solely assessing ventricular function and pericardial thickness to including indirect assessment of the hemodynamic changes seen in constrictive physiology (2, 3, 8, 9, 11). An accurate measurement of pericardial thickness using CMR has a reported sensitivity and specificity of 88% and 100%, respectively, for CP when pericardial thickness exceeds 4 mm (22). Other morphological changes supportive of CP have also been reported (2, 3). Abnormal diastolic septal bounce on breath-hold steady-state free precession cine (11) and respirophasic septal shift on free-breathing real-time cine (8) have been used to qualitatively illustrate constrictive physiology similar to cine echocardiography; however, these secondary findings can occur in conditions other than CP.
Our study illustrates the use of RT-PC CMR to demonstrate discordant respirophasic variation in trans-MV and trans-TV inflow velocities: both inflows are acquired simultaneously, and the resulting display is amenable to both qualitative and quantitative assessment. The simultaneous rendering of velocities across both valves through respiratory cycles illustrates 2 important hemodynamic features of CP. The first is the discordant respirophasic change in inflow velocities across the valves, consistent with ventricular interdependence. This is akin to the data generated in the cardiac catheterization laboratory where left and right ventricular pressures are measured simultaneously during respiration to demonstrate increasing right heart pressures and decreasing left heart pressures during inspiration, and vice versa during expiration, so-called discordant respiratory variation (7, 16) (Figs. 3E and 3F). The second is the magnitude of respirophasic variation in trans-MV flow that demonstrates dissociation between intracardiac and intrathoracic pressures (12, 14, 16). This is identical to respiratory flow variation seen across the MV with Doppler TTE and decrease in the pulmonary capillary wedge pressure to left ventricular pressure gradient with inspiration with invasive catheterization (12, 14, 16) (Fig. 3F). Discordant respirophasic variation in the MV and TV flows was seen in all patients with CP, and none of the patients without CP or healthy controls (100% sensitivity and specificity).
The early MV inflow velocities during inspiration and expiration that we obtained with RT-PC CMR were slightly higher than those reported by Hatle et al. (12) and Oh et al. (14) in their original descriptions of Doppler echocardiography assessment of CP. However, TV inflow velocities were similar to those reported in both Doppler studies. In our study, the change in trans-MV E velocity between inspiration and expiration was 46%, which is between the 33% and 55% reported in previous Doppler studies (12, 14). The TV variation seen in our study of 60% was higher than the 44% reported by Hatle et al. (12) but similar to the 55% reported by Oh et al. (14). This variability is likely a reflection of the small sample sizes in all 3 studies.
In our patients, the trans-MV inflow velocity variation of >25% had a sensitivity and specificity of 100% for the diagnosis of CP. For trans-TV velocity, a 25% variation was inadequate to distinguish patients with and without CP. However, using a 45% cutoff had a sensitivity of 90% and specificity of 88%. The need for higher cutoff with TV flow is similar to that illustrated in the 2 landmark Doppler echocardiography studies in patients with CP (12, 14). As with Doppler echocardiography, this confirms that trans-MV flow velocity is a better marker of constrictive physiology that trans-TV variation (12). Most interestingly, in 2 patients referred for post-pericardiectomy CMR, the transatrioventricular valve flow variations seen preoperatively were not present post-operatively, further supporting the diagnostic value of this technique.
Other findings of CP with CMR such as pericardial thickness >4 mm, early diastolic septal bounce, respirophasic sepal shift, and IVC plethora were also demonstrated in many of our patients with CP. However, although many of these findings also support the diagnosis of CP, as has been demonstrated by others as well as in our study, there can be some overlap with patients without CP (5, 8–11). Therefore, all findings along with RT-PC imaging should be considered in combination to make a definite diagnosis of CP.
Study limitations
The limitations of this work include a small sample size, albeit comparable to that of the previous landmark echo-Doppler studies (12, 16, 23). The imaging plane for RT-PC acquisition was prescribed from the horizontal long-axis plane and would have had the expected displacement with respiration. However, this is not unique to CMR because even in Doppler echocardiography, the sample volume changes position with respiration (12). To minimize the impact of this motion on flow measurements, we confirmed that the MV and TV inflows were seen en face (Fig. 1) on each acquired frame during acquisition and also during analysis moved the ROI as necessary to ensure that it was at the center of the MV and TV on each frame. The effective temporal resolution with RT-PC was 55 ms, which may be lower than typical Doppler echocardiography settings. However, because we sought to measure respiratory cycle–based changes in velocities (which occur over hundreds of milliseconds), this is unlikely to have had a significant impact on our findings. Furthermore, when compared with key echocardiography studies in the literature (12, 14), the peak MV and TV inflow velocities obtained by RT-PC CMR in our study were similar to or higher than those obtained by Doppler echocardiography, confirming that true peak velocities were accurately recorded. All patients in our study had increased pericardial thickness (>4 mm); thus, we do not know the incremental value of RT-PC findings in patients with constriction with normal pericardial thickness (5–7). Demonstration of the classic physiological changes in constriction by CMR as shown in this study will be essential in making the diagnosis in such instances. The sensitivity and specificity discussed in this paper were for differentiating patients with CP from those without; further studies are needed to compare the sensitivity and specificity of this technique in differentiating constrictive from restrictive cardiomyopathy.
CONCLUSIONS
This study shows that RT-PC CMR provides noninvasive hemodynamic evidence of pericardial constriction, similar to simultaneous right and left heart catheterization or serial right and left heart inflow velocities by Doppler echocardiography. We found that the following 3 RT-PC hemodynamic criteria defined constrictive physiology: 1) respirophasic discordance in atrioventricular valve inflow velocity variation; 2) >25% variation in MV inflow velocities; and 3) >45% variation in TV inflow velocities. These hemodynamic data complement the high-resolution imaging of pericardial morphology afforded by CMR; its rapid acquisition allows it to be readily incorporated into existing CMR protocols for the assessment of CP. Larger studies are required to assess the utility of a comprehensive CMR protocol with both hemodynamic and morphological techniques to diagnose CP and to evaluate its ability to differentiate CP from restrictive cardiomyopathy.
Supplementary Material
Acknowledgments
Dr. Raman has received funding from NIH National Heart, Lung and Blood Institute R01 HL095563. Drs. Simonetti and Raman receive research support from Siemens. Dr. Yiu-Cho Chung was an employee of Siemens at the time of this work.
ABBREVIATIONS AND ACRONYMS
- CMR
cardiac magnetic resonance
- CP
constrictive pericarditis
- CT
computed tomography
- IVC
inferior vena cava
- MV
mitral valve
- ROI
region of interest
- RT-PC
real-time phase contrast
- TTE
transthoracic echocardiography
- TV
tricuspid valve
APPENDIX
For supplementary videos and their legends, please see the online version of this article.
Footnotes
All other authors have reported that they have no relationships relevant to the contents of this paper to disclose.
References
- 1.McCaughan BC, Schaff HV, Piehler JM, et al. Early and late results of pericardiectomy for constrictive pericarditis. J Thorac Cardiovasc Surg. 1985;89:340–50. [PubMed] [Google Scholar]
- 2.Verhaert D, Gabriel RS, Johnston D, Lytle BW, Desai MY, Klein AL. The role of multimodality imaging in the management of pericardial disease. Circ Cardiovasc Imaging. 2010;3:333–43. doi: 10.1161/CIRCIMAGING.109.921791. [DOI] [PubMed] [Google Scholar]
- 3.Yared K, Baggish AL, Picard MH, Hoffmann U, Hung J. Multimodality imaging of pericardial diseases. J Am Coll Cardiol Img. 2010;3:650–60. doi: 10.1016/j.jcmg.2010.04.009. [DOI] [PubMed] [Google Scholar]
- 4.Khandaker MH, Espinosa RE, Nishimura RA, et al. Pericardial disease: diagnosis and management. Mayo Clin Proc. 2010;85:572–93. doi: 10.4065/mcp.2010.0046. [DOI] [PMC free article] [PubMed] [Google Scholar]
- 5.Talreja DR, Edwards WD, Danielson GK, et al. Constrictive pericarditis in 26 patients with histologically normal pericardial thickness. Circulation. 2003;108:1852–7. doi: 10.1161/01.CIR.0000087606.18453.FD. [DOI] [PubMed] [Google Scholar]
- 6.Nishimura RA. Constrictive pericarditis in the modern era: a diagnostic dilemma. Heart. 2001;86:619–23. doi: 10.1136/heart.86.6.619. [DOI] [PMC free article] [PubMed] [Google Scholar]
- 7.Talreja DR, Nishimura RA, Oh JK, Holmes DR. Constrictive pericarditis in the modern era: novel criteria for diagnosis in the cardiac catheterization laboratory. J Am Coll Cardiol. 2008;51:315–9. doi: 10.1016/j.jacc.2007.09.039. [DOI] [PubMed] [Google Scholar]
- 8.Francone M, Dymarkowski S, Kalantzi M, Bogaert J. Real-time cine MRI of ventricular septal motion: a novel approach to assess ventricular coupling. J Magn Reson Imaging. 2005;21:305–9. doi: 10.1002/jmri.20259. [DOI] [PubMed] [Google Scholar]
- 9.Francone M, Dymarkowski S, Kalantzi M, Rademakers FE, Bogaert J. Assessment of ventricular coupling with real-time cine MRI and its value to differentiate constrictive pericarditis from restrictive cardiomyopathy. Eur Radiol. 2006;16:944–51. doi: 10.1007/s00330-005-0009-0. [DOI] [PubMed] [Google Scholar]
- 10.Hundley WG, Bluemke DA, Finn JP, et al. ACCF/ACR/AHA/NASCI/SCMR 2010 expert consensus document on cardiovascular magnetic resonance: a report of the American College of Cardiology Foundation Task Force on Expert Consensus Documents. J Am Coll Cardiol. 2010;55:2614–62. doi: 10.1016/j.jacc.2009.11.011. [DOI] [PMC free article] [PubMed] [Google Scholar]
- 11.Giorgi B, Mollet NR, Dymarkowski S, Rademakers FE, Bogaert J. Clinically suspected constrictive pericarditis: MR imaging assessment of ventricular septal motion and configuration in patients and healthy subjects. Radiology. 2003;228:417–24. doi: 10.1148/radiol.2282020345. [DOI] [PubMed] [Google Scholar]
- 12.Hatle LK, Appleton CP, Popp RL. Differentiation of constrictive pericarditis and restrictive cardiomyopathy by Doppler echocardiography. Circulation. 1989;79:357–70. doi: 10.1161/01.cir.79.2.357. [DOI] [PubMed] [Google Scholar]
- 13.Hancock EW. Differential diagnosis of restrictive cardiomyopathy and constrictive pericarditis. Heart. 2001;86:343–9. doi: 10.1136/heart.86.3.343. [DOI] [PMC free article] [PubMed] [Google Scholar]
- 14.Oh JK, Hatle LK, Seward JB, et al. Diagnostic role of Doppler echocardiography in constrictive pericarditis. J Am Coll Cardiol. 1994;23:154–62. doi: 10.1016/0735-1097(94)90514-2. [DOI] [PubMed] [Google Scholar]
- 15.Lin H, Ding Y, Chung Y, Simonetti O. Shared velocity encoding (SVE): a new method for real-time velocity measurement high temporal resolution. J Cardiovasc Magn Reson. 2009;11(Suppl 1):O81. [Google Scholar]
- 16.Hurrell DG, Nishimura RA, Higano ST, et al. Value of dynamic respiratory changes in left and right ventricular pressures for the diagnosis of constrictive pericarditis. Circulation. 1996;93:2007–13. doi: 10.1161/01.cir.93.11.2007. [DOI] [PubMed] [Google Scholar]
- 17.Kellman P, Epstein FH, McVeigh ER. Adaptive sensitivity encoding incorporating temporal filtering (TSENSE) Magn Reson Med. 2001;45:846–52. doi: 10.1002/mrm.1113. [DOI] [PubMed] [Google Scholar]
- 18.Lin H. Biomedical Engineering PhD Thesis. Ohio State University; 2009. Real-time flow quantification techniques in cardiovascular MRI applications; p. 240. [Google Scholar]
- 19.Oh JK, Seward JB, Tajik AJ. Pericardial diseases. In: Oh JK, editor. The Echo Manual. 3rd. Rochester, MN: Scientific Publications; 2006. pp. 289–309. [Google Scholar]
- 20.Khandaker MH, Espinosa RE, Nishimura RA, et al. Pericardial disease: diagnosis and management. Mayo Clin Proc. 2010;85:572–93. doi: 10.4065/mcp.2010.0046. [DOI] [PMC free article] [PubMed] [Google Scholar]
- 21.Ling LH, Oh JK, Tei C, et al. Pericardial thickness measured with transesophageal echocardiography: feasibility and potential clinical usefulness. J Am Coll Cardiol. 1997;29:1317–23. doi: 10.1016/s0735-1097(97)82756-8. [DOI] [PubMed] [Google Scholar]
- 22.Masui T, Finck S, Higgins CB. Constrictive pericarditis and restrictive cardiomyopathy: evaluation with MR imaging. Radiology. 1992;182:369–73. doi: 10.1148/radiology.182.2.1732952. [DOI] [PubMed] [Google Scholar]
- 23.Ha JW, Oh JK, Ling LH, Nishimura RA, Seward JB, Tajik AJ. Annulus paradoxus: transmitral flow velocity to mitral annular velocity ratio is inversely proportional to pulmonary capillary wedge pressure in patients with constrictive pericarditis. Circulation. 2001;104:976–8. doi: 10.1161/hc3401.095705. [DOI] [PubMed] [Google Scholar]
Associated Data
This section collects any data citations, data availability statements, or supplementary materials included in this article.