

Abstract
We investigated the sequence-dependent cellular uptake of spherical nucleic acid nanoparticle conjugates (SNAs). This process occurs by interaction with class A scavenger receptors (SR-A) and caveolae-mediated endocytosis. It is known that linear poly(guanine) (poly G) is a natural ligand for SR-A, and it has been proposed that interaction of poly G with SR-A is dependent on the formation of G-quadruplexes. Since G-rich oligonucleotides are known to interact strongly with SR-A, we hypothesized that SNAs with higher G contents would be able to enter cells in larger amounts than SNAs composed of other nucleotides, and as such we measured cellular internalization of SNAs as a function of constituent oligonucleotide sequence. Indeed, SNAs with enriched G content show the highest cellular uptake. Using this hypothesis, we chemically conjugated a small molecule (camptothecin) with SNAs to create drug-SNA conjugates and observed that poly G SNAs deliver the most camptothecin to cells and have the highest cytotoxicity in cancer cells. Our data elucidate important design considerations for enhancing the intracellular delivery of spherical nucleic acids.
Keywords: spherical nucleic acids, sequence-specific, cellular uptake, guanine, nanoparticles
1. Introduction
Spherical nucleic acid nanoparticle conjugates (SNAs) are a novel class of bionanomaterials that exhibit fundamentally different properties compared to linear nucleic acids. They are composed of highly oriented DNA oligonucleotide strands that are densely packed onto the surface of a nanoparticle core.[1] Unlike single-stranded DNAs, SNAs can naturally enter mammalian cells without the aid of cationic or lipophilic transfection agents despite their high negative charge.[2] The robust cellular uptake properties of SNAs offer the potential for the development of intracellular diagnostic[3] and gene regulation[4] tools without the toxicity or immune responses traditionally associated with cationic or lipophilic agents.[5] Indeed, the ability of SNAs to regulate genes of interest in vitro and in vivo has been demonstrated.[6, 7] Early mechanistic studies have identified class A scavenger receptors (SR-A) as the primary cellular receptors responsible for the recognition of SNAs, and the binding of these constructs to SR-A leads to caveolae-mediated endocytosis.[8] However, little is known about the nature of the biochemical interaction or the dependence of this interaction on oligonucleotide sequence. Linear nucleic acids enriched in guanine (G) are naturally recognized by SR-A, which has been proposed to be due to their ability to fold into secondary structures known as G-quadruplexes.[9] In contrast, linear polymers of adenine (A), thymine (T), and cytosine (C) do not fold into secondary structures that are recognized by SR-A, and as such, they are not natural ligands.[9] Because of their multivalent architecture, the cellular interaction of SNAs is dependent not only on the size of the nanostructure, but also on ligand presentation,[10, 11] and SNAs have been shown to enter cells as intact constructs.[12] Thus, we hypothesize that SNAs are able to enter cells without ancillary transfection agents because the SNA architecture mimics this secondary structure formation. Indeed, it has been shown that G-quartets are able to form on G-rich SNAs.[11] Additionally, we hypothesize that oligonucleotide sequence plays an important role in the interaction of SNAs with SR-A and subsequent cellular uptake. Here, we investigate the enhanced cellular uptake of G-rich SNAs in four cell types, A549 (human lung adenocarcinoma epithelial), NIH-3T3 (mouse fibroblasts), C166 (mouse endothelial), and HaCaT (human keratinocytes). In addition, we study the consequences of sequence-dependent cellular uptake by designing SNAs loaded with DNA-chemotherapeutic conjugates and increase the delivery of camptothecin chemotherapeutic molecules to A549 cells and subsequent cytotoxicity with G-rich SNAs compared to SNAs enriched in A, T, and C.
2. Results and Discussion
2.1. Nucleobase type on SNAs dictates loading and thickness of the DNA oligonucleotide shell on the surface of gold nanoparticle
We first prepared SNAs composed of different nucleobase types (A, T, C, or G) by adding the same amounts of alkylthiol-modified, 30-base long, single-stranded DNA oligonucleotides (ssDNAs) of different nucleobase types (Figure 1a, see Table S1 for sequence information) into an aqueous suspension of citrate-capped 10 nm diameter AuNPs. To prepare SNAs enriched in C (poly C SNAs) and G (poly G SNAs), we deliberately inserted Ts at regular intervals along the linear polymers of C and G, yielding sequences of (CCT)10and (GGT)10, respectively. For poly C SNAs and poly G SNAs, these design features attenuate the challenges of synthesizing linear poly C and poly G sequences, which is made difficult due to the formation of i-motifs[13] and G-quadruplexes.[14] Linear polymers of A and T do not naturally fold into stable secondary structures, negating the need to dilute the linear polymers of A and T with another nucleobase when we prepared SNAs enriched in A (poly A SNAs) and T (poly T SNAs). By dynamic light scattering measurements, all SNAs possess a hydrodynamic diameter of 22 ± 4 nm, suggesting a thickness of 5–8 nm for the oligonucleotide shell (Figure S1). The variation in thickness amongst the poly A, poly T, poly C, and poly G SNAs is likely due to variation in loading (vide infra). By UV-Vis spectroscopy, all SNAs are generally monodisperse in size, and exhibit a red-shift of ~4 nm in the surface plasmon peak compared to unmodified AuNPs (524 nm vs. 520 nm) due to changes in the local refractive index upon the covalent attachment of the oligonucleotide shell[15] (Figure S2). We then measured oligonucleotide loading as a function of nucleobase type by preparing SNAs whose oligonucleotides contain a Cy5 fluorophore at their 5’ end (Figure S3). Given a constant oligonucleotide length of 30 bases, SNAs enriched in pyrimidine bases (i.e., C and T) have noticeably higher oligonucleotide loading, whereby poly T SNAs and poly C SNAs have ~180 ssDNAs and ~140 ssDNAs per AuNP, respectively. By contrast, SNAs enriched in purine bases have lower oligonucleotide loading: poly G SNAs and poly A SNAs have only ~75 ssDNAs and ~45 ssDNAs per AuNP, respectively (Figure 1a). To directly visualize the oligonucleotide shell by transmission electron microscopy (TEM), we utilized a uranyl acetate staining protocol for SNAs.[16] In agreement with the loading data, the oligonucleotide coverage for poly T SNAs is the densest among all nucleobase types tested, as evidenced by their uniform oligonucleotide shell of 4–6 nm in dry thickness in the entire circumference of the AuNPs (Figure 1b). Chen et al. used single-molecule FRET (smFRET) and small-angle X-ray scattering (SAXS) to demonstrate that the end-to-end distance of a single-stranded poly T DNA of 40 bases long (T40) is ~6.6 nm in the presence of physiological levels of salt (150 mM NaCl).[17] Thus, the dry shell thickness of poly T SNAs as revealed by the TEM images suggests that the poly T DNA strands are approaching the maximum loading afforded by the curved surface of an AuNP when they radially extend away from the center of the AuNP. Poly A SNAs possess the thinnest oligonucleotide shell of merely 1–2 nm in thickness, but their shells are still uniform. Given their intermediate oligonucleotide loading, poly C SNAs and poly G SNAs have 2–4 nm thick oligonucleotide shells, but their shells are not as uniform as poly T SNAs and poly A SNAs. Although this technique is subject to drying effects, the data are in agreement with results from oligonucleotide loading studies (Figure 1a). However, it should be noted that TEM can only provide a qualitative analysis of DNA loading; measuring loading by the use of Cy5-labeled oligonucleotides is the most quantitative approach. In brief, the oligonucleotide loading and TEM imaging data are consistent with literature precedents that pyrimidine bases (C and T) adsorb to the gold surface less strongly than their purine counterparts (A and G),[18–23] supporting the idea that the former extend away from the gold surface whereas the latter interact with the surface.
Figure 1.

Characterization of SNAs. a) The table lists the loading of oligonucleotides on a 10 nm gold nanoparticle using a fluorescence-based assay. Poly T SNAs contain the highest loading among all nucleobase types, whereas poly A SNAs have the lowest. b) Staining of SNAs by uranyl acetate clearly delineates the DNA oligonucleotide shell (white) around the gold nanoparticle core (black) by TEM imaging. The thickness of the shell correlates with the oligonucleotide loading data obtained from the fluorescence-based assay. Scale bar = 50 nm.
2.2. Poly G SNAs enter multiple mammalian cell types in the highest amounts among all nucleobase types tested
We next monitored the cellular uptake kinetics of SNAs of different nucleobase types by inductively coupled plasma mass spectrometry (ICP-MS). We chose C166 cells because of their expression of SR-A,[8] a key receptor that mediates the cellular uptake of SNAs (Figure 2a). After 2 h of incubation, poly G SNAs exhibit the highest level of cellular association among all nucleobase types tested, accumulating 5 × 10⁵ particles per cell. In contrast to poly G SNAs, poly T SNAs show over five-fold lower cellular association, the lowest level of cellular association among all nucleobase types (p < 0.001). Poly A and poly C SNAs exhibit intermediate levels of cellular association compared to poly T SNAs and poly G SNAs (p < 0.001). However, ICP-MS, a technique that allows for sensitive quantification of the bulk content of gold associated with cells, does not provide any information on the intracellular distribution of SNAs. Therefore, we utilized TEM to determine whether SNAs enter cells or merely associate with the cell membrane (Figure 2b). After 2 h of incubation with cells, SNAs composed of all nucleobase types can enter C166 cells, as evidenced by their accumulation inside either the cytosol or early endosomes. In agreement with the ICP-MS data, representative TEM images show that poly G SNAs are the most abundant in the cell among all nucleobase types, both in terms of number of particle clusters per cross-sectional area of the cell and number of particles per cluster (typically >100 SNAs per cluster). By contrast, poly A SNAs, poly C SNAs, and poly T SNAs enter cells in considerably smaller amounts than poly G SNAs (<20 SNAs per cluster), although TEM images do not permit precise quantification of particles in the cell. In summary, when the constituent oligonucleotide strands are kept constant at 30 bases long, incorporation of a higher fraction of Gs than other nucleobase types (i.e., A, C, T) maximizes the delivery of SNAs to C166 cells. We utilized circular dichroism in order to investigate the ability of poly G SNAs to form G-quadruplexes, which are hypothesized to enhance the interaction of poly G SNAs with SR-A. The circular dichroism spectrum of poly G SNAs shows a shoulder at 231 nm and a peak at 260 nm, which indicate the presence of G-quadruplexes[9] (Figure S4). In order to ensure that enhanced cellular association of poly G SNAs is not due to the effects of aggregation and sedimentation, their colloidal stability in cell culture conditions was assessed. After 2 h in OptiMEM, poly G SNAs show no evidence of aggregation, indicating that sedimentation is not the primary reason for enhanced cellular association (Figure S5). To ascertain if such G-dependent uptake is only applicable to C166 cells, we further tracked the cellular uptake kinetics of SNAs for three other mammalian cell types, namely HaCaT, 3T3, and A549 (Figure 2c). These cell lines, in conjunction with C166, have a range of expression levels for SR-A; in descending order of expression levels, they are HaCaT, C166, 3T3, and A549.[8] Consistent with the uptake data for C166 cells, poly G SNAs demonstrate the maximal extent of association for A549 cells (p < 0.001), 3T3 cells (p < 0.001), and HaCaT cells (p < 0.001), exhibiting 4–10 fold higher cellular association than SNAs composed of other nucleobase types. Remarkably, cellular association of poly G SNAs is also positively correlated with the expression level of SR-A; when incubated with the same concentration of poly G SNAs, HaCaT, 3T3, and A549 cells exhibit highest, intermediate, and lowest cellular association, respectively. Pharmacological inhibition of SR-A by fucoidan reduces the cellular uptake of poly A, poly T, poly C, and poly G SNAs in C166 cells by more than 80% (Figure S6). Thus, incorporation of Gs maximizes the delivery of SNAs to multiple mammalian cell types in a manner that is dependent on SR-A. In addition, these data show that oligonucleotide loading does not dictate the cellular uptake kinetics when the nucleobase type is not kept constant; despite their lower oligonucleotide loading, poly G SNAs enter cells in higher amounts than poly T SNAs.
Figure 2.
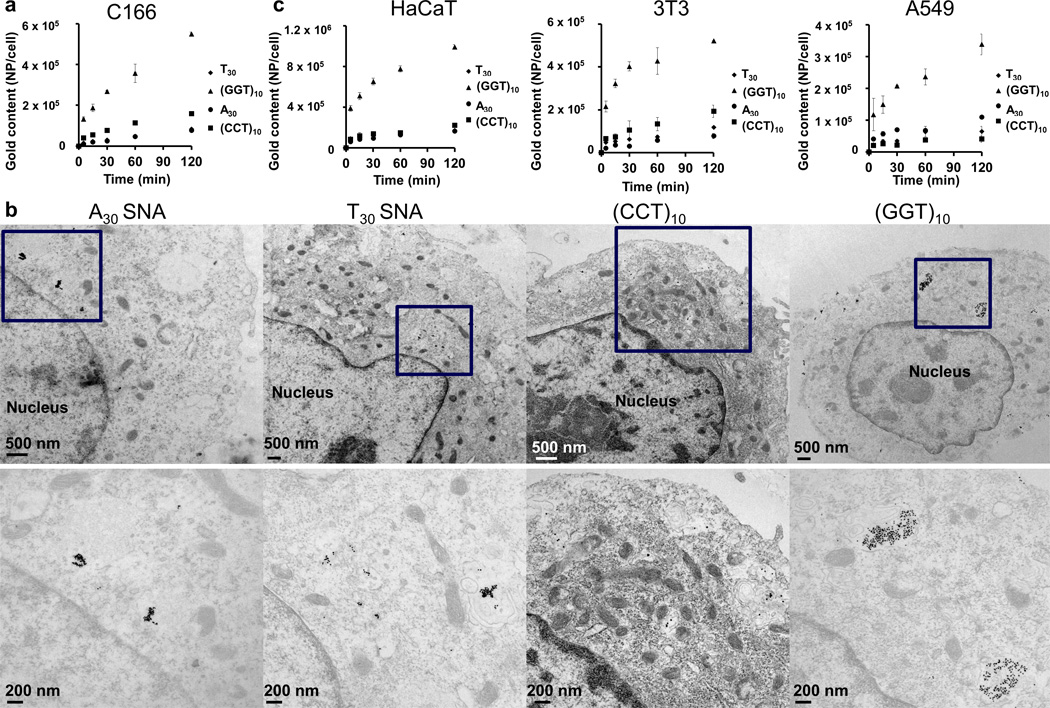
Cellular uptake of SNAs. a) Poly G SNAs show the highest association with C166 cells, 4–10 times higher than SNAs composed of other nucleobase types (p < 0.001). b) By TEM imaging, poly G SNAs exhibit the highest accumulation inside C166 cells, as evidenced by their widespread distribution throughout the cytosol as large clusters (>100 per clusters). By contrast, SNAs composed of other nucleobase types either accumulate in more confined regions of the cytosol or appear in clusters that contain fewer particles (<20 particles per cluster). The bottom row features enlarged images of the boxed regions of the top row. c) Poly G SNAs also demonstrate the highest association with three other cell lines beside C166, including, in descending order of expression level for SR-A, HaCaT (immortal human keratinocyte), 3T3 (mouse fibroblast), and A549 (human lung epithelial adenocarcinoma). For all cell types, poly G SNAs exhibit 3–5 times higher association with cells than SNAs of other nucleobase types (p < 0.001). Association of poly G SNAs with cells positively correlates with the expression level of SR-A for the same cell types. Error bars denote the standard deviation from triplicate measurements.
2.3. The poly G shell maximizes intracellular delivery regardless of core composition
In order to prove that the poly G shell of poly G SNAs facilitates increased cellular uptake compared to poly A, poly T, and poly C SNAs, we performed a competition assay with T-rich SNAs and poly G SNAs with different core compositions, either 5 nm AuNPs or cadmium selenide (CdSe) quantum dots (QDs) (see Table S2 for sequence information). We synthesized the AuNP-SNAs and QD-SNAs using a previously described strategy.[24] In one set of experiments, C166 cells were co-treated with equal concentrations of T-rich QD-SNAs and poly G AuNP-SNAs. In another set of experiments, cells were co-treated with equal concentrations of T-rich AuNP-SNAs and poly G QD-SNAs. We then used confocal microscopy to track the fluorescent signal of the QDs that entered cells. C166 cells treated with T-rich QD-SNAs and poly G AuNP-SNAs show very little intracellular fluorescence. However, C166 cells treated with T-rich AuNP-SNAs and poly G QD-SNAs show significantly higher intracellular fluorescence (Figure 3a), indicating a higher uptake of SNAs with a poly G shell into C166 cells. To further confirm this idea, we used ICP-MS to analyze the Au content and Cd content in C166 cells treated with T-rich AuNP-SNAs or QD-SNAs alone, poly G AuNP-SNAs or QD-SNAs alone, a combination of T-rich AuNP-SNAs and poly G QD-SNAs, and a combination of T-rich QD-SNAs and poly G AuNP-SNAs. C166 cells treated with poly G AuNP-SNAs have 3 times higher Au content than cells treated with T-rich AuNP-SNAs (p < 0.001). Likewise, cells treated with poly G QD-SNAs show three-fold higher Cd content than cells treated with T-rich QD-SNAs (p < 0.001) (Figure 3b). Cells treated with poly G AuNP-SNAs and T-rich QD-SNAs have higher Au content compared to Cd content, and this trend is reversed for cells treated with T-rich AuNP-SNAs and poly G QD-SNAs (p < 0.001) (Figure 3b). This competitive cellular uptake assay shows that SNAs with a poly G shell preferentially enter cells regardless of core composition, indicating that the poly G shell has greater affinity for cell surface receptors.
Figure 3.

Dependence of uptake on poly G shell. a) By confocal microscopy, poly G QD-SNAs (red) show higher accumulation in C166 cells compared to T-rich QD-SNAs. Scale bar = 10 µm. b) ICP-MS analysis of the gold and cadmium content in C166 cells co-treated with T-rich AuNP-SNAs and poly G QD-SNAs as well as co-treated with T-rich QD-SNAs and poly G AuNP-SNAs shows that poly G AuNP-SNAs preferentially enter cells compared to T-rich QD-SNAs and poly G QD-SNAs preferentially enter cells compared to T-rich AuNP-SNAs (p < 0.001). Error bars denote the standard deviation from three independent experiments.
2.4. The most peripheral ~10 bases of oligonucleotides dictate the cellular uptake of SNAs
To characterize the cellular uptake properties from a geometric perspective, we investigated the fraction of DNA oligonucleotides that significantly contributes to the cellular uptake of SNAs. Again, we compared the cellular association of SNAs when all constituent oligonucleotides are kept constant at 30 bases (see Table S3 for sequence information). We first compared the cellular association between poly T SNAs and SNAs containing varying amounts of Gs at the 5’ end (in the form of repeating GGT units) and Ts at the 3’ end by ICP-MS. The poly T segment at the 3’ end of the DNA oligonucleotides allows for a near-constant oligonucleotide loading onto the surface of the AuNP. In general, cellular association of SNAs increases with increasing G content at the 5’ end of the constituent oligonucleotides (Figure 4a). It appears that a minimum of four GGT repeats at the 5’ end of the constituent oligonucleotides is necessary to significantly enhance cellular association (p < 0.001); addition of two GGT repeats does not substantially increase cellular association compared to poly T SNAs and the addition of more than four GGT repeats further enhances cellular association compared to poly T SNAs (p < 0.001). We also compared the cellular association of SNAs composed of oligonucleotides with GGT repeats either exposed at the 5’ end or buried in the middle of the strand (see sequence information in Table S3). Placing a T12 motif on the 5’ end to bury the GGT repeats in the middle of the DNA oligonucleotide strand reduced cellular association by ~70% when compared to the case in which GGT repeats are exposed at the 5’ end, effectively curbing the superior effect of the GGT repeats on cellular uptake of SNAs (p < 0.001) (Figure 4b). These observations led us to hypothesize that approximately 10 bases at the 5’ end of the 30-base long constituent DNA oligonucleotides primarily dictate the cellular uptake properties of SNAs. Besides increasing the cellular uptake of poly T SNAs via the incorporation of more Gs, we also probed the portion of the SNA nanostructure most relevant to cellular uptake of poly T SNAs. To this end, we constructed SNAs that contain varying lengths of abasic spacers at the 5’ end of constituent DNA oligonucleotides (see sequence information in Table S2). These abasic spacers include dSpacer, which does not contain a nucleobase, and C3 spacer, which has neither a nucleobase nor a ribose unit. SNAs with higher abasic spacer contents show ~75% lower cellular association compared to poly T SNAs (Figure4c and 4d) that levels off when more than 10 abasic spacer units are added to the 5’ end (p < 0.001). Again, these data demonstrate that approximately one-third of the constituent oligonucleotide strands (10 out of a total of 30 bases at the 5’ end) exposed at the most peripheral part of the SNA nanoparticle are most geometrically essential in determining its cellular association. They also reaffirm that the nucleobase, but not the phosphate backbone or ribose units, are the biochemically active components that dictate the cellular association of SNAs.
Figure 4.
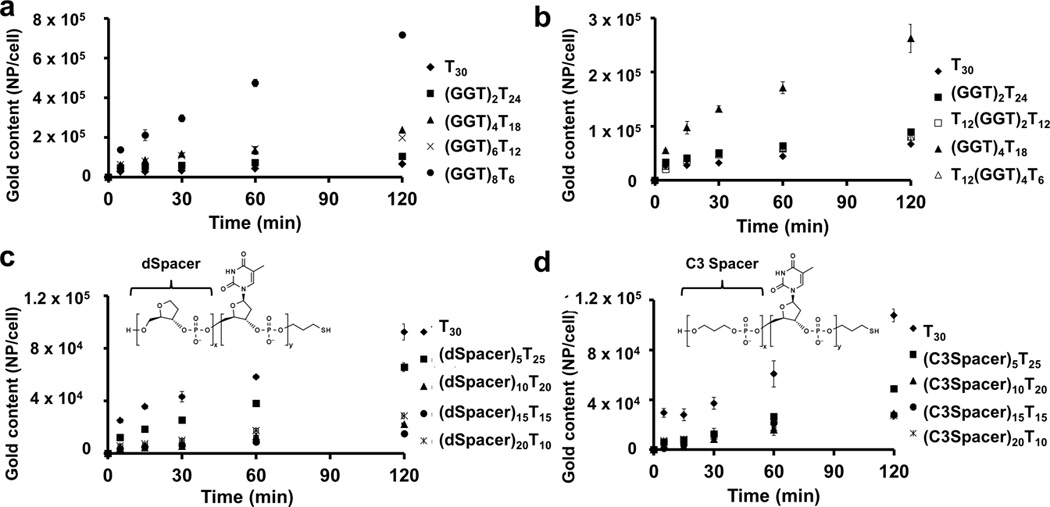
Length of oligonucleotide strand affecting cellular uptake of SNAs. a) Increased guanine (G) content at the 5’ end of constituent oligonucleotides increases cellular association of SNAs with C166 cells (p < 0.001). A minimum of four GGT repeating units is necessary to enhance cellular association of SNAs when compared to poly T (T30) SNAs. b) Burial of the GGT repeating units in the middle of the constituent oligonucleotides negates the enhancement in cellular association (p < 0.001). c) Increasing dSpacer units (which do not have a nucleobase) at the 5’ end of constituent DNA oligonucleotides reduces cellular association of SNAs up to 75% (p < 0.001). d) Increasing C3 Spacer units (which have neither a nucleobase nor a ribose) at the 5’ end of constituent DNA oligonucleotides reduces cellular association of SNAs up to 75% (p < 0.001). Error bars denote the standard deviation from triplicate measurements.
2.5. Poly G SNAs can maximize the intracellular delivery of a small molecule chemotherapeutic (e.g. camptothecin) to cancer cells
In addition to empirical data afforded by ICP-MS measurements and TEM imaging, we sought to provide functional evidence that poly G SNAs enter mammalian cells most effectively out of all nucleobase types by demonstrating that an increase in cellular uptake of drug-containing SNAs corresponds to an increase in their cytotoxicity against cancer cells. As a proof-of-concept, we prepared camptothecin-containing SNAs (CPT-SNAs) by covalently attaching camptothecin (CPT), a small-molecule chemotherapeutic agent, to the most peripheral position of their constituent oligonucleotides and subsequently examined their ability to kill cancer cells as a function of nucleobase type. A549 human lung adenocarcinoma epithelial cells (as discussed in Figure 2c) were chosen as the model cell line because of their low expression of SR-A and caveolin-1, both of which are essential proteins for the cellular uptake of SNAs.[8] Given the modest degree of cellular uptake of SNAs by A549 cells, any observable cytotoxicity highlights the potency of CPT-SNAs as a function of nucleobase type. To attach CPT molecules onto DNA strands, we followed literature precedent to react the –OH group of CPT with an azide-bearing linker to synthesize camptothecin-azide (CPT-N3).[25] We utilized copper-free click chemistry for coupling CPT-N3 directly onto bifunctional ssDNAs that bear a dibenzocyclooctyl (DBCO) group on one end as well as a thiol group on the other. The resultant conjugate, camptothecin-DNA-thiol (CPT-DNA-SH), can then be covalently attached to the surface of AuNPs as previously described, yielding CPT-SNAs (Figure 5a and S7). Using this approach, we prepared CPT-poly A SNAs, CPT-poly T SNAs, CPT-poly C SNAs, and CPT-poly G SNAs. Given that the oligonucleotide loading for poly T SNAs and poly C SNAs is significantly higher than that for poly A SNAs and poly G SNAs (as discussed in Figure 1), we intentionally diluted the CPT-T30-SH strands with unmodified T30-SH strands and diluted the CPT-(CCT)10-SH strands with unmodified (CCT)10–SH strands as we functionalized the strands onto AuNPs, in order to obtain a similar loading of CPT molecules on SNAs composed of all nucleobase types, which allows us to directly compare the effect of enhanced cellular uptake of poly G SNAs on CPT delivery. Indeed, the loading of camptothecin molecules per particle was determined to be approximately equal (~55 ± 15 CPT molecules per AuNP) (Figure 5b). We next investigated the effect of nucleobase type on the uptake of CPT-SNAs by A549 cells by measuring the gold content associated with the cells using ICP-MS. After incubation for 9 h and 18 h, CPT-poly G SNAs show 6–9 fold higher association with A549 cells than CPT-SNAs composed of other nucleobase types (p < 0.001). This observation reinforces our previous conclusion that the 10 most peripheral bases of DNA oligonucleotides covalently functionalized on the surface of AuNPs are most significant in dictating the cellular uptake properties of SNAs. That is, a small-molecule drug placed at the periphery of SNAs does not significantly interfere with the interaction between the DNA oligonucleotides and cell-surface SR-A. We further incubated CPT-SNAs with A549 cells for 18 h, replenished with fresh nanoparticle-free medium, and let the cells grow for an additional 54 h. After 72 h, the gold content associated with the cells is not significantly different from the gold content associated with cells after 18 h, implying little appreciable exocytosis of CPT-SNAs (Figure 5c). Besides tracking the AuNP core of CPT-SNAs by ICP-MS, we visualized the distribution of CPT in A549 cells by confocal imaging, taking advantage of the fluorescent emission of the CPT molecule at 440 nm.[26] After incubation of CPT-SNAs with A549 cells for 18 h, we removed the particles, replenished with fresh medium, and imaged the cells 3 and 5 d after treatment. After 3 d, CPT-poly G SNAs show the highest intracellular accumulation of CPT among all nucleobase types tested. After 5 d, cells treated with CPT-poly G SNAs still show the highest fluorescence (Figure 5d). Based on the ICP-MS and confocal imaging data, we hypothesize that CPT-SNAs persist in cells for a sufficient period of time to release the CPT molecules gradually by the action of intracellular esterases and exert a cytotoxic effect.[27] To test this claim, we incubated 20 nM CPT-SNAs (or equivalently, ~1.1 µM CPT molecules) with different sequences with A549 cells for 18 h, replenished with fresh medium, and measured their viability several days later by using a modified MTT assay. Between 4 and 7 d after CPT-SNA treatment, CPT-poly G SNAs are significantly more cytotoxic than CPT-SNAs composed of other nucleobase types. After 7 d, cells treated with CPT-poly G SNAs show only approximately 20% cell viability compared to 80–100% viability for cells treated with CPT-SNAs composed of other nucleobase types (p < 0.01) (Figure 5e). As a negative control, we also incubated A549 cells with 20 nM CPT-free SNAs composed of all nucleobase types for 18 h and observed no appreciable cytotoxicity 7 d after treatment (Figure S8), confirming that the observed cytotoxicity induced by CPT-SNA treatment originates from the attached CPT molecule but not the SNA architecture itself. In addition, cells were stained with propidium iodide 6 d after treatment with CPT-SNAs to detect CPT-induced apoptosis. Flow cytometry of the stained cells reveals that CPT-(GGT)10 SNAs are the most cytotoxic (p < 0.01) (Figure 5f). To further ensure that CPT is active in the cells, we measured the amount of activated caspase 3, an apoptotic signaling protein that is known to be activated by CPT,[28] in cells by ELISA after 5 d. Cells treated with CPT-poly G SNAs show a higher amount of activated caspase 3 than cells treated with CPT-A30, CPT-T30, and CPT-(CCT)10 SNAs (Figure S9). In summary, CPT-poly G SNAs are significantly more potent than CPT-SNAs composed of other nucleobase types, as evidenced by increased delivery of CPT to cancer cells by poly G SNAs and increased cytotoxicity. This example underscores the functional advantage of G-dependent delivery and demonstrates the potential of delivering other therapeutic entities with greater efficiency.
Figure 5.
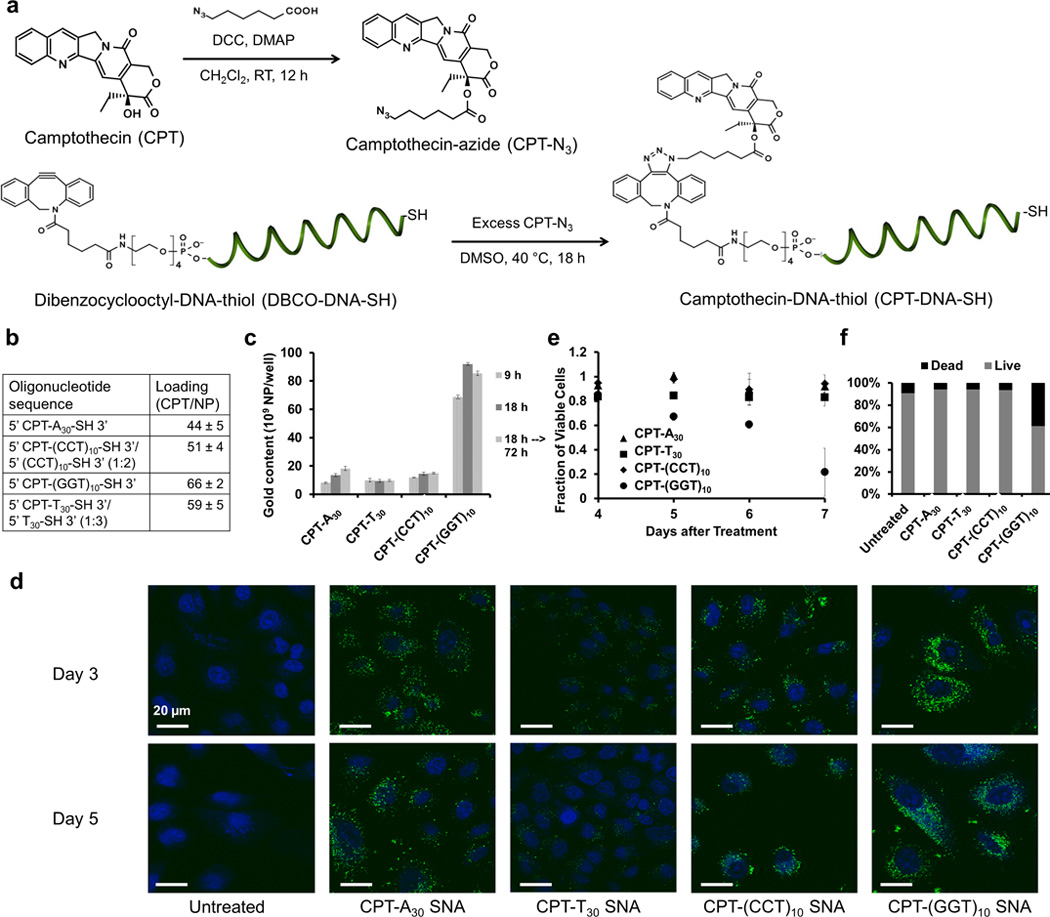
Delivery of camptothecin molecules using CPT-SNAs. a) The -OH group of the camptothecin molecule (CPT) is modified by a short bifunctional linker to form camptothecin azide (CPT-N3) by literature precedent.25 CPT-N3 is then coupled to dibenzocyclooctyl-DNA-thiol (DBCO-DNA-SH) by copper-free click chemistry to form camptothecin-DNA-thiol (CPT-DNA-SH). DCC = N’ N’-dicyclohexocarbodiimide, DMAP = 4-dimethylaminopyridine, CH2Cl-2 = dichloromethane, DMSO = dimenthyl sulfoxide. b) Measurements based on the fluorescence emission of CPT at 440 nm revealed that CPT-SNAs of all four nucleobase types contain 55 ± 15 CPT molecules per particle. c) By ICP-MS analysis of the gold content of the A549 cells treated with CPT-SNAs, CPT-poly G SNAs can enter cells in highest quantities among all nucleobase types tested (p < 0.001). The CPT-SNAs (at least the AuNP core) do not seem to leave the cells after the treatment. Error bars denote the standard deviation from triplicate measurements. d) By confocal imaging, CPT-poly G SNAs can deliver CPT molecules (green) into A549 cells in highest quantities among CPT-SNAs of all nucleobase types tested. Blue = nucleus. Scale bar = 20 µm. By the MTT assay (e) and flow cytometry analysis supported by propidium iodide staining (f), CPT-poly G SNAs are also most cytotoxic among CPT-SNAs of all nucleobase types tested after 6 days (p < 0.01). Error bars denote the standard deviation from four measurements.
3. Conclusion
In conclusion, we have developed a novel approach for increasing the uptake of SNA nanoparticle conjugates into cells. SNAs with a three-dimensional oligonucleotide shell containing a high G content are internalized by cells in higher amounts than SNAs that are primarily composed of A, T, and C, and G-rich SNAs can be used to enhance the intracellular delivery of both nucleic acid and small molecule drugs. This indicates that sequence composition is another tunable property, in addition to concentration, that can be used to tailor the intracellular delivery of SNAs, which is a fundamentally important finding because it reveals novel interactions between cells and SNA nanostructures. This strategy of tailoring sequence composition represents a powerful tool for nanoparticle-based diagnostic and therapeutic applications as it allows for the rational design of nanoparticle constructs with desired cellular uptake properties.
4. Experimental Section
Synthesis of DNA oligonucleotides
DNAs were synthesized on an MM48 Oligonucleotide synthesizer (BioAutomation) using standard solid-phase synthesis and reagents (Glen Research). Unless otherwise mentioned, all DNAs were purified using a ProStar HPLC (Varian) with a Microsorb C18 column (Varian). Table S1 contains detailed sequence information of the DNAs.
Preparation of spherical nucleic acid (SNA) nanoconjugates
Thiolated DNAs were added to 10 nm citrate-capped AuNPs at a concentration of 1 OD of DNA per mL of 10 nM AuNPs supplemented with 0.1% Tween 20. After stirring at room temperature for 1 h, the solution was aged with gradual additions of NaCl over 6 h to bring the final NaCl concentration to 0.5 M. Functionalized AuNPs were separated from free DNA strands via dialysis against Nanopure water using a 50-kDa Amicon MWCO membrane (Millipore). AuNP and DNA concentrations were determined by measuring their extinction at 524 nm and 260 nm, respectively, on a Cary 5000 UV-Vis spectrophotometer (Agilent). To prepare camptothecin-containing SNAs (CPT-SNAs; vide infra), the solution was aged with NaCl over 5 h to bring the final NaCl concentration to 0.3 M.
Measurement of oligonucleotide loading
10 µL of 10 nM Cy5-labeled SNAs of different nucleobase types was added into 100 µL of 1 M DTT. The mixture was incubated at 40 °C for 15 min with shaking, followed by centrifugation at 14000 × g to remove any gold precipitate. 100 µL of the supernatant was placed in a 96-well plate and the fluorescence signals (excitation: 633 nm; emission filter: 660–710 nm) were measured using a Synergy H4 Multimode Microplate Reader (Biotek). The concentration of oligonucleotides was determined by comparing to a calibration standard curve. Dividing oligonucleotide concentration by AuNP concentration (measured by UV-Vis spectroscopy at 520 nm) yields the oligonucleotide loading.
Visualization of the oligonucleotide shell
20 µL of 100 nM SNAs was drop-cast onto each glow-discharged, 200-mesh copper grid coated with carbon and formvar (Electron Microscopy Sciences). Upon drying, 20 µL of 2% uranyl acetate was added onto the grids to stain the oligonucleotide shell for 1 min. Excess uranyl acetate was blotted away using a piece of filter paper. The dried grids were imaged using a HD-2300 (Hitachi) microscope in TEM mode at a beam voltage of 80 kV. An Orius SC 1000 CCD camera (Gatan) was used to record the images.
Cellular uptake kinetics
Seeded in a 24-well plate at a population of 5 × 10⁴ cells per well 12 h in advance, C166 (mouse endothelial), 3T3 (mouse fibroblast), HaCaT (human keratinocyte), or A549 (human lung adenocarcinoma epithelial) cells were incubated with 0.3 mL of SNAs (10 nM in OptiMEM) per well at 37 °C and 5% CO2. SNAs were removed at different time points, followed by OptiMEM rinses, trypsinization for counting using a hemacytometer, and centrifugation at 8000 rpm for 5 min to form a pellet. Cell pellets were digested with 0.3 mL of 3% HCl in concentrated HNO3 at RT overnight for subsequent ICP-MS analysis.
ICP-MS
After adding 5 µL of 5 ppm indium (internal standard) and 5 mL of matrix solution (2% HCl and 2% HNO3), the Au-197 content of the resultant solution was measured by an X Series II ICP-MS (ThermoFisher) after subtracting the background gold content of untreated cells. Reported values represent mean ± SE from the average of three independent experiments.
TEM
Cell pellets were mixed gently in 0.2 mL of molten 2% agarose in 50 mM sodium phosphate buffer (pH = 8) at 40 °C for 5 min. The cell-agarose mixture was expunged into water at RT gently using a glass pipette to form an enrobed noodle-shaped jelly. Embedded in this agarose jelly, cells were fixed in 2.5% glutaraldehyde in 100 mM sodium cacodylate buffer (pH = 7.4), stained by 1% OsO4, and by 0.9% OsO4 and 0.3% K4Fe(CN)6, with all steps carried out at 4 °C for 2 h. After gradual dehydration with ethanol and propylene oxide, cell pellets were embedded in Epon 812 resins (Electron Microscopy Sciences). 80-nm-thick sections were deposited onto 200-mesh copper grids (EMS) and stained with 2% uranyl acetate (SPI Supplies) and Reynolds lead citrate for visualization under a JEM 1230 microscope (JEOL) using a beam voltage of 80 kV. An Orius SC 1000 CCD camera (Gatan) was used to record the images.
Synthesis of quantum dot and gold nanoparticle SNAs
Instead of covalently attaching DNAs strands directly to the nanoparticle surface, we first coated the CdSe quantum dots and 5 nm gold nanoparticles with an azide-bearing amphiphilic polymer, then coupled the DNA to the polymer-coated particles using strain-promoted azide–alkyne cycloaddition. Briefly, commercially available hydrophobic-ligand-capped nanoparticles were first functionalized with an amphiphilic polymer containing both hydrophobic alkyl chains and hydrophilic carboxylates and azide-modified ethylene glycol groups to solubilize the particles in aqueous solvent. The particles were then functionalized by azide-alkyne click chemistry with dibenzocyclooctyl (DBCO)-terminated DNA strands to produce a dense DNA shell around the nanoparticle.
QD-SNA and Au-SNA cellular uptake
C166 cells were seeded in a 24 well plate at a density of 5×10⁴ cells per well 24 hours before the experiment. Either poly G QD-SNAs and T-rich AuSNAs or poly G Au-SNAs and T-rich QD SNAs were simultaneously added to cells in 0.3 mL OptiMEM at a total SNA concentration of 10 nM. Cells were incubated with SNAs for 2 h at 37 °C and 5% CO2. SNAs were removed, followed by OptiMEM rinses, trypsinization for counting using a hemacytometer, and centrifugation at 8000 rpm for 5 min to form a pellet. Cell pellets were digested with 0.3 mL of 3% HCl in concentrated HNO3 at RT overnight for subsequent ICP-MS analysis. For imaging, cells were fixed in 3.7% formaldehyde after SNAs were removed and imaged by confocal microscopy.
Preparation of camptothecin-azide
The preparation for camptothecin-azide (CPT-N3) was adapted and modified from previously published procedures25. To an oven-dried 50 mL round bottomed flask with stirrer was added camptothecin (200 mg, 0.54 mmol), 6-azidohexanoic acid (170 mg, 1.08 mmol), 4-dimethylaminopyridine (8 mg), and dry dichloromethane (10 mL). The suspension was cooled to 0 °C and 1,3-dicyclohexylcarbodiimide (220 mg, 1.08 mmol) was added. The reaction mixture was stirred for 12 h under inert atmosphere, warming to RT, and then poured into 100 mL of ether. The ether suspension was cooled to 0 °C to precipitate dicyclohexylurea (DCU), and the solids removed by vacuum filtration. The filtrate was cooled to −40 °C, and the resulting yellow precipitate collected and recrystallized from methanol to afford 20-O-(6-azidohexanoyl)camptothecin (108 mg). The recovered DCU was washed repeatedly with methanol, yielding an additional crop of product (120 mg; total yield 228 mg, 87%).
Preparation of camptothecin-DNA-thiol (CPT-DNA-SH) conjugate
Single-stranded DNA of various sequences (Figure S4d), all possessing a dibenzocyclooctyl (DBCO) group at their 5’ end, were made by solid-state synthesis using a DBCO-TEG phosphoramidite (Glen Research, 10–1941). Purification of DNA-DBCO conjugates was performed using a 1200 Series HPLC (Agilent) by collecting the fraction with an absorbance peak of DBCO at 310 nm. To attach the CPT moiety to the DNA by copper-free click chemistry, 80 nmol of DNA-DBCO and 3 mg of CPT-azide (~100-fold excess) were dissolved in 1.5 mL of anhydrous dimethyl sulfoxide. The reaction was shaken continuously for 18 h at 40 °C. After that, 3.5 mL of deionized water was added to the mixture to precipitate out the excess CPT, followed by adding 5 mL of ethyl acetate to remove the CPT. The liquid-liquid extraction process was repeated for four more times. The aqueous phase (DNA-CPT in DMSO/water) was lyophilized to retrieve the product, whose chemical identity was confirmed by MALDI-ToF.
Confocal microscopy
Seeded in a 35 mm FluoroDish (World Precision Instruments), A549 cells were incubated with 20 nM of CPT-SNAs in OptiMEM for 18 h. CPT-SNAs were removed from cells and replaced with complete DMEM (DMEM supplemented by 10% fetal bovine serum and 1% penicillin/streptomycin) for either 3 or 5 d. The treated cells were rinsed with PBS, fixed in 3.7 % paraformaldehyde in PBS for 15 min, and stained with Hoescht nuclear stain for imaging under a Zeiss LSM 510 inverted confocal scanning microscope. The excitation and emission wavelengths of CPT were 370 nm and 440 nm, respectively.
MTT assay
Seeded in a 24-well plate at a population of 104 cells per well, A549 cells were incubated with 0.3 mL of SNAs (20 nM in OptiMEM) for 18 h. After that, SNAs were removed from the cells, which were then incubated with 1 mL of complete DMEM. After different durations of time, 20 µL of MTT stock solution (5 mg/mL MTT in PBS; Molecular Probes) was added into each well of cells that were pre-incubated with 300 µL of complete DMEM. After 2 h, 300 µL of SDS solution (200 mg/mL in 50% dimethyl formamide) was further added into each well, followed by thorough pipetting to re-suspend the cells. Upon overnight incubation, the cell lysate was centrifuged at 14000 × g for 10 min to remove any gold aggregates. The absorbance at 620 nm of the supernatant fraction collected from the cell lysate was determined using a Synergy H4 Multimode Microplate Reader (Biotek). Reported values represent mean ± SE from the average of three independent experiments.
Flow cytometry
Seeded in a 6-well plate at a population of 2 × 10⁴ cells per well, A549 cells were incubated with 1 mL of SNAs (20 nM in OptiMEM) for 18 h. Upon treatment, CPT-SNAs were removed and the cells grown on complete DMEM for 126 h. Cells were then trypsinized, washed, and suspended in 0.5 mL PBS. 0.5 mL 3.7% paraformaldehyde was added to the cell suspension from each well for 15 min. After two PBS rinses, cells were stained using 1 mL of propidium iodide (Santa Cruz Biotechnology, sc-3541) staining solution in PBS working solution (50 mg/mL). Stained samples were stored at 4 °C, protected from light prior to flow cytometry analysis. The fluorescence intensity of 10,000 cells was measured using a BD LSR II flow cytometer.
Statistical analysis
Statistical analysis was performed using ANOVA with post hoc analysis. P-values are reported where significant.
Supplementary Material
Acknowledgements
S.P.N. and C.H.J.C contributed equally to this work. This material is based upon work supported by the following awards. Center for Cancer Nanotechnology Excellence (CCNE) initiative of the National Institutes of Health (NIH) under Award No. U54 CA151880, AFOSR under Award No. FA9550-11-1-0275. C.H.J.C. acknowledges a postdoctoral research fellowship from The Croucher Foundation. S.P.N. and E.A. acknowledge the DoD, Air Force Office of Scientific Research, National Defense Science and Engineering Graduate (NDSEG) Fellowship, 32 CFR 168a. L.H. is a Howard Hughes Medical Institute International Student Research Fellow. O.J.G.M.G. acknowledges the Institute for Complex Molecular Systems, Eindhoven, The Netherlands, and the International Institute for Nanotechnology. ICP-MS measurements and confocal microscopy were performed at the Quantitative Bioelemental Imaging Center (QBIC) at Northwestern University. TEM imaging was performed both at the Biological Imaging Facility (BIF) and at the Electron Probe Instrumentation Center of the NU Atomic and Nanoscale Characterization Experimental Center at Northwestern University. Circular dichroism spectroscopy was performed at the Keck Biophysics Facility at Northwestern University. We thank C. Wilke from the BIF for assistance in ultramicrotomy.
Footnotes
Supporting Information is available from the Wiley Online Library or from the author.
Contributor Information
Suguna P. Narayan, International Institute of Nanotechnology, Department of Biomedical Engineering, Northwestern University, Evanston, IL 60208, USA
Chung Hang J. Choi, International Institute of Nanotechnology, Department of Chemistry, Northwestern University, Evanston, IL 60208, USA
Liangliang Hao, International Institute of Nanotechnology, Interdisciplinary Biological Sciences Program, Northwestern University, Evanston, IL 60208, USA.
Colin M. Calabrese, International Institute of Nanotechnology, Department of Chemistry, Northwestern University, Evanston, IL 60208, USA
Evelyn Auyeung, International Institute of Nanotechnology, Department of Materials Science and Engineering Northwestern University, Evanston, IL 60208, USA.
Chuan Zhang, International Institute of Nanotechnology, Department of Chemistry, Northwestern University, Evanston, IL 60208, USA.
Olga J.G.M. Goor, Institute for Complex Molecular Systems and Laboratory of Chemical Biology, Department of Biomedical Engineering, Eindhoven University of Technology, 5600 MB Eindhoven, The Netherlands
Chad A. Mirkin, Email: chadnano@northwestern.edu, International Institute of Nanotechnology, Department of Biomedical Engineering, Northwestern University, Evanston, IL 60208, USA.
References
- 1.Cutler JI, Auyeung E, Mirkin CA. J Am Chem Soc. 2012;134:1376–1391. doi: 10.1021/ja209351u. [DOI] [PubMed] [Google Scholar]
- 2.Rosi NL, Giljohann DA, Thaxton CS, Lytton-Jean AK, Han MS, Mirkin CA. Science. 2006;312:1027–1030. doi: 10.1126/science.1125559. [DOI] [PubMed] [Google Scholar]
- 3.Seferos DS, Giljohann DA, Hill HD, Prigodich AE, Mirkin CA. J Am Chem Soc. 2007;129:15477–15479. doi: 10.1021/ja0776529. [DOI] [PMC free article] [PubMed] [Google Scholar]
- 4.Giljohann DA, Seferos DS, Prigodich AE, Patel PC, Mirkin CA. J Am Chem Soc. 2009;131:2072–2073. doi: 10.1021/ja808719p. [DOI] [PMC free article] [PubMed] [Google Scholar]
- 5.Massich MD, Giljohann DA, Seferos DS, Ludlow LE, Horvath CM, Mirkin CA. Mol Pharm. 2009;6:1934–1940. doi: 10.1021/mp900172m. [DOI] [PMC free article] [PubMed] [Google Scholar]
- 6.Zheng D, Giljohann DA, Chen DL, Massich MD, Wang XQ, Iordanov H, Mirkin CA, Paller AS. Proc Natl Acad Sci U S A. 2012;109:11975–11980. doi: 10.1073/pnas.1118425109. [DOI] [PMC free article] [PubMed] [Google Scholar]
- 7.Jensen SA, Day ES, Ko CH, Hurley LA, Luciano JP, Kouri FM, Merkel TJ, Luthi AJ, Patel PC, Cutler JI, Daniel WL, Scott AW, Rotz MW, Meade TJ, Giljohann DA, Mirkin CA, Stegh AH. Sci Transl Med. 2013;5:209ra152. doi: 10.1126/scitranslmed.3006839. [DOI] [PMC free article] [PubMed] [Google Scholar]
- 8.Choi CHJ, Hao L, Narayan SP, Auyeung E, Mirkin CA. Proc Natl Acad Sci U S A. 2013;110:7625–7630. doi: 10.1073/pnas.1305804110. [DOI] [PMC free article] [PubMed] [Google Scholar]
- 9.Pearson AM, Rich A, Krieger M. J Biol Chem. 1993;268:3546–3554. [PubMed] [Google Scholar]
- 10.Giljohann DA, Seferos DS, Patel PC, Millstone JE, Rosi NL, Mirkin CA. Nano Lett. 2007;7:3818–3821. doi: 10.1021/nl072471q. [DOI] [PMC free article] [PubMed] [Google Scholar]
- 11.Chinen AB, Guan CM, Mirkin CA. Angew Chem Int Ed Engl. 2014 [Google Scholar]
- 12.Wu XA, Choi CHJ, Zhang C, Hao L, Mirkin CA. J Am Chem Soc. 2014;136:7726–7733. doi: 10.1021/ja503010a. [DOI] [PMC free article] [PubMed] [Google Scholar]
- 13.Gehring K, Leroy JL, Gueron M. Nature. 1993;363:561–565. doi: 10.1038/363561a0. [DOI] [PubMed] [Google Scholar]
- 14.Sen D, Gilbert W. Nature. 1988;334:364–366. doi: 10.1038/334364a0. [DOI] [PubMed] [Google Scholar]
- 15.Kumar S, Aaron J, Sokolov K. Nat Protoc. 2008;3:314–320. doi: 10.1038/nprot.2008.1. [DOI] [PubMed] [Google Scholar]
- 16.Huxley HE, Zubay G. J Biophys Biochem Cytol. 1961;11:273–296. doi: 10.1083/jcb.11.2.273. [DOI] [PMC free article] [PubMed] [Google Scholar]
- 17.Chen H, Meisburger SP, Pabit SA, Sutton JL, Webb WW, Pollack L. Proc Natl Acad Sci U S A. 2012;109:799–804. doi: 10.1073/pnas.1119057109. [DOI] [PMC free article] [PubMed] [Google Scholar]
- 18.Demers LM, Ostblom M, Zhang H, Jang NH, Liedberg B, Mirkin CA. J Am Chem Soc. 2002;124:11248–11249. doi: 10.1021/ja0265355. [DOI] [PubMed] [Google Scholar]
- 19.Hurst SJ, Lytton-Jean AKR, Mirkin CA. Analytical Chemistry. 2006;78:8313–8318. doi: 10.1021/ac0613582. [DOI] [PMC free article] [PubMed] [Google Scholar]
- 20.Storhoff JJ, Elghanian R, Mirkin CA, Letsinger RL. Langmuir. 2002;18:6666–6670. [Google Scholar]
- 21.Kimura-Suda H, Petrovykh DY, Tarlov MJ, Whitman LJ. J Am Chem Soc. 2003;125:9014–9015. doi: 10.1021/ja035756n. [DOI] [PubMed] [Google Scholar]
- 22.Opdahl A, Petrovykh DY, Kimura-Suda H, Tarlov MJ, Whitman LJ. Proc Natl Acad Sci U S A. 2007;104:9–14. doi: 10.1073/pnas.0608568103. [DOI] [PMC free article] [PubMed] [Google Scholar]
- 23.Hill HD, Millstone JE, Banholzer MJ, Mirkin CA. ACS Nano. 2009;3:418–424. doi: 10.1021/nn800726e. [DOI] [PMC free article] [PubMed] [Google Scholar]
- 24.Zhang C, Macfarlane RJ, Young KL, Choi CHJ, Hao L, Auyeung E, Liu G, Zhou X, Mirkin CA. Nat Mater. 2013;12:741–746. doi: 10.1038/nmat3647. [DOI] [PubMed] [Google Scholar]
- 25.Parrish B, Emrick T. Bioconjug Chem. 2007;18:263–267. doi: 10.1021/bc060201d. [DOI] [PubMed] [Google Scholar]
- 26.Zamai M, VandeVen M, Farao M, Gratton E, Ghiglieri A, Castelli MG, Fontana E, D'Argy R, Fiorino A, Pesenti E, Suarato A, Caiolfa VR. Mol Cancer Ther. 2003;2:29–40. [PubMed] [Google Scholar]
- 27.Cheng J, Khin KT, Jensen GS, Liu A, Davis ME. Bioconjug Chem. 2003;14:1007–1017. doi: 10.1021/bc0340924. [DOI] [PubMed] [Google Scholar]
- 28.Stefanis L, Park DS, Friedman WJ, Greene LA. J Neurosci. 1999;19:6235–6247. doi: 10.1523/JNEUROSCI.19-15-06235.1999. [DOI] [PMC free article] [PubMed] [Google Scholar]
Associated Data
This section collects any data citations, data availability statements, or supplementary materials included in this article.