

Abstract
Understanding the sites and mechanisms underlying respiratory rhythmogenesis is of fundamental interest in the field of respiratory neurophysiology. Previous studies demonstrated the necessary and sufficient role of preBötzinger complex (preBötC) in generating inspiratory rhythms in vitro and in vivo. However, the influence of timed activation of the preBötC network in vivo is as yet unknown given the experimental approaches previously used. By unilaterally infecting preBötC neurons using an adeno-associated virus expressing channelrhodopsin we photo-activated the network in order to assess how excitation delivered in a spatially and temporally precise manner to the inspiratory oscillator influences ongoing breathing rhythms and related muscular activity in urethane-anaesthetized rats. We hypothesized that if an excitatory drive is necessary for rhythmogenesis and burst initiation, photo-activation of preBötC not only will increase respiratory rate, but also entrain it over a wide range of frequencies with fast onset, and have little effect on ongoing respiratory rhythm if a stimulus is delivered during inspiration. Stimulation of preBötC neurons consistently increased respiratory rate and entrained respiration up to fourfold baseline conditions. Furthermore, brief pulses of photostimulation delivered at random phases between inspiratory events robustly and consistently induced phase-independent (Type 0) respiratory reset and recruited inspiratory muscle activity at very short delays (∼100 ms). A 200 ms refractory period following inspiration was also identified. These data provide strong evidence for a fine control of inspiratory activity in the preBötC and provide further evidence that the preBötC network constitutes the fundamental oscillator of inspiratory rhythms.
Key points
This study investigates the effects on ventilation of an excitatory stimulus delivered in a spatially and temporally precise manner to the inspiratory oscillator, the preBötzinger complex (preBötC).
We used an adeno-associated virus expressing channelrhodopsin driven by the synapsin promoter to target the region of the preBötC.
Unilateral optogenetic stimulation of preBötC increased respiratory rate, minute ventilation and increased inspiratory modulated genioglossus muscle activity.
Unilateral optogenetic stimulation of preBötC consistently entrained respiratory rate up to 180 breaths min–1 both in presence of ongoing respiratory activity and in absence of inspiratory activity.
Unilateral optogenetic stimulation of preBötC induced a strong phase-independent Type 0 respiratory reset, with a short delay in the response of 100 ms.
We identified a refractory period of ∼200 ms where unilateral preBötC optogenetic stimulation is not able to initiate the next respiratory event.
Introduction
The neural control of respiratory rhythms occurs in the brainstem and is produced by a rhythmogenic neural network within the region of the preBötzinger complex (preBötC). This area has been identified in rodents, large mammals and humans (Smith et al. 1991; Gray et al. 1999; Pagliardini et al. 2003; Wenninger et al. 2004; Thoby-Brisson et al. 2005; Schwarzacher et al. 2011). Although the precise cellular mechanisms of respiratory rhythm generation are unresolved (Feldman et al. 2013), the necessity and sufficiency of the preBötC for respiratory rhythm generation has been demonstrated in vivo and in vitro in experiments where preBötC neurons have been destroyed, temporally inactivated, or genetically deleted (Gray et al. 2001; Tan et al. 2008; Bouvier et al. 2010; Gray et al. 2010).
Breathing has to be coordinated with a host of other motor behaviours, and to do so it requires coordination of these behaviours and their sensory feedback with the moment-to-moment regulation of breathing. The ability to integrate this information, and consequently adapt respiratory rhythms, is therefore an essential property of the respiratory rhythm generator in order to pace respiration, integrate volitional breathing, maintain adequate levels of blood gases, and coordinate orofacial behaviours like vocalization, whisking, sniffing and swallowing (Dick et al. 1993; Gariepy et al. 2012; Moore et al. 2013, 2014).
Prior studies have investigated how different feedback mechanisms or structures that provide direct or indirect inputs to the preBötC region affect ongoing respiratory rhythms, in an attempt to demonstrate how afferent information such as peripheral and central chemoreceptors (Eldridge, 1972a,b; Eldridge et al. 1989; Paydarfar et al. 1998; Abbott et al. 2011), somatosensory inputs (Potts et al. 2005), superior laryngeal nerve activity (Oku & Dick, 1992), or the parafacial respiratory group (pFRG) (Pagliardini et al. 2011) influence the inspiratory oscillator and, consequently, ventilation.
Brief electrical stimulation of different structures can generate a phase-dependent (Type 1) or a phase-independent (Type 0) reset of the respiratory rhythms depending on the strength of the stimulus (Winfree, 2001). For example, carotid sinus nerve stimulation (Eldridge, 1972b; Paydarfar et al. 1998) generates Type 1 respiratory reset, with changes in inspiratory and expiratory time according to the phase of the respiratory cycle at which stimulus is delivered (Eldridge, 1972b). Electrical stimulation of either superior laryngeal nerve via a facilitatory mechanism, (Paydarfar et al. 1986; Oku & Dick, 1992), or midbrain reticular formation via an inhibitory mechanism, on the contrary, generates a phase-independent (Type 0) respiratory reset (Paydarfar & Eldridge, 1987). More recently, optogenetic stimulation has been used in place of electrical stimulation to demonstrate reset properties of the respiratory rhythms. Optogenetic stimulation of Phox2b cells in the retrotrapezoid nucleus (RTN) generates a Type 1 reset behaviour (Abbott et al. 2011), whereas Type 0 expiratory-driven respiratory reset was generated by optogenetic stimulation of the pFRG (Pagliardini et al. 2011).
Direct stimulation of the inspiratory oscillator has been obtained in the past via electrical or pharmacological manipulations of the preBötC region in vivo (Speck & Feldman, 1982; McCrimmon et al. 1986; Solomon et al. 1999; Wang et al. 2002), but these techniques lack precise spatial and/or temporal specificity and in these cases, a fine description of respiratory reset or entrainment properties is not available. Respiratory rhythms can also be entrained through paced RTN stimulation (Abbott et al. 2011) or somatic afferent electrical stimulation (Funk et al. 1992; Potts et al. 2005; Giraudin et al. 2012) up to 2 times the baseline frequency.
Here, using optogenetic techniques, we directly excited neurons of the preBötC in a temporally and spatially specific manner in order to deliver an excitatory stimulus directly to the core unit of inspiratory rhythmogenesis. We hypothesized that if an excitatory drive is necessary for rhythmogenesis, optogenetic stimulation of preBötC will strongly activate the network and consequently increase respiratory rate. In addition, we hypothesized that if excitatory connections between neurons of the respiratory oscillators are key for driving respiratory activity, a brief but synchronous excitation of the circuit elements would reset the rhythm and entrain it at very high rates with short delay while having little effect on ongoing respiratory rhythm if stimulus was delivered during inspiration. Our results indicate that photostimulation of the preBötC in vivo induced an instantaneous increase in breathing rate and was also able to entrain rhythm at very high frequencies (4-fold the ongoing frequency) as well as reset inspiratory rhythms with Type 0 characteristics. Furthermore, we identified the presence of a refractory period during and following inspiration when excitatory inputs are not capable of generating an additional inspiratory event.
Methods
Ethical approval
Animal care and experimental protocols were approved by the Health Science Animal Policy and Welfare Committees of the University of Alberta according to the guidelines established by the Canadian Council on Animal Care and it is in compliance with the guidelines of The Journal of Physiology (Drummond, 2009).
Viral injection into preBötC
An adeno-associated virus (AAV, serotype 2/5) that expresses channelrhodopsin (ChR2) and the fluorescent protein EYFP driven by the synapsin promoter (SYN-ChR2-EYFP) was produced, characterized and titrated at the University of North Carolina Virus Vector Core Facility, Chapel Hill, NC, USA (4 × 10¹² molecules ml–1). The same serotype virus that expresses EYFP driven by the synapsin promoter but lacks expression of the light-sensitive protein (SYN-EYFP, University of North Carolina Vector Core) was also used at the same concentration for control experiments.
Unilateral viral injection into the preBötC was performed in 270–320 g Sprague–Dawley rats under anaesthesia (ketamine (90 mg kg–1), and xylazine (10 mg kg−1), administered i.p.) using standard aseptic procedures. Rats were positioned on a stereotaxic frame with bregma 5 mm below lambda. The occipital bone was exposed and a small window was opened to perform viral injections. A glass pipette with external tip diameter of ∼30 μm was inserted into the preBötC and the adenovirus (500 nl) was delivered by controlled back-pressure injection (20 p.s.i., 15–35 ms pulses; PicoSpritzer III Parker, Milton, ON, Canada). Coordinates were as follows (in mm): +0.9 rostral, +2.0 lateral and −2.8 ventral to the obex. The electrode was left in place for 5 min after injection to minimize backflow of virus up the electrode track. Neck muscles and skin were sutured back at the end of the surgery and rats were allowed to recover with pain medication, food and water ad libitum for at least 2 weeks. The surgical procedures and viral injection produced no observable long term behavioural or respiratory effects.
Photostimulation experimental protocol
Two to three weeks after viral injection, rats were anaesthetized with isofluorane (2% in air) while the femoral vein was cannulated, and then urethane (1.5–1.7 g (kg body weight)−1) was gradually delivered i.v. to induce permanent and irreversible anaesthesia. Body temperature was kept constant at 37 ± 1°C with a servo-controlled heating pad (Harvard Apparatus, Holliston, MA, USA). Respiratory flow was measured via a tracheal cannula connected to a pressure transducer (F10L, GM Instruments, Kilwinning, UK) and signal was measured in millivolts (Valydine, Northridge, CA, USA). Tidal volume was obtained by integration of airflow amplitude and millivolt values were converted to millilitres of air by comparison with a 5-point calibration curve constructed by the experimenter at the time of the experiments (0.5–5 ml range). Coupled EMG wire electrodes (CoonerWire, Chatsworth, CA, USA) were implanted into diaphragm (DIA), genioglossus (GG) and abdominal (ABD) muscles. EMG wires were connected to differential amplifiers (AM Systems, Sequim, WA, USA) and activity was sampled at 2 kHz (Powerlab 16/35; AD Instruments, Colorado Springs, CO, USA). Rats were vagotomized at mid-cervical level and then positioned supine in a stereotaxic frame. The larynx was displaced, and the ventral surface of the occipital bone was exposed. The occipital bone was drilled to expose the ventral surface of the brainstem while the meninges overlying the brain tissue were left intact. The end of a 200 μm-diameter optical fibre connected to a 473 nm laser (IkeCool, Anaheim, CA, USA) was positioned ipsilaterally, touching the ventral surface of the brainstem. Distance from the preBötC region was therefore 300–500 μm, according to the histology and the Paxinos atlas. Laser power was set to deliver light at 10–12 mW. Timed photostimulations were delivered under the command of the LabChart7 acquisition software connected to the laser power supply. To find the position with the strongest response to laser stimulation in rats infected with SYN-ChR2-EYFP, the ventral surface was probed at 2 mm from the midline with trains of high frequency photostimulation (20 ms pulses at 20 Hz, × 300) at 1 min intervals (three times in each location) along the rostrocaudal axis with 500 μm step intervals. Only one or two rostrocaudal positions resulted in an increased respiratory frequency response according to the experimental procedure. Once the most responsive site was identified, either a single pulse of light stimulation (10 s) or a train of high frequency laser pulses (20 ms pulses at 20 Hz, × 300) were delivered several times to test for the respiratory response to photostimulation. Stimulation parameters were similar to what used in previous optogenetics studies on breathing control (Abbott et al. 2009; Pagliardini et al. 2011) and were identical for both SYN-ChR2-EYFP virus and SYN-EYFP experiments.
Entrainment responses were tested by delivering 15 brief photostimulations (150–250 ms in length) at increasing frequencies (0.7–3 Hz). Respiratory reset in rats infected with SYN-ChR2-EYFP was tested by delivering light pulses at random phase of the respiratory cycle (150 single light pulses, 100 ms to 1 s pulse length).
The ability to generate respiratory activity uniquely by photostimulation was tested in mechanically hyperventilated rats once they reached their apnoeic threshold. During this experimental procedure, rats were connected to the mechanical ventilator with the ventilation rate set at about 10–15 breaths min–1 above the rats respiratory rate baseline. Within a short time from the beginning of the hyperventilation protocol, rhythmic diaphragmatic EMG (DIAEMG) contractions were reduced and eventually lost. Once spontaneous breathing ceased, photostimulation (150–250 ms pulse length) was delivered to the preBötC at frequencies that varied between 0.7 and 3 Hz. Alternatively, a single 10 s light pulse or a train of photostimulation at high frequency (20 ms pulse length at 20 Hz) were delivered.
Four SYN-ChR2-EYFP preBötC rats, were treated with reserpine (10 mg kg−1), 12–18 h prior to the beginning of the optogenetic experiment, in order to reduce catecholaminergic influences on respiratory rhythmic activity. The behaviour of rats was monitored just prior to anaesthesia to ensure that catecholaminergic depletion took place (Clement et al. 2008).
Histology
At the end of each experiment, rats were transcardially perfused with 4% paraformaldehyde in phosphate buffer (PB). The brains were collected, post-fixed, and 50 μm brainstem transverse sections were cut with a VT1000 Vibratome (Leica, Wetzlar, Germany). Serial sections were either directly mounted on slides and coverslipped or immunoreacted for detection of specific neuronal markers (one section every 200 μm). Immunohistochemistry was performed according to the following protocol. Free-floating sections were rinsed in phosphate-buffered saline (PBS) and incubated with 10% normal donkey antiserum (NDS) and 0.3% Triton X-100 for 60 min to reduce non-specific staining and increase antibody penetration. Sections were incubated overnight with primary antibodies diluted in PBS containing 1% NDS and 0.2% Triton X-100. The following day, sections were washed in PBS, incubated with the specific secondary antibodies conjugated to the fluorescent probes (Cy3/Cy5-conjugated donkey anti-rabbit; Cy2-conjugated anti-chicken; Cy3-conjugated anti-mouse; Jackson ImmunoResearch, West Grove, PA, USA) diluted in PBS and 1% NDS for 2 h. Sections were further washed in PBS, mounted, and coverslipped with Fluorsave mounting medium (Millipore, Billerica, MA, USA).
The primary antibodies used for this study detected the following proteins: green fluorescent protein (GFP; raised in chicken; Aves Labs, Tigard, OR, USA dilution 1:1000), neuronal nuclear marker (NeuN; raised in mouse; Millipore, 1:500), the receptor for substance P (NK1R; raised in rabbit; Millipore, 1:1000), the tyrosine hydroxylase enzyme (TH; raised in rabbit; Millipore, 1:5000) the somatostatin peptide, (SST; raised in rabbit, Santa Cruz Biotechnology, Dallas, TX, USA 1:600) and the immediate early gene cFos (raised in rabbit, Millipore, 1:1000).
Slides were then observed under a LSM512 Zeiss confocal microscope with a × 20 magnification objective or a Leica DM5500B fluorescent microscope. Rostrocaudal acquisitions of serial sections were performed along the respiratory column, from the end of the lateral reticular nucleus to the caudal tip of the facial nucleus. Acquisition of images within a 630 × 630 μm region were taken below the nucleus ambiguus in between the lateral edge of the inferior olive and the medioventral extension of the spinal trigeminal tract. Within this region, SST- and NK1R-expressing neurons identify the area and the rhythmogenic neurons within the preBötC complex (Gray et al. 1999; Pagliardini et al. 2003; Stornetta et al. 2003). Within this defined area, NeuN-, NK1R- and SST-expressing neurons were identified and counted in order to determine the serial distribution of infected (EYFP-expressing) neurons. Since TH-expressing neurons are distributed more widely than preBötC, colocalization between EYFP and TH was studied in a wider area within the ventral medulla to incorporate the entire C1 neuron group in the histological analysis. For cFos immunopositive nuclei, serial rostrocaudal images of the ventral respiratory column were taken with a Leica DM5500B microscope with a × 20 magnification. Images were acquired with Metamorph (Molecular Devices, Sunnyvale, CA, USA) program and cFos positive nuclei were counted in a 1344 × 1024 μm window just below the nucleus ambiguus in both the stimulated and unstimulated side and a difference between the two sides was calculated along the rostrocaudal extension of the ventral respiratory column for both SYN-ChR2-EYFP and SYN- EYFP viruses.
Data analysis and statistics
Airflow, laser onset/offset, and EMG traces were acquired on a PowerLab 16/35 acquisition system and analysed using LabChart7 Pro (AD Instruments), Excel 2013, Matlab, and Origin8 (Origin-Lab, Northampton, MA, USA) software. The absolute value of EMG signals was digitally rectified and integrated with a time constant of 0.08 s to calculate peak amplitude. The respiratory airflow signal (ml s–1) was used to calculate respiratory rate, period, tidal volume (VT) and minute ventilation ( ).
).
Changes in period, respiratory rate and EMG peak amplitude were calculated and averaged for 15 respiratory cycles before photostimulation, and during the photostimulation period along the rostrocaudal respiratory column, and in the location where maximal respiratory response occurred. Statistical significance of respiratory changes before and during photostimulation was tested with a Student's paired t test (P<0.05). The ability to entrain respiration with photostimulation was tested on a series of trials where coupling between laser pulses and inspiratory onset was detected on a breath by breath basis. Inspiratory activity was considered successful if ∫DIA peak amplitude reached at least 40% of its value compared to baseline conditions. When coupling of photostimulation and inspiratory efforts occurred in 15 breaths over 15 photostimulation pulses (the length of the trial test), entrainment was considered to be 100%. Entrainment response was also determined with a regression analysis between stimulus frequency and respiratory frequency output. Data are presented as averages ± standard error.
Reset analysis
We analysed perturbations (i.e. reset) in the otherwise stable respiratory rhythms that were evoked by delivering short duration (100–1000 ms) pulses of photostimulation at random phases of the ongoing oscillation. By triggering on a threshold (inward) value of the respiratory flow we were able to define the beginning of each inspiratory cycle and to calculate the baseline respiratory period in every trial. These values were used to convert latency values from the onset of inspiration into degrees (0–360 deg where 0 deg indicates the beginning of inspiration) by normalizing the ratio of latency values to the average cycle period across 360 deg (for a graphical representation see Fig.6). In this way, we could characterize the phase at which stimulation was delivered in addition to the phase of subsequent inspiratory events similarly to previously established methods (Pagliardini et al. 2011). Phase measurements for each experimental condition were binned in increments of 18 deg across the full 360 deg cycle and were analysed using circular statistics to test for non-uniformity (i.e. the systematic clustering of angular values) using the Raleigh z distribution (Zar, 1996). The average phase angle was calculated using the method of Batschelet (as described by Zar, 1996, pp. 608–610) and was characterized by a vector with an angle equal to the average phase and with a length between 0 and 1 that reflected the angular dispersion of the individual phase values (where 0 reflects random and non-significant dispersion of angular values and 1 reflects a perfect alignment of angular values). A second-order circular analysis using the method of Hotelling (as described by Zar, 1996, pp. 638–639) was also applied across experiments on these individual experimental vectors to compute a grand average vector (again having both an angle and length) and also to test for non-uniformity, again using the Raleigh z distribution. Phase measurements were obtained using custom software written in Matlab 7.4 (The MathWorks). Results were plotted using Origin8 software.
Figure 6. Photostimulation of SYN-ChR2-EYFP-treated rats in the preBötC generates respiratory reset.
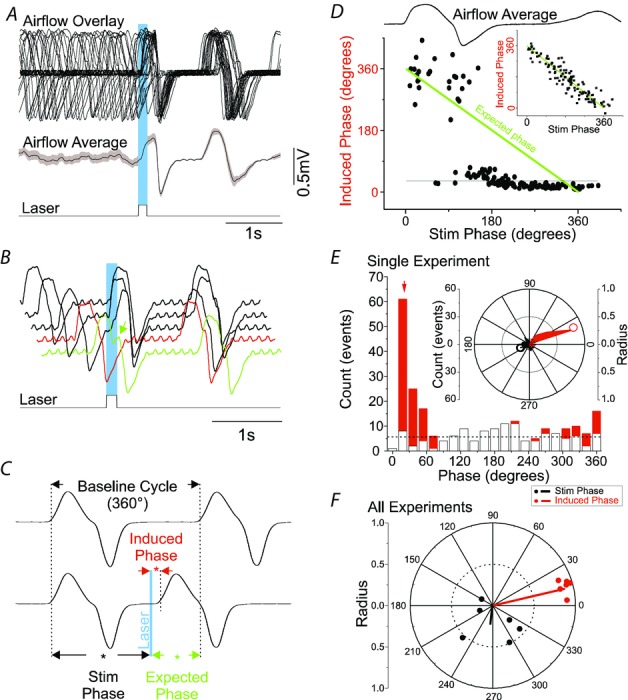
A, superposition of respiratory airflow traces (top, n = 27) and average airflow trace (centre) during 150 ms pulse photostimulation (bottom), which resets and aligns the subsequent inspiratory event. The greyed area behind the dotted line on average airflow trace indicates the standard error of the mean. B, overlay of five respiratory airflow traces from the same experiment in A arranged by the phase of stimulus delivered during ongoing respiration. The red trace indicates a lack of immediate response to photostimulation when it occurs during the post-inspiratory phase (refractory period). The green trace shows a slight prolongation of inspiration (green arrow) when the stimulus is delivered during the inspiratory phase. C, calculation of phase perturbations by laser photostimulation. Top trace: baseline respiratory flow cycle (from 0 to 360 deg, measured from the onset of one inspiration to the next, see arrows). Bottom trace: respiratory flow cycle during stimulation. Stimulus phase: onset of photostimulation with respect to the phase of respiration (black asterisk and arrows); induced phase: onset of inspiration subsequent to delivery of photostimulation (red asterisk and arrows); expected phase: expected onset of the next inspiratory cycle with respect to stimulus onset if photostimulation had no effect (360 deg minus stimulus phase; green asterisk and arrows). D, average respiratory flow (top) and distribution of induced phases as a function of stimulus phase (bottom). The expected phase is shown as a green line which assumes that the subsequent phase in the absence of stimulation will occur at 360 deg from the onset of respiration (see inset for non-stimulated case). Horizontal line indicates the average induced phase for the major short latency cluster (at 30 deg) occurring for stimulus phases beyond ∼90 deg. Note, however, another prominent cluster at longer induced latencies at ∼330 deg that occurred for stimulus phases shorter than ∼90 deg. E, distribution of events for stimulus and induced phases during multiple trials of 125 ms photostimulation delivered during the same experiment as shown in A. While stimuli were distributed in a near-uniform fashion randomly across all phases of respiration (open bars), the stimulus-induced phase values (red bars) demonstrated clustering at a tight range of preferred phase angles. The red arrow indicates the average angle for the distribution of induced phases (21 deg). The horizontal dotted line indicates the expected value of both distributions across phases based on an average random assignment. These data are also plotted in polar form in the inset with stimulus phase as a black fill and induced phase as a red fill. Left scale bar indicates radial distance for number of events (0–60) for both stimulus and induced phase with divisions indicated by concentric circles on the plot itself. Innermost concentric circle represents the average expected value of the distribution similarly to the histogram representation. The average preferred angle and radius for both the stimulus and the induced phase is overlaid as an open dot (black and red, respectively). Right scale bar indicates normalized radial length for this average vector (0–1 with divisions again indicated by concentric circles on plot). Radial values close to 1 (represented by external circle) are indicative of low dispersion of angles and significant phase preferences in polar distributions. Note the marked difference of average radii between stimulus and induced phases. F, distribution of preferred phases of stimulus-induced respiration for six separate experiments at the same stimulus duration (vector end-points plotted as dots) and the calculated grand average vectors (plotted as lines) across all experiments (stimulus phase in black, induced phase in red). Note the tight similarity of clustering in induced (but not stimulus) phase angles across experiments.
When stimulation was delivered during inspiration (i.e. during active airflow) we determined if stimulation had any effect on ongoing inspiratory time (Ti). This was done by binning the average changes in Ti (compared to control values) as a function of stimulus phase across 10 deg intervals through inspiration.
To determine the extent of the refractory period during 150–250 ms photostimulation experiments, we identified the rate of success (i.e. the ratio of short-latency generation of inspiratory events divided by the total number of stimulations) within intervals of 10 deg from the offset of inspiration until the value of success rate reached 1 for every experiment (n = 5; 80 deg).
Results
Expression patterns of SYN-ChR2-EYFP in brainstem
Histological examination of transverse sections obtained from SYN-ChR2-EYFP-treated rats confirmed that injections were in the preBötC region (Fig.1). Although some sparse scattered large EYFP-expressing neurons were located medial to the location of preBötC, the majority of EYFP-expressing neurons were located within the region of the preBötC, just below the nucleus ambiguus at a distance between 400 and 1200 μm from the caudal pole of the facial nucleus (Fig.1). No viral infection of nucleus ambiguus motoneurons was evident. In infected neurons, the virus was weakly expressed in the somal region and more intensely localized in cellular processes.
Figure 1. Distribution of EYFP labelled neurons along the rostrocaudal extension of the ventral respiratory column.

A, three-colour confocal mosaics (left) and single-colour images (right) showing co-localization of NeuN (blue), NK1R (magenta) and EYFP (green) in transverse sections taken at the level of the preBötC (top) and BötC (bottom). Inset displays two NK1R positive neurons, one expressing EYFP and one lacking EYFP expression (asterisk). B, rostrocaudal (right–left) distribution of total NeuN+ and NeuN+/EYFP+ neurons, NK1R+ and NK1R+/EYFP+ neurons, SST+ and SST+/EYFP+ and TH+ and TH+/EYFP+ neurons after unilateral injection of SYN-ChR2-EYFP virus into the preBötC. Diagrams above plots illustrate the area (grey zone) where cell counts were performed. On the x-axis of plots the distance (in mm) from the caudal tip of the facial nucleus is indicated. Grey zone in plots indicate the area of high density of SST+ and NK1+ neurons corresponding to preBötC. Calibration bars in A: main panels, 200 μm; insets, 20 μm.
We performed cell counting of EYFP-expressing neurons in a 630 μm2 region centred just below the nucleus ambiguus, between the spinal trigeminal tract and the lateral edge of the inferior olive, where respiratory neurons of the ventral respiratory group are located (Gray et al. 2001). In this region, an average of 107.8 ± 5.9 neurons per section (43.3 ± 1.9% of the NeuN-positive neurons; n = 5) expressed EYFP (Fig.1). EYFP expression was also identified in specific neuronal subpopulations of the ventrolateral medulla. These included neurons expressing the receptor for substance P (NK1R) and the peptide somatostatin (SST), two classic anatomical markers used for the identification of preBötC respiratory neurons (Gray et al. 1999; Stornetta et al. 2003), as well as neurons expressing tyrosine hydroxylase (TH), an enzyme present in C1 noradrenergic neurons (Abbott et al. 2013a). Although not exclusively present in the preBötC area, high concentration of NK1R and SST demarcate the area where rhythmogenic neurons have been identified in both the perinatal and adult rodent brain (Gray et al. 1999, 2001; Pagliardini et al. 2003; Stornetta et al. 2003; Tan et al. 2010). Within the preBötC region, 56.0 ± 3.1% of NK1R-expressing neurons and 39.6 ± 2.3% of SST-expressing neurons also co-expressed EYFP (n = 6). A much smaller proportion of TH-expressing neurons (8.6 ± 0.6%, n = 6), which were usually localized medial and ventral to NK1R and SST-expressing neurons, co-expressed EYFP at the rostrocaudal level of the preBötC region.
Activation of preBötC neurons increases breathing frequency
We initially tested the response to a train of high frequency (HF) photostimulation (20 ms pulses at 20 Hz, 15 s), 2 mm lateral to the midline starting at 1–2 mm caudal to the hypoglossal nerve root exit and then moving along the rostrocaudal axis in 500 μm step intervals, with the optic fibre in contact with (but not penetrating) the ventral surface of the medulla (Fig.2). Photostimulation was most effective at the rostrocaudal level of the hypoglossal nerve root exit, at a distance of 0.5–1 mm from the caudal pole of the facial nucleus, a location that corresponds to the site of preBötC in adult rats (Janczewski et al. 2013). High frequency photostimulation increased breathing rate by 23.69 ± 3.77% (from 41.41 ± 2.74 to 50.51 ± 2.37 breaths min–1 (bpm); n = 9; P = 4.95 × 10⁻⁶; Fig.2C). Continuous photostimulation (10 s) delivered in the same location, produced an even more profound increase in breathing rate as the breathing frequency increased by 38.5 ± 8.1% (from 41.2 ± 3.2 to 55.2 ± 2.6 bpm; n = 9; P = 2.92 × 10⁻⁵). The increase in breathing frequency reached its maximum value almost instantly and remained at the same level through the 10s stimulation period. No statistical difference was observed when respiratory frequency was compared between the first and the last 5s of the stimulation period (51.2 ± 2.4 and 50.0 ± 2.7 bpm; respectively; n = 9; P = 0.13). In addition, the specific frequency response to photostimulation was reproducible over the entire course of the experiment (3–5 h; data not shown).
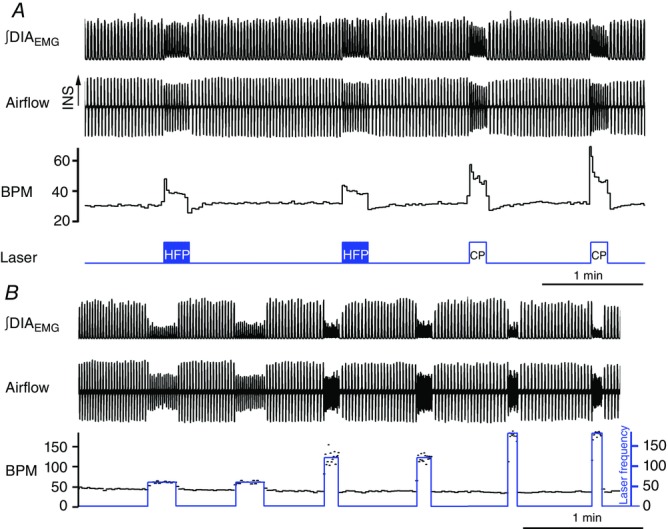
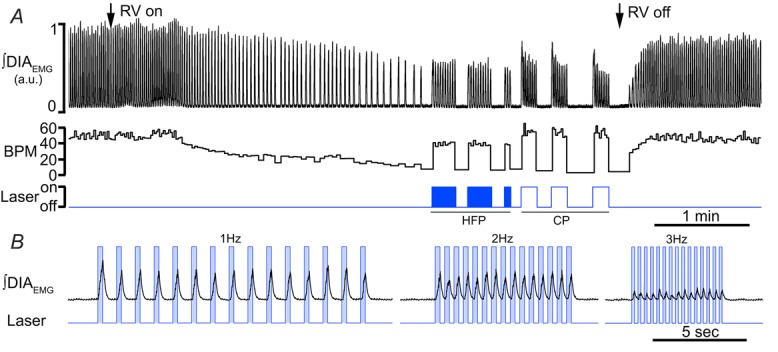
Figure 2. Effects of continuous (10 s) and high frequency (20 Hz, 20 ms pulse) photostimulation of preBötC in urethane-anaesthetized SYN-ChR2-EYFP-treated rats.

A, long trace recording of ∫DIAEMG, ∫GGEMG, ∫ABDEMG, respiratory rate (breaths min–1, BPM) and laser activation shows that repeated photostimulation of preBötC induce reproducible and consistent increases in respiratory frequency in the presence of a continuous photostimulation (left, CP) and in presence of brief light pulses delivered at high frequency (HFP, 20 ms pulse at 20 Hz, right). Photostimulation events expanded in B are indicated with ‘i’ and ‘ii’ below the photostimulation protocol diagram. B, details of photostimulation protocols delivered in A. C, population data indicating changes in respiratory rate (RR), tidal volume (VT), minute ventilation ( ) and normalized changes in DIAEMG and GGEMG activity upon CP (circles) and HF photostimulation (squares). *Statistically significant changes (P<0.05) compared to pre-stimulation values.
Within each respiratory cycle, inspiratory time (TI) increased by 26.6 ± 0.1% (from 0.37 ± 0.04 to 0.48 ± 0.07 s; n = 7; P = 2.1 × 10⁻²) with HF photostimulation and by 12.2 ± 0.1% (from 0.35 ± 0.04 to 0.41 ± 0.07 s; n = 6; P = 9.1 × 10⁻²) with continuous photostimulation. Expiratory time (TE) decreased by 38.2 ± 0.1% (from 1.11 ± 0.13 to 0.69 ± 0.11s; n = 7; P = 3.2 × 10⁻³) with HF photostimulation and by 34.4 ± 0.1% (from 0.98 ± 0.08 to 0.66 ± 0.11 s; n = 6; P = 4.9 × 10⁻³) with continuous photostimulation.
Tidal volume (VT) decreased by 11.7 ± 6.7% during HF photostimulation (from 3.15 ± 0.49 to 2.74 ± 0.46 ml; n = 7; P = 2.4 × 10−2) and by 23.4 ± 6.3% during continuous photostimulation (from 2.73 ± 0.44 to 2.14 ± 0.43 ml; n = 6; P = 4.6 × 10⁻³). No significant change was observed in minute ventilation ( ) with either HF stimulation (from 130.4 ± 17.5 to 137.7 ± 19.6 ml min−1; n = 7; P = 0.18) or with continuous photostimulation (from 119.7 ± 18.5 to 123.2 ± 23.7 ml min−1; n = 6; P = 0.35; Fig.2C).
During both HF and continuous photostimulation, DIAEMG (n = 9), genioglossal EMG (GGEMG, n = 4) and abdominal EMG (ABDEMG, n = 6) activity was measured on a breath by breath basis. Integrated DIAEMG peak amplitude was decreased by 13.1 ± 3.6% (n = 9; P = 3.2 × 10⁻³) with HF photostimulation and by 24.4 ± 4.8% (n = 9; P = 3.5 × 10⁻⁴) with continuous photostimulation (Fig.2C). Genioglossus EMG activity was successfully recorded in four experiments, while in three additional experiments GGEMG activity was eventually lost because of the XII root damage during the exposure of the ventral surface of the brainstem. When GGEMG activity was successfully recorded, EMG amplitude increased (P = 0.046; n = 4) with both HF (+19.5 ± 8.2%) and continuous photostimulation (+13.1 ± 5.3). In one experiment, ∫GGEMG peak amplitude was instead reduced by 8.02% with continuous photostimulation (Fig.2C). PreBötC photostimulation had no effect on tonic ABDEMG activity (n = 6; P = 0.14) and did not recruit active expiration (Fig.2A).
In order to confirm that photostimulation preferentially activated neurons within the preBötC, serial sections of perfused brains from stimulated rats were immunoreacted for cFos expression, a marker for neuronal activity. Although a basal level of cFos-activated cells was present on both sides of the ventral respiratory column (58.4 ± 5.2 cells per section on the treated side and 58.8 ± 5.6 cells per section on the untreated side caudal to the preBötC; P = 0.5; n = 3) the photostimulated side contained a higher number of cFos-positive cells in the rostrocaudal region of the respiratory column corresponding to the preBötC (+36.2 ± 8.7 cells per section, P = 1.6 × 10⁻³; n = 3; Fig.3A). In addition, in control experiments where a virus lacking the light-sensitive protein (SYN-EYFP) was used, no difference was observed between stimulated and unstimulated sides (P = 0.16; n = 3; Fig.3A).
Figure 3. Specificity of preBötC photostimulation.

A, expression of cFos in SYN-ChR2-EYFP and SYN-EYFP-treated rats indicates local activation of neurons in the preBötC upon photostimulation. A1 and A2, cFos expression in the ventrolateral medulla of unilaterally SYN-ChR2-EYFP injected rat after photostimulation experiment indicates the presence of an increased number of cFos positive neurons in the photostimulated side (A1) compared to the non-stimulated side (A2). Several EYFP-expressing neurons display cfos positive nuclei (A3). Plot in A4 indicates difference in number of cFos positive cells between stimulated and unstimulated side for both SYN-ChR2-EYFP (blue squares) and SYN-EYFP (white squares) treated rats along the respiratory column. The x-axis shows (in mm) the distance from the facial nucleus. *Significant difference in cell number between stimulated and unstimulated side. B and C, two examples of the effect of photostimulation in preBötC and BötC when viral injection was misplaced and infected preferentially BötC neurons. Changes in ∫DIAEMG and respiratory frequency (BPM) upon either HFP (B) or CP (C) laser stimulation in preBötC (left) and BötC (right). Note lack of significant response when preBötC is photostimulated and strong respiratory depression when BötC is photostimulated. D, lack of response to photostimulation of preBötC when control SYN-EYFP virus is expressed in the preBötC. HFP, CP and 100 ms brief pulses at different frequencies (0.8, 0.9, 1.2 Hz) were delivered in control rats to test for ChR2-independent responses. Calibration bars in A1 and A3, 200 μm (A2 same as A1).
This suite of responses evoked by photostimulation was site specific. If the viral injection site was more rostral, e.g. in the Bötzinger complex (n = 4), photostimulation depressed respiratory frequency and tidal volume (from 42.8 ± 3.5 to 36.1 ± 5.2 bpm, n = 4; P = 2.5 × 10⁻²) as displayed in Fig.3B and C.
Photostimulation experiments performed using the control adeno-associated virus lacking the light-sensitive protein (SYN-EYFP) injected into the preBötC did not produce any significant changes in respiratory activity (from 40.5 ± 2. 6 to 40.8 ± 2.5 bpm; n = 4; P = 0.15) and did not respond to different patterns of stimulation (Fig.3D).
Catecholaminergic systems are not necessary for respiratory rhythmogenesis although they are known to provide an important drive to respiratory networks (Doi & Ramirez, 2008; Gargaglioni et al. 2008; Hodges & Richerson, 2008; Lalley, 2008). In order to test if our photo-elicited effects were dependent upon catecholamine release we pretreated four SYN-ChR2-EYFP-treated rats with reserpine (10 mg kg–1, i.p.) 12–18 h prior to optostimulation. Reserpine depletes catecholamine stores and reduces the influence of neurons containing serotonin, adrenaline, noradrenaline and dopamine (Henry et al. 1994; Schuldiner, 1994). Baseline respiratory rate in reserpine-treated rats was reduced compared to untreated rats (32.5 ± 5.3 compared to 41.4 ± 2.7 bpm in untreated SYN-ChR2-EYFP rats), indicating that reserpine effectively reduced excitatory cathecolaminergic drive. Despite this, reserpine had no effect on the ability of HF photostimulation in the preBötC to modulate respiratory frequency (P = 0.17); respiratory rate increased by 47.2 ± 10.5% (from 32.5 ± 5.3 to 46.6 ± 5.2 bpm; n = 4; P = 4.4 × 10⁻³) in reserpine-treated rats (Fig.4A).
Figure 4. Reserpine pretreatment does not affect respiratory response to preBötC photostimulation.
Photostimulation of preBötC in SYN-ChR2-EYFP-treated rats pretreated with reserpine display similar responses to high frequency (HFP) and continuous photostimulation (CP) (A) compared to SYN-ChR2-EYFP-treated rats. B, reserpine pretreatment does not affect the ability to entrain respiratory rhythm with brief pulses of photostimulation at progressively increasing stimulation frequencies (1 Hz, 2 Hz, 3 Hz).
Frequency-specific activation of preBötC neurons paces breathing
We then tested whether short duration and phasic activation of preBötC neurons was able to entrain the ongoing inspiratory rhythm in adult-anaesthetized SYN-ChR2-EYFP-treated rats (Figs4B and 5; n = 11). We delivered short trains of 15 brief (150 ms) pulses of photostimulation at increasing frequencies (0.7–3 Hz) to the preBötC region in SYN-ChR2-EYFP-treated rats. Photostimulation reliably entrained ongoing inspiration (measured by either the respiratory flow or the DIAEMG activity) at frequencies much higher than baseline respiratory rate (Fig.5). Scatter plots of the relationship between stimulus frequency and respiratory frequency across experiments are shown in Fig.5C. Photostimulation reliably entrained respiratory frequency with a success rate of 99.5 ± 0.2% using stimulus frequencies below 2 Hz and a success rate of 93.02 ± 4.77% using a 3 Hz stimulus (n = 3). Inability of the diaphragm to follow stimulation frequency led either to small amplitude DIAEMG contractions that did not reach threshold or to skipped events which reduced the success rate for entrainment. Overall, linear regression analysis between stimulus frequency and induced inspiratory events indicated a high correlation between the two variables (R2 = 0.998). The ability of entraining respiratory activity persisted throughout the duration of these stimulation experiments (3–5 h; n = 7; P = 0.28). Similar results were obtained after reserpine pretreatment (n = 4; Fig.4B).
Figure 5. Photostimulation of SYN-ChR2-EYFP-treated rats in the preBötC produces respiratory entrainment.
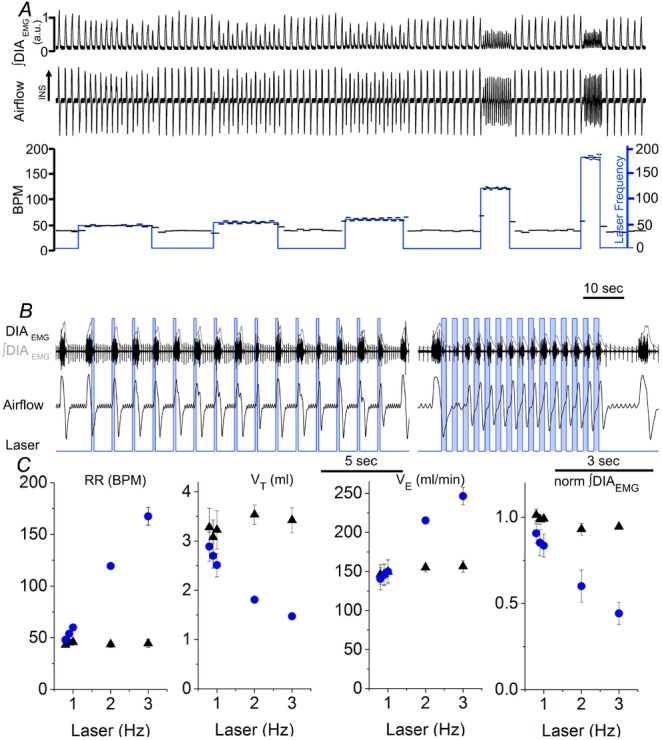
A, long trace recordings of ∫DIAEMG, respiratory airflow, and derived instantaneous respiratory frequency (BPM scale is on left) and laser frequency (blue; stimulation frequency scale is on right, events min–1) during photostimulation at progressively higher rate (0.8, 0.9, 1, 2, 3 Hz, respectively). B, details of respiratory traces during photostimulation entrainment at 1 Hz (left) and 3 Hz (right). Boxes in B indicate the time in which laser is turned on. Note the fast recruitment of DIAEMG activity and consequent movement of respiratory flow in response to laser stimulation. C, relationship between photostimulation frequency and respiratory rate, tidal volume, minute ventilation and ∫DIAEMG in SYN-ChR2-EYFP-treated rats (circles) compared to baseline activity (triangles). Each point represents the average value (± SEM) obtained from four SYN-ChR2-EYFP-treated rat experiments. Note the limited variability of respiratory rate at multiple entrainment frequencies, reflecting successful entrainment.
Photostimulation-driven entrainment caused a reduction in peak ∫DIAEMG amplitude by 33.0 ± 8.7% (n = 4; P = 1.6 × 10⁻²) and 50.2 ± 7.4% (n = 3; P = 1.0 × 10⁻²) with 2 and 3 Hz photostimulation frequencies, respectively. Entrainment caused a gradual reduction in tidal volume (VT) upon 2 Hz (from 3.5 ± 0.2 to 1.8 ± 0.1 ml; n = 4; P = 1.7 × 10⁻³) and 3 Hz (from 3.4 ± 0.2 to 1.5 ± 0.1 ml; n = 3; P = 9.9 × 10⁻³) photostimulation. As a consequence of increased breathing rate, minute ventilation ( ) was increased during 2 Hz (from 155.0 ± 5.9 to 215.4 ± 1.9 ml min−1; n = 4; P = 3.5 × 10⁻⁴), and 3 Hz photostimulation (from 156.5 ± 7.7 to 246.5 ± 11.1 ml min−1; n = 4; P = 7.2 × 10⁻³). Respiratory events during entrainment at higher frequency were also characterized by a 3-fold increase in variability in ∫DIAEMG peak amplitude and a 10-fold increase in variability in VT compared to pre-photostimulation values.
During entrainment induced by preBötC photostimulation, neither active expiration nor ABDEMG contraction was observed. All respiratory parameters returned immediately to baseline levels following the end of the photostimulation period.
Pulses of photostimulation reset respiratory rhythm in a phase-independent manner
Given that photostimulation of the preBötC entrained breathing, we examined the ability of short-duration (125 ms to 1 s) single light pulse stimulation to reset breathing in SYN-ChR2-EYFP-treated rats (Fig.6). We repetitively applied stimulation at very low rates (0.1 Hz) during ongoing spontaneous breathing. We ensured that stimulation was delivered at random phases of ongoing respiration by confirming that the distribution of stimulation phases demonstrated homogeneity (see Fig.6). Despite being delivered at random phases, post-stimulus inspiratory episodes tended to show stimulus locking as shown by post-stimulus locking in both overlays and on average, suggesting phase reset (Fig.6A). Indeed, in every case, 100–150 ms photostimulus pulses induced a prompt recruitment of inspiration with an average delay of 97 ± 17 ms when delivered during the inter-inspiratory period (n = 6). However, and as shown in the stacked traces in Fig.6B, when photostimulation occurred during inspiration (i.e. during active air inflow), the ongoing respiratory activity appeared only minimally affected (see green trace) although the subsequent inspiratory cycle did tend to show phase locking to the stimulation in the overlays and average traces (Fig.6A and B).
To systemically analyse the effect of reset induced by photostimulation of preBötC neurons, we determined the phase values relating the onset of stimulation to both the ongoing respiratory cycle (stimulus phase) and to the onset of the subsequent inspiration (induced phase) (Fig.6C). Phase resetting is observed in Fig.6D which plots stimulus phase against induced phase for all stimulation trials in this experiment. For reference, the averaged airflow trace is aligned according to the same inspiratory trigger used for the stimulus phase values. During the inter-inspiratory interval when there was no airflow, the phase reset to stimulation was immediate and well-locked to the onset of laser pulses (averaging approximately 30 deg or 112.5 ms in this example as shown by the bottom horizontal line). However, during inspiratory airflow phase, the induced phase was not immediate but rather appeared to stabilize the subsequent inspiration at a relatively consistent phase that was just less than 360 deg (330 deg or 1.2 s in this example). Regardless, stimulation was very successful at perturbing the subsequent phase of the ongoing stimulation as shown by comparing the data for actual stimulation trials to those from the non-stimulated case (inset).
By plotting the cyclic distribution of these angular values and using circular statistics (see Methods section) we determined whether phase values were randomly distributed across the cycle or were clustered at a preferred phase (Fig.6E and F). Consistent with the random delivery of stimuli across all phases of the respiratory cycle, the stimulus phase distribution (Fig.6E: open bars in histogram and black fill in the inset polar plot) appeared randomly distributed, although in this case the test for non-uniformity was significant (Raleigh z: 3.4, P = 0.03). In contrast, the distribution of induced phase values (red fill in both histogram and inset polar plot) showed a marked clustering suggestive of stimulus-induced phase reset. Indeed, for the experiment depicted the distribution was highly non-uniform (Raleigh z: 86.5, P = 1.6255 × 10−49), and the average phase was represented by a vector having a phase angle of 21 deg and normalized length (radius) of 0.85 (Fig.6E, red arrow in histogram and red circle in polar plot). Vector lengths close to 1 are indicative of low dispersion (i.e. variance) of the distribution of individual angular values as well as indicative of significant phase preferences (i.e. non-uniformity) in polar distributions (Zar, 1996). Indeed, the marked clustering of induced phase is suggestive of robust (i.e. Type 0) resetting (Paydarfar et al. 1986; Paydarfar & Eldridge, 1987; Winfree, 2001). In contrast, and as observed in the inset in Fig.6E, the distribution of stimulus phases showed much less clustering (radial value of average angle = 0.17).
Across all experiments, and for different stimulus durations, the distributions of the average induced phase were clustered at short phases (13–44 deg) from the onset of stimulation and each showed significant non-uniformity. As shown in Fig.6F for the shortest stimulus duration (125 ms), the average angle as computed across all experiments (whose individual average vector ends are indicated by red dots) was 13 deg and had a normalized radius of 0.9 (red line). The low dispersion (variance) of average angular values across experiments is obvious in terms of the prominent clustering of individual experimental vectors. In contrast, individual experimental values for stimulation phase (black dots and line in Fig.6F) showed highly variable angles and shorter vector lengths. As a result, the overall average vector across experiments (black line) had a low radial value and did not demonstrate significant non-uniformity.
Altogether, the best reset (according to least dispersion/greatest group average vector lengths) was driven by the shortest pulse durations used (125 ms) as shown in Table 1. Although there was a significant positive linear relationship between stimulus duration and the average (group) angular values for induced phase (correlation coefficient = 0.97), this relationship was probably not related to the increased temporal/phase offset of stimuli since each duration step involved a temporal doubling which was not observed in the translation of increased phase values.
Table 1.
Group average values for induced phase for different photostimulation pulse durations showing best reset for the shortest pulse durations used and increasing phase values for increasing pulse duration
| Pulse | Avg | Radius/vector |
|---|---|---|
| duration | angle | length (max |
| (ms) | (deg) | value = 1) |
| 125 | 13.0 | 0.90 |
| 250 | 22.5 | 0.83 |
| 500 | 32.6 | 0.68 |
| 1000 | 44.0 | 0.63 |
Given the apparent variable reliability of phase reset during airflow itself (see panels B and D of Fig.6), we systematically assessed evidence of reset during this period. First, we determined if the delivery of laser stimulation had an effect on the length of the ongoing inspiratory event. If stimulation was ineffective during this period then we would expect that stimulation would have little effect on the average duration of this phase. We identified 10 deg phase intervals within the inflow period (see Fig.7A) and calculated inspiratory time (Ti) as a function of stimuli delivered across these phases. The average value of Ti during control conditions was 83.7± 4.3 deg (309 ± 4 ms; n = 6). Figure 7B shows the control normalized values of Ti as a function of stimulus phase. While there was a tendency for Ti values to be slightly reduced when stimulation was delivered in early phases with a tendency for increased Ti values when stimulation was delivered in late phases of inspiration, a within subjects ANOVA revealed no significant differences (P = 0.3) between control and stimulation Ti values. Thus, timing of stimulation during inspiratory flow did not alter the Ti of the ongoing inspiration.
Figure 7. A refractory period to inspiratory reset exists during early expiration.
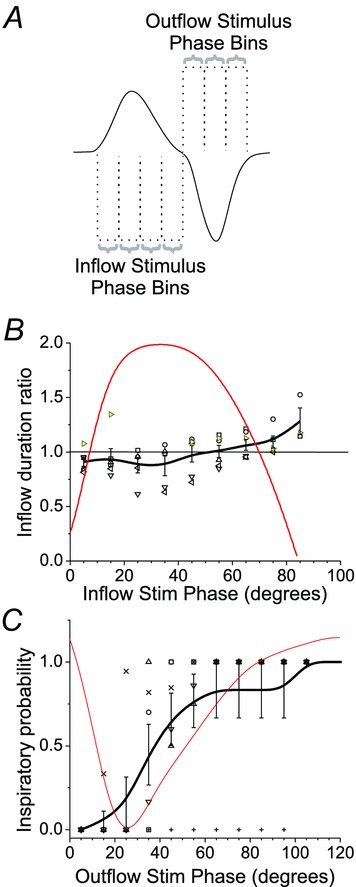
A, effect of laser photostimulation during active airflow. Inflow and outflow measures were collected for stimuli occurring in specific phase bins as illustrated. B, inspiratory duration is unaffected by stimulation during inspiratory flow. Across individual experiments, the duration of inflow during stimulation was calculated and expressed as a ratio of the baseline inflow duration based on the phase of stimulus delivery. Red line shows the actual average airflow trace occurring as a function of phase. Grey-scale symbols indicate results for individual experiments and black line is an average of values calculated in binned increments of 10 deg from onset of inspiration across the 6 experiments. Note a tendency for inflow duration to increase as stimuli were delivered at later phases of inspiratory inflow. C, refractory period for photostimulation-induced inspiration occurring during early expiration. Across experiments, the probability of successfully eliciting inspiration (i.e. the number of successful trials over the total number of trials) as a function of stimulus phase was calculated and plotted. Red trace shows the actual average airflow trace occurring as a function of phase. Grey-scale symbols indicate results for individual experiments and black line is an average of values calculated in binned increments of 10 deg from onset of inspiration across the 6 experiments. At the initial phase of expiratory flow, there is a marked limited success of photostimulation to evoke inspiration which gradually improves at later phases.
We also observed that in early expiration (i.e. outflow period, Fig.6B, red trace) photostimulation could fail to generate an immediate (within 200 ms) inspiratory event. Thus, we calculated the rate of success (see Methods section) as a function of the phase of stimulation (in 10 deg intervals) following the end of the inspiratory (inflow) cycle. These data are shown in Fig.7C. With the exception of only one experiment, an inspiratory event could be generated with 100% success only after a period of 60 ± 4.5 deg (215.2 ± 0.1 ms; n = 5) delay from the end of inspiratory (inward) airflow. The remaining experiment displayed a longer refractory period of 100 deg (408 ms). These results indicate that if an excitatory stimulus is delivered to the inspiratory oscillator within 215 ms from the end of an inspiratory event, inspiration cannot be reliably regenerated.
Photostimulation of preBötC neurons generates rhythmic diaphragm contractions when excitatory respiratory drive is dampened by mechanical hyperventilation
We used mechanical hyperventilation to reduce arterial blood  and thus excitatory drive to preBötC provided by central chemoreceptors (Guyenet et al. 2008). Once rats reached the apneic threshold (i.e. no rhythmic contractions were observed in DIAEMG), we examined whether photostimulation would be sufficient to reactivate rhythmicity in preBötC neurons and thus, inspiratory musculature.
Photostimulation applied to the preBötC was sufficient to both generate and entrain rhythmic respiratory activity as demonstrated by the reappearance of rhythmic DIAEMG contractions (Fig.8). Continuous photostimulation (10 s) and brief trains of HF photostimulation into the preBötC generated rhythmic DIAEMG activity with a frequency of 39.4 ± 5.37 and 35.8 ± 2.1 bursts min−1, respectively (n = 7). Respiratory rate obtained during photostimulation was not significantly different from the baseline respiratory frequency before hyperventilation (n = 7; P = 0.52 and 0.10 for continuous and HF photostimulation, respectively). Short trains of photostimulation at various frequencies (1–3 Hz, 0.25–0.15 s pulse length) drove DIAEMG contractions up to 159.2 ± 16.4 bursts min−1 (n = 3) with a success rate of 100% (15 breaths per 15 light pulses) upon 3 Hz photostimulation. Overall, linear regression analysis between stimulus frequency and respiratory period calculated from the induced DIAEMG contractions indicated a high correlation between the two variables (R2 = 0.99). Interestingly, DIAEMG contractions immediately stopped at the end of each set of photostimulation and rats quickly regained their ability to produce independent respiratory rhythmic activity at pre-ventilation levels when disconnected from the ventilator. Again, we found no instances of ABDEMG recruitment or active expiration during photostimulation in these instances.
Figure 8. Photostimulation of SYN-ChR2-EYFP-treated rats in the preBötC restores respiratory rhythms and produces respiratory entrainment in absence of ongoing respiration.
A, long trace recordings of ∫DIAEMG, and derived respiratory frequency (breaths min–1, BPM) during photostimulation at either high frequency stimulation (20 ms pulse at 20 Hz, HFP) and continuous photostimulation (10 s, CP). Note the ability of the rat to reach high level of respiratory rate upon HFP and CP. Arrows indicate the time at which rat was connected (left) and disconnected (right) with a respiratory ventilator (RV) to reach the apnoeic threshold and reinstate spontaneous breathing. B, details of respiratory traces during photostimulation entrainment at 1 Hz (left), 2 Hz (centre) and 3 Hz (right) in absence of spontaneous breathing. Boxes in B indicate the time in which laser is turned on. Note the immediate recruitment of DIAEMG upon laser onset.
Discussion
Our results demonstrate that unilateral photostimulation of ChR2-expressing preBötC neurons potently drives rhythmic inspiration. Photostimulation increased respiratory frequency, generated rhythmic inspiratory muscle recruitment, entrained and reset respiratory rhythms, and generated inspiratory activity in the temporary absence of central respiratory drive. This is the first demonstration in vivo that direct optogenetic activation of preBötC neural circuits drive and control respiratory rhythm over a wide range of frequencies with a very fast response.
The necessity and sufficiency of preBötC in respiratory rhythmogenesis has been demonstrated by mean of selective sectioning (Smith et al. 1991), toxic lesions (Gray et al. 2001; McKay et al. 2005), genetic ablation (Bouvier et al. 2010; Gray et al. 2010), laser ablation (Hayes et al. 2012; Wang et al. 2014), and acute inactivation (Tan et al. 2008). Analysis of how respiratory rhythms are entrained and reset by selective stimulation of other regions in the brain have also elucidated how structures in the pons and medulla affect rhythmicity of the respiratory oscillator (Speck & Feldman, 1982; Paydarfar & Eldridge, 1987; Abbott et al. 2011; Pagliardini et al. 2011; Bonis et al. 2013). None of these studies demonstrated such high respiratory frequency response and entrainment fidelity as in the current study. While entrainment was achieved by either RTN photostimulation (Abbott et al. 2011) or limb somatic afferent stimulation (Potts et al. 2005) to reach at most 2 times the intrinsic operating range of breathing frequency, here we showed that upon preBötC photostimulation breathing rate increased up to 4-fold with inspiratory muscle recruitment following stimulus onset with a very brief delay (<100 ms); indicating a very fast response to stimulation. Further, we demonstrated that in response to brief photostimulation across the respiratory cycle, a strong (Type 0) inspiratory-driven respiratory reset was generated and we identified the presence of a critical refractory period of ∼200 ms where inspiratory events could not be recruited.
Altogether, these data further demonstrate the fundamental dependence on excitatory mechanisms for burst initiation and the consequent rhythmogenic inspiratory-driving properties of the preBötC network.
Technical considerations
One potential limitation of this study is that optogenetic activation of preBotC neurons was non-specific. It is likely that all neurons in the preBötC region, including excitatory, inhibitory and modulatory, were activated. We do not consider this lack of specificity to be of major significance in the context of our experimental question, which was to examine the efficacy of a finely tuned excitatory drive to the entire preBötC network and its effect on rhythmogenesis. Within the region of the preBötC there are several different phenotypes of neurons: those expressing NK1R (Gray et al. 1999), SST (Pagliardini et al. 2003; Stornetta et al. 2003), the transcription factor Dbx1 (Bouvier et al. 2010; Gray et al. 2010) and inhibitory GABAergic (Kuwana et al. 2006) and glycinergic neurons (Winter et al. 2009; Morgado-Valle et al. 2010; Sherman et al. 2015). In addition, not all preBötC neurons are respiratory related. Our histological results indicate that our infections targeted ∼40% of the total number of preBötC SST+ neurons and ∼56% of the total number of preBötC NK1R+ neurons. Both sets of neurons have been proposed to be rhythmogenic elements (Gray et al. 2001; Tan et al. 2008). Even though the expression of the virus encompassed a wider area of the preBötC, it was the positioning of the probe combined with the location of viral expression that contributed to the high specificity and high reliability of the response to photostimulation (especially when comparing to responses obtained during BötC stimulation).
Given the limited (<10%) infection rate of TH-expressing neurons in the ventral medulla and the persistence of photostimulatory effects following reserpine pretreatment (Granata et al. 1986; Lambas-Senas et al. 1986; Fritschy et al. 1991), it is unlikely that the observed excitatory effects were generated by the stimulation of the adjacent C1 noradrenergic population (Abbott et al. 2012, 2013b).
We cannot exclude that a portion of the infected neurons are inhibitory respiratory neurons (Morgado-Valle et al. 2010; Winter et al. 2010) whose role in respiratory rhythmogenesis has been recently investigated (Janczewski et al. 2013; Sherman et al. 2015). While selective photostimulation of preBötC glycinergic neurons generated early inspiratory termination, apnoeas, or inspiratory onset delay (depending on the timing of stimulation, Sherman et al. 2015), activation of an heterogeneous population of preBötC neurons (present results) increased respiratory frequency, powerfully entrained the breathing rhythm, and, following a refractory period, reset inspiratory rhythm with a consistent delay. Moreover, in our experiments, stimulation during inspiration had very limited effect. These observations are all consistent with an excitatory-driven burst initiation process. Perhaps in contrast, selective excitation of preBötC inhibitory neurons may have a greater effect outside the rhythmogenic circuitry of the preBötC, given their projection patterns to other brainstem structures affecting the activation phase and timing of specific respiratory musculature.
Stimulation of only a few preBötC inspiratory neurons (4–9 of unknown phenotype) is sufficient to trigger an ectopic inspiratory burst in vitro (Kam et al. 2013b). Although not tested, similarities between responses evoked by holographic stimulation of just a few neurons and our data suggest that activation of small subsets may also be sufficient to entrain rhythm and that inspiratory burst initiation is conceivably not determined by a limited specialized subpopulation of preBötC neurons, but probably by excitatory processes distributed within the preBötC respiratory network. Thus, regardless of whether we are stimulating excitatory or inhibitory preBötC neurons, the excitatory effects clearly predominate, meaning that, if anything, our results underestimate the ability of preBötC photostimulation to reset and entrain rhythm.
Our results support the hypothesis that there is a core of distributed neurons responsible for respiratory rhythmogenesis within the preBötC. It will be critical to determine if and how the different preBötC neuronal subpopulations differentially drive respiratory rhythms in vivo.
PreBötC photostimulation increases respiratory rate and entrains respiration
Trains of HF photostimulation and continuous photostimulation both generated an immediate increase in breathing rate whereas neither abdominal muscle activity nor active expiratory rhythm was recruited. Given our previous results with optostimulation of the expiratory rhythm generator (pFRG, Pagliardini et al. 2011), which showed prominent recruitment of expiratory muscles and active expiration, this further supports the hypothesis that inspiration and active expiration are generated by distinct rhythmogenic neuronal networks (Janczewski & Feldman, 2006; Feldman et al. 2013). Interestingly, while DIAEMG activity decreased with increasing respiratory rate, the activity of the GG muscle was more variable and overall increased with photostimulation.
The effect of photostimulation on the peak of DIAEMG contraction is probably the consequence of the reduced inspiratory time and faster alternation between inspiratory and expiratory phases. Two potential mechanisms may be responsible for the increase in peak amplitude of GGEMG activity: (i) activation of hypoglossal (XII) premotoneurons that exist in the heterogeneous region of the preBötC or in the overlying (dorsal) region; or (ii) direct activation of XII nerve activity via ventral positioning of the laser. Histological analysis of EYFP-expressing neurons showed no labelling dorsal to the nucleus ambiguus or in the premotor area (Li et al. 1993; Dobbins & Feldman, 1995; Woch et al. 2000; Koizumi et al. 2013; Koshiya et al. 2014). Thus, the likelihood of stimulating premotoneurons dorsal to the preBötC is extremely low. Furthermore, total transmitted light power falls rapidly as it travels through tissue (50% reduction in 100 μm and 90% in 1 mm of brain tissue, Aravanis et al. 2007) such that neurons dorsal to the preBötC are unlikely to be excited when the laser is applied from the ventral surface of the medulla. In addition, when viral injections were off-target, photostimulation had no effect on respiratory rate or on ∫GGEMG activity, suggesting that non-specific stimulation of other nuclei or the XII nerve root are probably not responsible for the ∫GGEMG increase. It is therefore intriguing to conclude that preBötC also contains neurons that shape respiratory motor pattern in the upper airways in vivo. This hypothesis has been previously supported by in vitro experiments (Kam et al. 2013a), and recently corroborated by selective laser ablation experiments in vitro (Wang et al. 2014). Tracing experiments also support the presence of preBötC neurons that directly project to the XII nucleus (Koizumi et al. 2013; Koshiya et al. 2014).
We also tested the possibility that entrainment could be induced by rhythmic preBötC photostimulation both during spontaneous breathing and in the absence of ongoing respiration. In vagotomized, spontaneously breathing, urethane-anaesthetized rats, respiratory rate is usually low, around 30–40 bpm (0.5–0.7 Hz) (Pagliardini et al. 2011). Following trains of photostimulation at progressively increasing rates, entrainment was consistently achieved up to 180 bpm (3 Hz), indicating the ability of the respiratory network to promptly and faithfully reach high rates upon preBötC activation. Of note, these rates are 4 times higher than resting values under these experimental conditions, and ∼2 times higher than those observed in awake rats during quiet breathing. Under this stimulation protocol recruitment of DIAEMG activity was elicited with a short delay (∼100 ms) and laser stimulus settled during early inspiration. These results are far more dramatic than the ones observed during photostimulation of the RTN, a major provider of excitatory drive to the preBötC (Abbott et al. 2011) or during sensory stimulation (Potts et al. 2005). RTN photostimulation increased respiratory rate, phrenic nerve discharge amplitude, and produced a slow decay in respiratory response upon stimulus cessation. In addition, entrainment was achieved only at low frequencies in anaesthetized rats (∼60 bpm) with recruitment of active expiration in vivo and significant delay between laser stimulation and phrenic nerve discharge (∼230 deg; (Abbott et al. 2011)). A limited range in entrainment frequency (1.2–2.2 times the ongoing respiratory rate) following somatic sensory stimulation was also observed in rat in situ preparations (Potts et al. 2005). In our experiments, preBötC photostimulation induced an immediate frequency response and an instantaneous return to baseline frequencies upon stimulus cessation in similar (but not identical) experimental conditions to Abbott and colleagues (2011). In addition, entrainment was achieved over a wider range of respiratory frequencies, with progressive decrease in ∫DIAEMG amplitude. These results indicate the potency of the respiratory response to preBötC photostimulation, compared to other brainstem structures that may influence respiratory rhythmicity.
When rats were maintained just below their apnoeic threshold, tonic photostimulation recruited rhythmic DIAEMG activity with a frequency that was not different from the animals’ baseline breathing rate. These results imply that an increase in excitability of preBötC neurons was sufficient to reinstate respiratory rhythmicity. In addition, when photostimulation was delivered to induce entrainment, respiratory activity was again driven to 180 bpm and DIAEMG contractions followed photostimulation pulses faithfully with short delays. In both cases, at the end of photostimulation we did not observe any additional DIAEMG contractions, indicating that the effect is strictly dependent on the imposed excitation provided by photoactivation. Again, these results are even more dramatic than what observed following RTN photostimulation (Abbott et al. 2009, 2011).
PreBötC photostimulation produces respiratory reset
Together with previous indications of the importance of the preBötC in inspiratory rhythm generation (Feldman et al. 2013), our demonstration of an excitatory stimulus-induced reset of ongoing respiratory activity constitutes very strong evidence of a direct perturbation to the inspiratory oscillator. PreBötC photostimulation generated a Type 0 resetting. Consistent with this nomenclature (Winfree, 2001), this reset was robust, occurred quickly, and was associated with short-latency recruitment of inspiratory diaphragmatic activity. In addition, suggestive of an excitatory perturbation that has an effect primarily on burst initiation, respiratory rhythm was minimally perturbed when photostimulation occurred during inspiration. Indeed, we would only expect interruption of the ongoing inspiratory event and subsequent reset during inspiration via inhibitory mechanisms, as demonstrated recently with selective stimulation of glycinergic neurons in the preBötC (Sherman et al. 2015). Interestingly, we have previously observed such inhibitory reset during optogenetic stimulation of the expiratory rhythm generator (pFRG) which probably has reciprocal connections with the preBötC (Pagliardini et al. 2011) and could also provide a strong, phase-independent, Type 0 reset. In contrast to pFRG stimulation, however, reset in the present work was achieved at shorter latencies and did not involve activation of expiratory musculature.
It is of note that previous studies have also investigated respiratory rhythm reset by means of direct stimulation of brainstem regions associated with breathing or their afferent systems (Eldridge, 1972b; Speck & Feldman, 1982; Paydarfar & Eldridge, 1987; Oku & Dick, 1992; Abbott et al. 2011; Bonis et al. 2013). While those using electrical stimulation are perhaps difficult to resolve because of the ill-defined locus of excitation it is thought that stimuli that do perturb respiration in this manner would ultimately exert their effects on the rhythm generator. Here, by directly targeting preBötC directly, we were able to consistently obtain inspiratory recruitment and reset upon stimulation.
Similar to in vitro holographic stimulation of a few preBötC inspiratory neurons (Kam et al. 2013b), we identified the presence of a refractory period of ∼200 ms following an inspiratory event during which another burst could not be triggered by optogenetic stimulation, suggesting that this is an intrinsic property of the preBötC inspiratory network both in in vitro and in vivo conditions. A speculative mechanism to be tested is strong post-excitatory inhibition that shunts even strong excitatory inputs.
Conclusions
In summary, our results further support the key role of preBötC network in respiratory rhythmogenesis. As we have shown, excitation of this network potently drives, entrains and resets inspiratory activity. Our data demonstrate that excitatory mechanisms in the interconnected preBötC network are sufficient for pacing rhythmic inspiration. Given the importance of respiratory rhythmogenesis for survival, it will be of substantial interest to understand the precise cellular and circuit mechanisms of how this oscillation is generated.
Acknowledgments
We thank Drs G. Funk and J. Greer for insightful comments on previous versions of the manuscript and discussion of the results.
Glossary
- ABDEMG
external oblique abdominal EMG
- ChR2
channelrhodopsin
- DIAEMG
diaphragmatic EMG
- GFP
green fluorescent protein
- GGEMG
genioglossal EMG
- HF
high frequency
- NeuN
neuronal nuclear marker
- NK1R
receptor for substance P
- pFRG
parafacial respiratory group
- preBötC
preBötzinger complex
- RTN
retrotrapezoid nucleus
- SST
somatostatin peptide
- TE
expiratory time
- TH
tyrosine hydroxylase enzyme
- Ti
inspiratory time

minute ventilation
- VT
tidal volume
Additional information
Competing interests
The authors declare no competing financial interests.
Author contributions
ZA, SP designed and performed the experiments; ZA, CTD and SP analysed data; ZA, CTD and SP wrote the article.
Funding
Research funded by NGR Alberta Lung Association and NSERC operating grants (S.P.). Z.A. is funded by King Saud bin Abdulaziz University for Health Sciences College of Medicine (Saudi Arabia). C.T.D. is an Alberta Innovates (Health Solutions) scholar.
References
- Abbott SB, Coates MB, Stornetta RL, Guyenet PG. Optogenetic stimulation of c1 and retrotrapezoid nucleus neurons causes sleep state-dependent cardiorespiratory stimulation and arousal in rats. Hypertension. 2013;61:835–841. doi: 10.1161/HYPERTENSIONAHA.111.00860. [DOI] [PMC free article] [PubMed] [Google Scholar]
- Abbott SB, DePuy SD, Nguyen T, Coates MB, Stornetta RL, Guyenet PG. Selective optogenetic activation of rostral ventrolateral medullary catecholaminergic neurons produces cardiorespiratory stimulation in conscious mice. J Neurosci. 2013b;33:3164–3177. doi: 10.1523/JNEUROSCI.1046-12.2013. [DOI] [PMC free article] [PubMed] [Google Scholar]
- Abbott SB, Kanbar R, Bochorishvili G, Coates MB, Stornetta RL, Guyenet PG. C1 neurons excite locus coeruleus and A5 noradrenergic neurons along with sympathetic outflow in rats. J Physiol. 2012;590:2897–2915. doi: 10.1113/jphysiol.2012.232157. [DOI] [PMC free article] [PubMed] [Google Scholar]
- Abbott SB, Stornetta RL, Coates MB, Guyenet PG. Phox2b-expressing neurons of the parafacial region regulate breathing rate, inspiration, and expiration in conscious rats. J Neurosci. 2011;31:16410–16422. doi: 10.1523/JNEUROSCI.3280-11.2011. [DOI] [PMC free article] [PubMed] [Google Scholar]
- Abbott SB, Stornetta RL, Fortuna MG, Depuy SD, West GH, Harris TE, Guyenet PG. Photostimulation of retrotrapezoid nucleus phox2b-expressing neurons in vivo produces long-lasting activation of breathing in rats. J Neurosci. 2009;29:5806–5819. doi: 10.1523/JNEUROSCI.1106-09.2009. [DOI] [PMC free article] [PubMed] [Google Scholar]
- Aravanis AM, Wang LP, Zhang F, Meltzer LA, Mogri MZ, Schneider MB, Deisseroth K. An optical neural interface: in vivo control of rodent motor cortex with integrated fiberoptic and optogenetic technology. J Neural Eng. 2007;4:S143–156. doi: 10.1088/1741-2560/4/3/S02. [DOI] [PubMed] [Google Scholar]
- Bonis JM, Neumueller SE, Krause KL, Pan LG, Hodges MR, Forster HV. Contributions of the Kolliker-Fuse nucleus to coordination of breathing and swallowing. Resp Physiol Neurobiol. 2013;189:10–21. doi: 10.1016/j.resp.2013.06.003. [DOI] [PMC free article] [PubMed] [Google Scholar]
- Bouvier J, Thoby-Brisson M, Renier N, Dubreuil V, Ericson J, Champagnat J, Pierani A, Chedotal A, Fortin G. Hindbrain interneurons and axon guidance signaling critical for breathing. Nat Neurosci. 2010;13:1066–1074. doi: 10.1038/nn.2622. [DOI] [PubMed] [Google Scholar]
- Clement EA, Richard A, Thwaites M, Ailon J, Peters S, Dickson CT. Cyclic and sleep-like spontaneous alternations of brain state under urethane anaesthesia. PLoS ONE. 2008;3:e2004. doi: 10.1371/journal.pone.0002004. [DOI] [PMC free article] [PubMed] [Google Scholar]
- Dick TE, Oku Y, Romaniuk JR, Cherniack NS. Interaction between central pattern generators for breathing and swallowing in the cat. J Physiol. 1993;465:715–730. doi: 10.1113/jphysiol.1993.sp019702. [DOI] [PMC free article] [PubMed] [Google Scholar]
- Dobbins EG, Feldman JL. Differential innervation of protruder and retractor muscles of the tongue in rat. J Comp Neurol. 1995;357:376–394. doi: 10.1002/cne.903570305. [DOI] [PubMed] [Google Scholar]
- Doi A, Ramirez JM. Neuromodulation and the orchestration of the respiratory rhythm. Resp Physiol Neurobiol. 2008;164:96–104. doi: 10.1016/j.resp.2008.06.007. [DOI] [PMC free article] [PubMed] [Google Scholar]
- Drummond GB. Reporting ethical matters in The Journal of Physiology: standards and advice. J Physiol. 2009;587:713–719. doi: 10.1113/jphysiol.2008.167387. [DOI] [PMC free article] [PubMed] [Google Scholar]
- Eldridge FL. The effect of intermittent carotid sinus nerve and carotid body stimulation on respiratory output. Chest. 1972a;61(Suppl.)):44S. doi: 10.1016/s0012-3692(15)32696-9. [DOI] [PubMed] [Google Scholar]
- Eldridge FL. The importance of timing on the respiratory effects of intermittent carotid sinus nerve stimulation. J Physiol. 1972b;222:297–318. doi: 10.1113/jphysiol.1972.sp009798. [DOI] [PMC free article] [PubMed] [Google Scholar]
- Eldridge FL, Paydarfar D, Wagner PG, Dowell RT. Phase resetting of respiratory rhythm: effect of changing respiratory "drive". Am J Physiol Regul Integr Comp Physiol. 1989;257:R271–R277. doi: 10.1152/ajpregu.1989.257.2.R271. [DOI] [PubMed] [Google Scholar]
- Feldman JL, Del Negro CA, Gray PA. Understanding the rhythm of breathing: so near, yet so far. Ann Rev Physiol. 2013;75:423–452. doi: 10.1146/annurev-physiol-040510-130049. [DOI] [PMC free article] [PubMed] [Google Scholar]
- Fritschy JM, Frondoza CG, Grzanna R. Differential effects of reserpine on brainstem catecholaminergic neurons revealed by Fos protein immunohistochemistry. Brain Res. 1991;562:48–56. doi: 10.1016/0006-8993(91)91185-4. [DOI] [PubMed] [Google Scholar]
- Funk GD, Milsom WK, Steeves JD. Coordination of wingbeat and respiration in the Canada goose. I. Passive wing flapping. J Appl Physiol. 1992;73:1014–1024. doi: 10.1152/jappl.1992.73.3.1014. [DOI] [PubMed] [Google Scholar]
- Gargaglioni LH, Bicegoa KC, Branco LG. Brain monoaminergic neurons and ventilatory control in vertebrates. Resp Physiol Neurobiol. 2008;164:112–122. doi: 10.1016/j.resp.2008.04.017. [DOI] [PubMed] [Google Scholar]
- Gariepy JF, Missaghi K, Chevallier S, Chartre S, Robert M, Auclair F, Lund JP, Dubuc R. Specific neural substrate linking respiration to locomotion. Proc Natl Acad Sci U S A. 2012;109:E84–92. doi: 10.1073/pnas.1113002109. [DOI] [PMC free article] [PubMed] [Google Scholar]
- Giraudin A, Le Bon-Jego M, Cabirol MJ, Simmers J, Morin D. Spinal and pontine relay pathways mediating respiratory rhythm entrainment by limb proprioceptive inputs in the neonatal rat. J Neurosci. 2012;32:11841–11853. doi: 10.1523/JNEUROSCI.0360-12.2012. [DOI] [PMC free article] [PubMed] [Google Scholar]
- Granata AR, Numao Y, Kumada M, Reis DJ. A1 noradrenergic neurons tonically inhibit sympathoexcitatory neurons of C1 area in rat brainstem. Brain Res. 1986;377:127–146. doi: 10.1016/0006-8993(86)91198-4. [DOI] [PubMed] [Google Scholar]
- Gray PA, Hayes JA, Ling GY, Llona I, Tupal S, Picardo MC, Ross SE, Hirata T, Corbin JG, Eugenin J, Del Negro CA. Developmental origin of preBotzinger complex respiratory neurons. J Neurosci. 2010;30:14883–14895. doi: 10.1523/JNEUROSCI.4031-10.2010. [DOI] [PMC free article] [PubMed] [Google Scholar]
- Gray PA, Janczewski WA, Mellen N, McCrimmon DR, Feldman JL. Normal breathing requires preBotzinger complex neurokinin-1 receptor-expressing neurons. Nat Neurosci. 2001;4:927–930. doi: 10.1038/nn0901-927. [DOI] [PMC free article] [PubMed] [Google Scholar]
- Gray PA, Rekling JC, Bocchiaro CM, Feldman JL. Modulation of respiratory frequency by peptidergic input to rhythmogenic neurons in the preBotzinger complex. Science. 1999;286:1566–1568. doi: 10.1126/science.286.5444.1566. [DOI] [PMC free article] [PubMed] [Google Scholar]
- Guyenet PG, Stornetta RL, Bayliss DA. Retrotrapezoid nucleus and central chemoreception. J Physiol. 2008;586:2043–2048. doi: 10.1113/jphysiol.2008.150870. [DOI] [PMC free article] [PubMed] [Google Scholar]
- Hayes JA, Wang X, Del Negro CA. Cumulative lesioning of respiratory interneurons disrupts and precludes motor rhythms in vitro. Proc Natl Acad Sci U S A. 2012;109:8286–8291. doi: 10.1073/pnas.1200912109. [DOI] [PMC free article] [PubMed] [Google Scholar]
- Henry JP, Botton D, Sagne C, Isambert MF, Desnos C, Blanchard V, Raisman-Vozari R, Krejci E, Massoulie J, Gasnier B. Biochemistry and molecular biology of the vesicular monoamine transporter from chromaffin granules. J Exp Biol. 1994;196:251–262. doi: 10.1242/jeb.196.1.251. [DOI] [PubMed] [Google Scholar]
- Hodges MR, Richerson GB. Contributions of 5-HT neurons to respiratory control: neuromodulatory and trophic effects. Resp Physiol Neurobiol. 2008;164:222–232. doi: 10.1016/j.resp.2008.05.014. [DOI] [PMC free article] [PubMed] [Google Scholar]
- Janczewski WA, Feldman JL. Distinct rhythm generators for inspiration and expiration in the juvenile rat. J Physiol. 2006;570:407–420. doi: 10.1113/jphysiol.2005.098848. [DOI] [PMC free article] [PubMed] [Google Scholar]
- Janczewski WA, Tashima A, Hsu P, Cui Y, Feldman JL. Role of inhibition in respiratory pattern generation. J Neurosci. 2013;33:5454–5465. doi: 10.1523/JNEUROSCI.1595-12.2013. [DOI] [PMC free article] [PubMed] [Google Scholar]
- Kam K, Worrell JW, Janczewski WA, Cui Y, Feldman JL. Distinct inspiratory rhythm and pattern generating mechanisms in the preBotzinger complex. J Neurosci. 2013a;33:9235–9245. doi: 10.1523/JNEUROSCI.4143-12.2013. [DOI] [PMC free article] [PubMed] [Google Scholar]
- Kam K, Worrell JW, Ventalon C, Emiliani V, Feldman JL. Emergence of population bursts from simultaneous activation of small subsets of preBotzinger complex inspiratory neurons. J Neurosci. 2013b;33:3332–3338. doi: 10.1523/JNEUROSCI.4574-12.2013. [DOI] [PMC free article] [PubMed] [Google Scholar]
- Koizumi H, Koshiya N, Chia JX, Cao F, Nugent J, Zhang R, Smith JC. Structural-functional properties of identified excitatory and inhibitory interneurons within pre-Botzinger complex respiratory microcircuits. J Neurosci. 2013;33:2994–3009. doi: 10.1523/JNEUROSCI.4427-12.2013. [DOI] [PMC free article] [PubMed] [Google Scholar]
- Koshiya N, Oku Y, Yokota S, Oyamada Y, Yasui Y, Okada Y. Anatomical and functional pathways of rhythmogenic inspiratory premotor information flow originating in the pre-Botzinger complex in the rat medulla. Neuroscience. 2014;268C:194–211. doi: 10.1016/j.neuroscience.2014.03.002. [DOI] [PubMed] [Google Scholar]
- Kuwana S, Tsunekawa N, Yanagawa Y, Okada Y, Kuribayashi J, Obata K. Electrophysiological and morphological characteristics of GABAergic respiratory neurons in the mouse pre-Botzinger complex. Eur J Neurosci. 2006;23:667–674. doi: 10.1111/j.1460-9568.2006.04591.x. [DOI] [PubMed] [Google Scholar]
- Lalley PM. Opioidergic and dopaminergic modulation of respiration. Resp Physiol Neurobiol. 2008;164:160–167. doi: 10.1016/j.resp.2008.02.004. [DOI] [PMC free article] [PubMed] [Google Scholar]
- Lambas-Senas L, Chamba G, Fety R, Renaud B. Comparative responses of the central adrenaline- and noradrenaline-containing neurons after reserpine injections. Biochem Pharmacol. 1986;35:2207–2211. doi: 10.1016/0006-2952(86)90593-9. [DOI] [PubMed] [Google Scholar]
- Li Y-Q, Takada M, Mizuno N. Identification of premotor interneurons which project bilaterally to the trigeminal motor, facial or hypoglossal nuclei: a fluorescent retrograde double-labeling study in the rat. Brain Res. 1993;611:160–164. doi: 10.1016/0006-8993(93)91789-u. [DOI] [PubMed] [Google Scholar]
- McCrimmon DR, Feldman JL, Speck DF. Respiratory motoneuronal activity is altered by injections of picomoles of glutamate into cat brain stem. J Neurosci. 1986;6:2384–2392. doi: 10.1523/JNEUROSCI.06-08-02384.1986. [DOI] [PMC free article] [PubMed] [Google Scholar]
- McKay LC, Janczewski WA, Feldman JL. Sleep-disordered breathing after targeted ablation of preBotzinger complex neurons. Nat Neurosci. 2005;8:1142–1144. doi: 10.1038/nn1517. [DOI] [PMC free article] [PubMed] [Google Scholar]
- Moore JD, Deschenes M, Furuta T, Huber D, Smear MC, Demers M, Kleinfeld D. Hierarchy of orofacial rhythms revealed through whisking and breathing. Nature. 2013;497:205–210. doi: 10.1038/nature12076. [DOI] [PMC free article] [PubMed] [Google Scholar]
- Moore JD, Kleinfeld D, Wang F. How the brainstem controls orofacial behaviors comprised of rhythmic actions. Trends Neurosci. 2014;37:370–380. doi: 10.1016/j.tins.2014.05.001. [DOI] [PMC free article] [PubMed] [Google Scholar]
- Morgado-Valle C, Baca SM, Feldman JL. Glycinergic pacemaker neurons in PreBotzinger complex of neonatal mouse. J Neurosci. 2010;30:3634–3639. doi: 10.1523/JNEUROSCI.3040-09.2010. [DOI] [PMC free article] [PubMed] [Google Scholar]
- Oku Y, Dick TE. Phase resetting of the respiratory cycle before and after unilateral pontine lesion in cat. J Appl Physiol. 1992;72:721–730. doi: 10.1152/jappl.1992.72.2.721. [DOI] [PubMed] [Google Scholar]
- Pagliardini S, Janczewski WA, Tan W, Dickson CT, Deisseroth K, Feldman JL. Active expiration induced by excitation of ventral medulla in adult anesthetized rats. J Neurosci. 2011;31:2895–2905. doi: 10.1523/JNEUROSCI.5338-10.2011. [DOI] [PMC free article] [PubMed] [Google Scholar]
- Pagliardini S, Ren J, Greer JJ. Ontogeny of the pre-Botzinger complex in perinatal rats. J Neurosci. 2003;23:9575–9584. doi: 10.1523/JNEUROSCI.23-29-09575.2003. [DOI] [PMC free article] [PubMed] [Google Scholar]
- Paydarfar D, Eldridge FL. Phase resetting and dysrhythmic responses of the respiratory oscillator. Am J Physiol Regul Integr Comp Physiol. 1987;252:R55–R62. doi: 10.1152/ajpregu.1987.252.1.R55. [DOI] [PubMed] [Google Scholar]
- Paydarfar D, Eldridge FL, Kiley JP. Resetting of mammalian respiratory rhythm: existence of a phase singularity. Am J Physiol Regul Integr Comp Physiol. 1986;250:R721–R727. doi: 10.1152/ajpregu.1986.250.4.R721. [DOI] [PubMed] [Google Scholar]
- Paydarfar D, Eldridge FL, Paydarfar JA. Phase resetting of the respiratory oscillator by carotid sinus nerve stimulation in cats. J Physiol. 1998;506:515–528. doi: 10.1111/j.1469-7793.1998.515bw.x. [DOI] [PMC free article] [PubMed] [Google Scholar]
- Potts JT, Rybak IA, Paton JF. Respiratory rhythm entrainment by somatic afferent stimulation. J Neurosci. 2005;25:1965–1978. doi: 10.1523/JNEUROSCI.3881-04.2005. [DOI] [PMC free article] [PubMed] [Google Scholar]
- Schuldiner S. A molecular glimpse of vesicular monoamine transporters. J Neurochem. 1994;62:2067–2078. doi: 10.1046/j.1471-4159.1994.62062067.x. [DOI] [PubMed] [Google Scholar]
- Schwarzacher SW, Rub U, Deller T. Neuroanatomical characteristics of the human pre-Botzinger complex and its involvement in neurodegenerative brainstem diseases. Brain. 2011;134:24–35. doi: 10.1093/brain/awq327. [DOI] [PubMed] [Google Scholar]
- Sherman D, Worrell JW, Cui Y, Feldman JL. Optogenetic perturbation of preBotzinger complex inhibitory neurons modulates respiratory pattern. Nat Neurosci. 2015;18:408–414. doi: 10.1038/nn.3938. [DOI] [PMC free article] [PubMed] [Google Scholar]
- Smith JC, Ellenberger HH, Ballanyi K, Richter DW, Feldman JL. Pre-Botzinger complex: a brainstem region that may generate respiratory rhythm in mammals. Science. 1991;254:726–729. doi: 10.1126/science.1683005. [DOI] [PMC free article] [PubMed] [Google Scholar]
- Solomon IC, Edelman NH, Neubauer JA. Patterns of phrenic motor output evoked by chemical stimulation of neurons located in the pre-Botzinger complex in vivo. J Neurophysiol. 1999;81:1150–1161. doi: 10.1152/jn.1999.81.3.1150. [DOI] [PubMed] [Google Scholar]
- Speck DF, Feldman JL. The effects of microstimulation and microlesions in the ventral and dorsal respiratory groups in medulla of cat. J Neurosci. 1982;2:744–757. doi: 10.1523/JNEUROSCI.02-06-00744.1982. [DOI] [PMC free article] [PubMed] [Google Scholar]
- Stornetta RL, Rosin DL, Wang H, Sevigny CP, Weston MC, Guyenet PG. A group of glutamatergic interneurons expressing high levels of both neurokinin-1 receptors and somatostatin identifies the region of the pre-Botzinger complex. J Comp Neurol. 2003;455:499–512. doi: 10.1002/cne.10504. [DOI] [PubMed] [Google Scholar]
- Tan W, Janczewski WA, Yang P, Shao XM, Callaway EM, Feldman JL. Silencing preBotzinger complex somatostatin-expressing neurons induces persistent apnea in awake rat. Nat Neurosci. 2008;11:538–540. doi: 10.1038/nn.2104. [DOI] [PMC free article] [PubMed] [Google Scholar]
- Tan W, Pagliardini S, Yang P, Janczewski WA, Feldman JL. Projections of preBotzinger complex neurons in adult rats. J Comp Neurol. 2010;518:1862–1878. doi: 10.1002/cne.22308. [DOI] [PMC free article] [PubMed] [Google Scholar]
- Thoby-Brisson M, Trinh JB, Champagnat J, Fortin G. Emergence of the pre-Botzinger respiratory rhythm generator in the mouse embryo. J Neurosci. 2005;25:4307–4318. doi: 10.1523/JNEUROSCI.0551-05.2005. [DOI] [PMC free article] [PubMed] [Google Scholar]
- Wang H, Germanson TP, Guyenet PG. Depressor and tachypneic responses to chemical stimulation of the ventral respiratory group are reduced by ablation of neurokinin-1 receptor-expressing neurons. J Neurosci. 2002;22:3755–3764. doi: 10.1523/JNEUROSCI.22-09-03755.2002. [DOI] [PMC free article] [PubMed] [Google Scholar]
- Wang X, Hayes JA, Revill AL, Song H, Kottick A, Vann NC, LaMar MD, Picardo MC, Akins VT, Funk GD, Del Negro CA. Laser ablation of Dbx1 neurons in the pre-Botzinger complex stops inspiratory rhythm and impairs output in neonatal mice. eLife. 2014;3:e03427. doi: 10.7554/eLife.03427. [DOI] [PMC free article] [PubMed] [Google Scholar]
- Wenninger JM, Pan LG, Klum L, Leekley T, Bastastic J, Hodges MR, Feroah TR, Davis S, Forster HV. Large lesions in the pre-Botzinger complex area eliminate eupneic respiratory rhythm in awake goats. J Appl Physiol. 2004;97:1629–1636. doi: 10.1152/japplphysiol.00953.2003. [DOI] [PubMed] [Google Scholar]
- Winfree AT. The Geometry of Biological Time. New York: Springer; 2001. [Google Scholar]
- Winter SM, Fresemann J, Schnell C, Oku Y, Hirrlinger J, Hulsmann S. Glycinergic interneurons are functionally integrated into the inspiratory network of mouse medullary slices. Pflugers Arch. 2009;458:459–469. doi: 10.1007/s00424-009-0647-1. [DOI] [PMC free article] [PubMed] [Google Scholar]
- Winter SM, Fresemann J, Schnell C, Oku Y, Hirrlinger J, Hulsmann S. Glycinergic interneurons in the respiratory network of the rhythmic slice preparation. Adva Exp Med Biol. 2010;669:97–100. doi: 10.1007/978-1-4419-5692-7_20. [DOI] [PubMed] [Google Scholar]
- Woch G, Ogawa H, Davies RO, Kubin L. Behavior of hypoglossal inspiratory premotor neurons during the carbachol-induced, REM sleep-like suppression of upper airway motoneurons. Exp Brain Res. 2000;130:508–520. doi: 10.1007/s002219900244. [DOI] [PubMed] [Google Scholar]
- Zar JH. Biostatistical Analysis. Upper Saddle River, NJ, USA: Prentice Hall; 1996. [Google Scholar]