

Abstract
Chronic constriction injury of rat sciatic nerve promotes signs of neuropathic pain. This is associated with an increase in the level of interleukin 1β (IL-1β) in primary afferents that peaks at 7 days. This initial cytokine exposure has been proposed to trigger an enduring alteration in neuronal phenotype that underlies chronic hyper-excitability in sensory nerves, which initiates and maintains chronic neuropathic pain. We have shown previously that 5–6 days of exposure of rat dorsal root ganglia (DRGs) to 100 pm IL-1β increases the excitability of medium-sized neurons. We have now found using whole-cell recording that this increased excitability reverts to control levels within 3–4 days of cytokine removal. The effects of IL-1β were dominated by changes in K+ currents. Thus, the amplitudes of A-current, delayed rectifier and Ca2+-sensitive K+ currents were reduced by ∼68%, ∼64% and ∼36%, respectively. Effects of IL-1β on other cation currents were modest by comparison. There was thus a slight decrease in availability of high voltage-activated Ca2+ channel current, a small increase in rates of activation of hyperpolarization-activated cyclic nucleotide-gated channel current (IH), and a shift in the voltage dependence of activation of tetrodotoxin-sensitive sodium current (TTX-S INa) to more negative potentials. It is unlikely, therefore, that direct interaction of IL-1β with DRG neurons initiates an enduring phenotypic shift in their electrophysiological properties following sciatic nerve injury. Persistent increases in primary afferent excitability following nerve injury may instead depend on altered K+ channel function and on the continued presence of slightly elevated levels IL-1β and other cytokines.
Key points
Neuropathic pain resulting from peripheral nerve injury is initiated and maintained by persistent ectopic activity in primary afferent neurons.
Sciatic nerve injury increases the excitability of medium-sized dorsal root ganglion (DRG) neurons. Levels of the inflammatory cytokine interleukin 1β (IL-1β) increase and peak after 7 days.
Five to six days of exposure of medium sized DRG neurons to 100 pm IL-1β promotes persistent increases in excitability which abate within 3–4 days of cytokine removal. This is associated with a profound attenuation of K+ channel currents but only modest increases in function of cyclic nucleotide-sensitive hyperpolarization-activated channels (HCNs) and of voltage-gated Na+ and Ca2+ channel currents.
It is unlikely, therefore, that direct interaction of IL-1β with DRG neurons is capable of initiating an enduring phenotypic shift in their electrophysiological properties that follows sciatic nerve injury.
The findings also underline the importance of K+ channel modulation in the actions of inflammatory mediators on peripheral neurons.
Introduction
Pain is a vital physiological process that signals actual or potential tissue damage. By so doing, it protects from injury and secures the survival of the species. By contrast, injury to the somatosensory system can produce ‘neuropathic’ pain that lasts for months or years after any injury has healed (Treede et al. 2008; Costigan et al. 2009). This maladaptive ‘disease of pain’ has a 1.5–3% prevalence within the general population (Gilron et al. 2006) and can be associated with diabetic, postherpetic or HIV-related neuropathies, fibromyalgia and osteoarthritis, and traumatic nerve, spinal cord or brain injury (including stroke) (Baron et al. 2010). Several lines of evidence implicate a transient, inflammatory response in the initiation of neuropathic pain (Watkins & Maier, 2002; Scholz & Woolf, 2007). This initial response is thought to produce slower genomic changes that lead, over a period of weeks or months, to a chronic neuropathic state.
Although acute exposure of dorsal root ganglion (DRG) neurons to pro-inflammatory cytokines such as interleukin 1β (IL-1β) is known to increase their excitability (Binshtok et al. 2008), little is known about the aftermath of cytokine exposure and how this may trigger enduring changes in neuronal excitability and/or phenotype as a result of altered expression of ion channels and/or their regulatory proteins (Stemkowski & Smith, 2012b).
Sciatic nerve chronic constriction injury (CCI) is one of several rodent models used to study the aetiology of neuropathic pain (Mosconi & Kruger, 1996; Kim et al. 1997). This has been reported to increase levels of IL-1β in sciatic nerve extracts (Nadeau et al. 2011). Since cytokine levels peak at 7 days (Nadeau et al. 2011), we recently examined the effect of 5–6 days of exposure of DRG neurons to IL-1β (100 pm). As is seen with acute application (Binshtok et al. 2008), we found that prolonged exposure to IL-1β increases the excitability of medium-diameter neurons and small isolectin B4 (IB4)-positive neurons, but large neurons and small IB4 negative neurons were less affected (Stemkowski & Smith, 2012a). Because nocigenic ectopic activity in sensory nerves can persist for weeks, months or years after an initial insult (Govrin-Lippmann & Devor, 1978; Wall et al. 1979; Abdulla & Smith, 2001a; Pitcher & Henry, 2008; Devor et al. 2014; Vaso et al. 2014) and may play a major role in the maintenance of chronic pain (Sukhotinsky et al. 2004; Pitcher & Henry, 2008; Vaso et al. 2014), we asked whether this transient, 5–6 days of, exposure to IL-1β (Stemkowski & Smith, 2012a) can produce irreversible increases in sensory neuron excitability. If this were the case, it would implicate IL-1β as an insigator of a shift in the phenotype of sensory nerves that contributes to chronic neuropathic pain (Nitzan-Luques et al. 2011). We studied medium-sized DRG neurons as, in addition to there relative high sensitivity to IL-1β (Stemkowski & Smith, 2012a), their excitability, as well as that of their associated Aδ fibres, is increased following peripheral nerve injury (Kajander & Bennett, 1992; Abdulla & Smith, 2001a; Ma et al. 2003).
Changes in the properties of ion channels in medium-sized DRG neurons following various types of chronic nerve injury have been chracterised (Baccei & Kocsis, 2000; Abdulla & Smith, 2001b, 2002; Yao et al. 2003; Tan et al. 2006; Stemkowski & Smith, 2012b), but little is known of how these channels may be affected by IL-1β. Addressing this question represents a second objective of our study. Experiments were done in neuron-enriched cultures to minimize any indirect effects of IL-1β mediated via macrophages or glial cells. Preliminary reports of some of these findings have appeared (Stemkowski & Smith, 2010; Stemkowski et al. 2011).
Methods
Ethical approval
All experimental procedures were reviewed and approved by the University of Alberta Health Sciences Laboratory Animal Services Welfare Committee, and complied with the guidelines of the Canadian Council for Animal Care.
Primary cell cultures
Male Sprague–Dawley rats (18–20 days old) were killed with a high dose of 1.5 g kg−1 ethyl carbamate (urethane; i.p.; Sigma, St Louis, MO, USA). DRGs (14–21 per animal) were aseptically dissected from thoracic and lumbar spinal segments and collected in Dulbecco's modified Eagle's medium supplemented with 10% heat-inactivated horse serum (DMEMHS; both from Gibco, Grand Island, NY, USA). Ganglia were treated for 1.5 h at 34°C with 0.125% type IV collagenase (Worthington, Lakewood, NJ, USA), washed twice in Ca2+/Ba2+-free phosphate buffered saline (PBS), treated with 0.25% trypsin from bovine pancreas (Sigma) in PBS for 30 min, washed 3 times in DMEMHS and finally taken up in 2 ml of DMEMHS containing 80 μg ml−1 type IV DNAse (Sigma) and 100 μg ml−1 soybean trypsin inhibitor (Worthington). A single-cell suspension was then readily obtained by trituration of the enzymatically softened ganglia by six to eight passages through the tip of a 1 ml Eppendorf pipette. Neurons were plated the following day after neuronal cell enrichment.
Neuronal cell enrichment
Neuronal cell enrichment (Lindsay, 1988) was aimed at minimizing any effects of IL-1β mediated indirectly as a result of actions on mitotic (non-neuronal) cells that may be present in the cultures and the subsequent release of mediators, such as eicosanoids and growth factors. Non-neuronal cells were largely eliminated at the outset by the use of differential adhesion and treatment with anti-mitotic agents, followed by differential sedimentation procedures. More specifically, dissociated ganglia were plated (in DMEMHS supplemented with the anti-mitotic combination of cytosine 3-d-arabino-furanoside (Ara-C), uridine and 5-fluoro-2′-deoxyuridine (all from Sigma and all at 10 μm)) in two 50 mm culture dishes (preplates; Corning, NY, USA) previously coated with 3 μg ml−1 polyornithine (Sigma). After 15–20 h, the non-neuronal cells became firmly attached to the dish, while most of the neurons were only weakly adherent to the dish or to flattened non-neuronal cells. Then, by carefully removing the culture medium, most dead cells and axonal and myelin debris were discarded prior to selectively dislodging the attached neurons with a gentle stream of serum free defined medium (DMEM supplemented with 1/100 N-2 supplement and 1/100 penicillin–streptomycin–amphotericin B (all from Gibco)) delivered from a 1 ml Eppendorf pipette. The neurons from the two preplates were collected in a total of 12 ml of defined medium in a conical test tube. Further neuronal enrichment was achieved by centrifugation of the cell suspension at 28 g for 5 min, whereupon viable neurons are lightly pelleted, leaving myelin debris, dead cells and small non-neuronal cells in suspension. The supernatant was discarded and the cells were then re-suspended in 1 ml of defined medium. At 100 μl volumes, the cells were plated onto 35 mm tissue culture dishes (Nunc, Roskilde, Denmark) pre-coated with 3 μg ml−1 polyornithine (Sigma) and 2 μg ml−1 laminin (Sigma). Dishes were then filled with a serum-free defined medium at ∼2 ml per dish. Cells were maintained at 36.5°C, 95% air, 5% CO2. Medium was exchanged every 72 h.
Treatment of DRG neurons
After 3 days in culture, dishes were divided into two treatment groups: 100 pm IL-1β (Peprotech, Rocky Hill, NJ, USA; prepared in 0.1% BSA (Sigma)) and control (0.1% BSA). Treatments were applied for the following 5–6 days, with defined medium exchanges every 72 h.
Two other groups were pretreated with 50 ng ml−1 nerve growth factor (NGF; Alomone Labs, Jerusalem, Israel; prepared in 0.1% BSA (Sigma) dissolved in Hepes-buffered saline solution (HBSS)) following the initial DRG isolation (Day 0). After 3 days in culture with NGF, dishes were divided into two groups, both of which received continued supplementation with 50 ng ml−1 NGF. One group of cultures received 100 pm IL-1β (Peprotech; prepared in 0.1% BSA (Sigma)), and the other served as control (0.1% BSA). Treatments were applied for the following 5–6 days, with defined medium (supplemented with 50 ng ml−1 NGF) exchanges every 72 h.
To examine recovery from IL-1β effects, cultures were exposed to cytokine for 5–6 days as described above and then maintained in culture without cytokine for a further 3–4 days prior to electrophysiological analysis. Control cultures were maintained for 10–12 days prior to study. These protocols are illustrated schematically in Fig.1.
Figure 1. Scheme to show time course of exposure of cultured neurons to IL-1β and NGF.
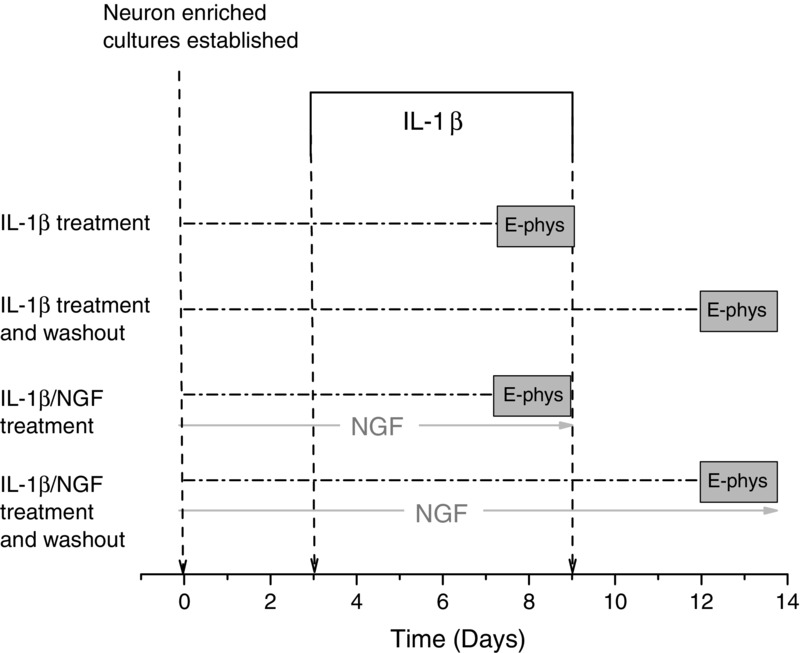
Relevant control experiments for each experimental protocol were carried out with the omission of IL-1β.
Subclassification of DRG neurons
Based on previously established criteria, DRG neurons were classified according to soma diameter as ‘small’ (<30 μm), ‘medium’ (30–40 μm), or ‘large’ (>40 μm) as measured with a calibrated micrometer fitted to the eye-piece of a Nikon TE300 inverted fluorescence microscope (Nikon, Toronto, ON, Canada). All recordings were made from neurons with medium-sized cell bodies, which are likely to represent a mixed population of nociceptive and non-nociceptive afferents (Aδ-fibres) (Harper & Lawson, 1985; Lawson, 2002).
Electrophysiology
Whole-cell recordings (at room temperature, 22°C) were made using an Axoclamp 2A amplifier (Axon Instruments, Foster City, CA, USA) in either bridge-balance current-clamp mode or discontinuous single-electrode voltage-clamp mode as described previously (Abdulla & Smith, 2001a,b, 2002). With regard to voltage-clamp studies, low resistance patch electrodes (2–5 MΩ) permitted the use of high switching frequencies >30 kHz with high clamp gains (8–30 mV nA−1). The effectiveness of the voltage-clamp was confirmed by examining recordings of the command voltage, and recordings from neurons where the voltage trace was slow to rise or distorted were discarded. The total volume of fluid in the recording dishes was ∼1 ml. The Petri dishes were superfused at a flow rate of 2 ml min−1. Input capacitance (Cin) was calculated from the membrane time constant and input resistance or by the integration of the capacitative transient generated by a 10 mV voltage step (Abdulla & Smith, 1997a,b). In current-clamp, external solution contained (in mm): 127 NaCl, 2.5 KCl, 1.2 NaH2PO4, 26 NaHCO3, 2.5 CaCl2, 1.3 MgSO4 and 25 d-glucose saturated with 95% O2–5% CO2. Internal (pipette) solution contained (in mm): 130 potassium gluconate, 4 Mg-ATP, 0.3 Na-GTP, 10 EGTA, 2 CaCl2 and 10 Hepes (adjusted to pH 7.2 with KOH; osmolarity 310–320 mosmol l−1). Current-clamp recordings were made at resting membrane potential (RMP). All-points histograms (Li & Baccei, 2011) were generated by assigning the original digital points into 10 mV bins. These were used to summarize and describe action potential (AP) discharge in responses to a 450 ms current ramp to 2 nA.
Na+ channel current (INa) was recorded in an external solution containing the following (in mm): 75 TEA-Cl, 50 NaCl (to improve voltage-clamp control), 5 KCl, 4 MgCl2, 10 Hepes and 60 d-glucose (adjusted to pH 7.4 with NaOH; osmolarity 330 mosmol l−1). Internal solution contained the following (in mm): 140 CsCl, 10 NaCl, 2 MgATP, 0.3 Na2GTP, 2 EGTA, 10 Hepes and 2 MgCl2 (adjusted to pH 7.2 with NaOH; osmolarity 300–310 mosmol l−1). Tetrodotoxin (TTX) (Alomone Labs, Jerusalem, Israel) (300 nm) was applied by superfusion. Total INa was recorded in response to 40 ms depolarizing voltage commands from a holding potential (Vh) of −90 mV and leak subtracted by means of a P/6 protocol. Thus, a series of one-sixth amplitude, reversed polarity voltage commands were applied, and the recorded currents multiplied by 6 and added to the recordings of INa. Current decay (fast inactivation) was fitted with a single exponent function:
For voltage dependence of activation, normalized (I/I−20) I–V curves were fitted with a single Boltzmann function, y = A2 + (A1 − A2)/(1 + exp((x − x0)/dx)). The INa steady-state fast inactivation protocol involved 300 ms prepulses increasing from −110 mV followed by 10 ms test pulses to −10 mV to determine the fraction of current available (I/I−110). The INa steady-state slow inactivation protocol involved application of 5 s prepulses, followed by 20 ms recovery pulses to −120 mV (to allow recovery from fast inactivation), followed by 10 ms test pulses to −10 mV to determine the fraction of current available (I/I−120). To obtain the TTX- resistant and -sensitive (TTX-R and TTX-S, respectively) components of the current, currents persisting in the presence of 300 nm TTX (TTX-R INa) were subtracted from the corresponding values of total INa to reveal TTX-S INa.
For recording K+ channel currents, external solution contained (in mm): 145 N-methyl-d-glucamine (NMG)-Cl, 10 KCl, 2.5 CaCl2, 10 Hepes, 1.0 MgCl2 and10 d-glucose (adjusted to pH 7.4 with HCl; 320 mosmol l−1). Internal solution contained (in mm): 100 potassium gluconate, 40 NMG-Cl, 2 Mg-ATP, 0.3 Na2GTP, 11 EGTA, 10 Hepes and 0.1 CaCl2 (adjusted to pH 7.2 with HCl; 300 mosmol l−1). In view of the complexity and variability of potassium currents in DRG neurons (Gold et al. 1996; Everill & Kocsis, 1999) a relatively simplified approach was used for their isolation. Total K+ channel current (IK) was recorded at voltages between −60 mV and +60 mV following a 500 ms conditioning prepulse (Vp) to −120 mV or −30 mV and leak subtracted by means of a P/6 protocol. Voltage commands were then repeated in the presence of 5 mm Mn2+ to reveal Mn2+-resistant IK. Digital subtraction of Mn2+-resistant IK (Vp = −120 mV) from the total IK (Vp = −120 mV) yielded Mn2+-sensitive IK, which corresponded to the total Ca2+-sensitive K+ conductance (IK,Ca) (Abdulla & Smith, 2001b). IA type K+ currents were obtained by subtracting Mn2+-resistant IK recorded following a −30 mV prepulse from that recorded following a −120 mV prepulse.
ICa was measured using Ba2+ as a charge carrier (IBa). For these experiments, external ‘Ba2+’ solution contained (in mm): 160 TEA-Cl, 10 Hepes, 2 BaCl2, 10 d-glucose and 300 nm TTX (adjusted to pH 7.4 with TEA-OH; osmolarity 330–340 mosmol l−1). Internal solution contained (in mm): 120 CsCl, 5 Mg-ATP, 0.4 Na2-GTP,10 EGTA and 20 Hepes (adjusted to pH 7.2 with CsOH; osmolarity 300–310 mosmol l−1). IBa was evoked using a series of 150 ms depolarizing voltage commands from Vh = −100 mV or Vh = −60 mV and leak subtracted by means of a P/6 protocol. For the voltage dependence of IBa inactivation, the fraction of current available at command potential (Vcmd) = −10 mV was determined in response to a series of 3.5 s incremental prepulses from Vh = −110 mV. Normalized (I/I−110) inactivation curves were fitted with a single Boltzmann function, y = A2 + (A1 − A2)/(1 + exp((x − x0)/dx)).
Current through hyperpolarization-activated cyclic nucleotide-gated (HCN) channels (IH) was recorded in an external solution containing the following (in mm): 150 NaCl, 5 KCl, 2.5 CaCl2,1 MgCl2, 10 Hepes and 10 d-glucose (adjusted to pH 7.4 with NaOH; osmolarity 330–340 mosmol l−1). Internal solution contained (in mm): 130 potassium gluconate, 2 Mg-ATP, 0.3 Na-GTP, 11 EGTA, 10 Hepes and 1 CaCl2 (adjusted to pH 7.2 with KOH; osmolarity 310–320 mosmol l−1). IH was elicited by a series of hyperpolarizing voltage commands (from −60 mV to −130 mV) that were also decremental in duration (from 4.25 s to 2.5 s) from a Vh of −50 mV. The time course for the activation of IH was fitted with the sum of a two exponential function:
For the voltage dependence of activation, the conductance ratio, G/G−130, was calculated from tail current (IH,Tail) amplitudes measured 100–200 ms after repolarization and curves were fitted with a single Boltzmann function, y = A2 + (A1 − A2)/(1 + exp((x − x0)/dx)).
Analysis and statistics
All electrophysiological data were acquired and analysed using pCLAMP10 software (Axon Instruments/Molecular Devices). Figures were produced with Origin 9.1 (OriginLab, Northampton, MA, USA). Where applicable, data are presented as means ± standard error of the mean (SEM). Statistical comparisons were made with Student's unpaired t test or Fisher's exact test. P values from these statistical tests were determined using GraphPad Prism 5.00 (GraphPad Software, San Diego, CA, USA). Statistical significance was taken as P < 0.05.
Results
Effects of long-term IL-1β exposure on neuronal excitability
We used all-points histograms (Li & Baccei, 2011) to illustrate and clarify our previous observation that the excitability of medium diameter rat DRG neurons increases after 5–6 days of exposure to 100 pm IL-1β (Stemkowski & Smith, 2012a). The original digital points used to describe action potential (AP) discharge in response to a 450 ms current ramp to 2 nA were assigned to 10 mV bins starting at −20 mV (Fig.2A). We collected and pooled 2500 digital points from each of 19 control, medium-diameter neurons and from 19 others exposed to cytokine. The presence of more points in all bins positive to −25 mV is indicative of increased AP discharge in the continued presence of IL-1β (Fig.2C). To better quantify this effect on a neuron-by-neuron basis, we counted the number of data points occurring above −25 mV in each of 29 control neurons and 22 IL-1β treated medium neurons. Since different acquisition rates were used for some of these neurons, data were expressed as the percentage of points above −25 mV. The mean percentage of points acquired in the IL-1β treated neurons was significantly greater that that obtained from control neurons (Fig.2D, P < 0.05). Sample recordings to illustrate IL-1β induced increases in excitability are shown in Fig.2E and F.
Figure 2. Long-term IL-1β exposure reversibly increases DRG neuron excitability.
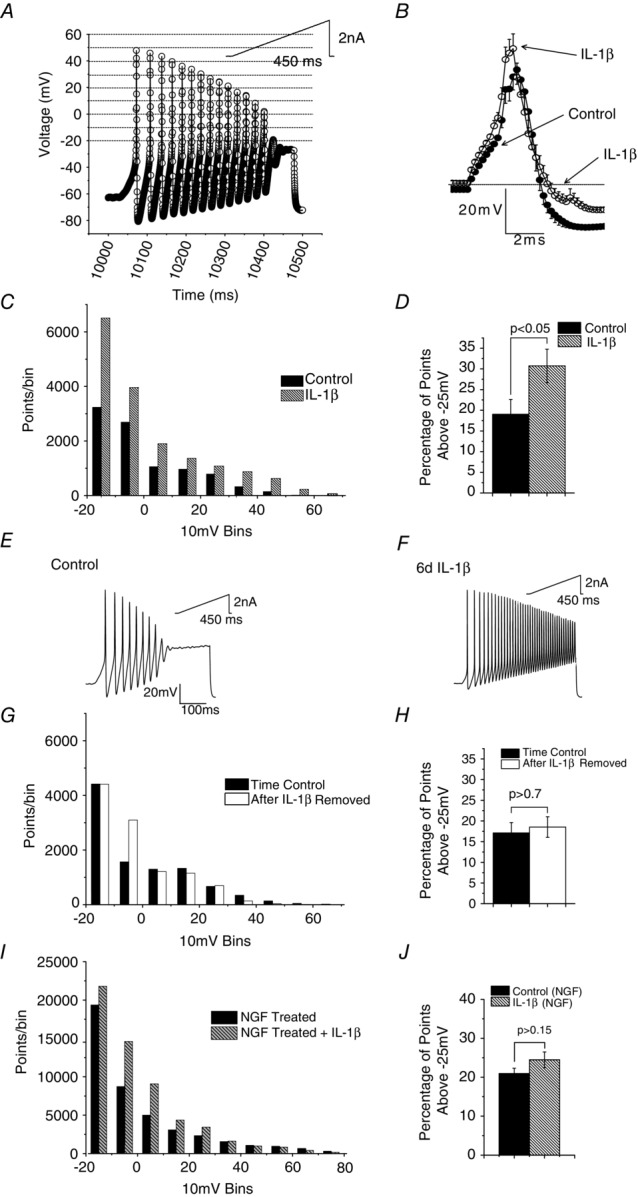
A, depiction of original digital points used to describe AP discharge in a medium-sized neuron in response to 450 ms depolarizing current ramp to +2.0 nA (inset). Digital points were assigned to 10 mV bins, starting at −20 mV and shown by dotted lines in the figure. B, averaged AP waveforms from 12 control medium-diameter neurons and 19 neurons exposed to IL-1β for 5–6 days. Note increase in spike height and attenuation of AHP. C, all points histogram derived from 2500 digital points collected from 19 control medium-diameter neurons and from 19 others exposed to cytokine. Note the presence of more points in bins positive to −25 mV. D, increase in percentage of points above −25 mV in the continued presence of IL-1β indicative of increased AP discharge (data from 29 control neurons and 22 in the presence of IL-1β, P < 0.05 Student's t test). E and F, sample data records of discharge evoked by 450 ms ramps to 2 nA in a control neuron and one exposed to IL-1β for 6 days. G, all points histogram to show lack of long lasting change in excitability as a consequence of 5–6 days of IL-1β exposure. Points from 25 control neurons which were maintained in culture for 12–14 days without exposure to cytokine and from 25 neurons examined 3–4 days after a previous 5–6 days of exposure to IL-1β. Data from 8000 data points obtained from responses to 250 ms ramps to +2.0 nA. H, comparison of the percentage of digital points in each neuron above −25 mV reveals no persistent increase in excitability as a result of IL-1β exposure and removal (P > 0.7). I, all points histogram to show lack of effect of 5–6 days of IL-1β exposure on neurons treated with NGF (50 ng ml−1). Points from 30 neurons which were maintained in culture in the presence of NGF and from another 30 NGF-treated neurons examined 3–4 days after a previous 5–6 days of exposure to IL-1β (refer to Fig.1). Data from 8000 data points obtained from responses to 250 ms ramps to +2 nA. J, comparison of the percentage of digital points in each neuron above −25 mV reveals no increase in excitability of NGF treated neurons in response to 5–6 days of IL-1β exposure (P > 0.7). Error bars in B, D, H and J represent SEM.
IL-1β-induced changes in single action potential parameters in medium neurons were dominated by a decrease in AP afterhyperpolarization (AHP) and increase in spike height (Fig.2B). Although full numerical data and statistics are presented in our previous publication (Stemkowski & Smith, 2012a), this presentation of the data was obtained by averaging the original AP recordings from 12 control neurons and 12 treated with IL-1β.
Reversibility of IL-1β effects
If the above actions of IL-1β reflect the initiation of a long-term or even a permanent change in the electrophysiological phenotype of medium neurons, they should persist when the cytokine is removed. To test this possibility, we exposed 25 medium neurons to IL-1β for 5–6 days and then examined excitability after a further 3–4 days (see Fig.1). The control data were obtained from another 25 untreated neurons left for a total of 12–14 days in culture. All-points histogram data from 8000 points per neuron are shown in Fig.2G. For most 10 mV bins (apart from the −10 mV bin), the number of points acquired from control neurons does not appear to differ from those treated with IL-1β. The effects of 5–6 days of exposure to IL-1β thus reverse within 3–4 days. This is supported by the analysis of the same data shown in Fig.2H, which shows the mean percentage of digital points in each cell recorded above −25 mV. There is no difference between points acquired from control neurons (n = 25) and points acquired from neurons that had previously received a transient 5–6 days of exposure to IL-1β (n = 25, P > 0.7).
Rationale for omission of NGF from cultures
Culture protocols for DRG neurons often involve the inclusion of NGF as this is required for maintenance of normal neuronal phenotypes (Chalazonitis et al. 1987; Dib-Hajj et al. 1998; Everill & Kocsis, 2000). There is however documented overlap of the downstream signalling pathways engaged by IL-1β and NGF. For example, the Ras-MAPK pathway (Kaplan & Stephens, 1994) and ERK1/2 phosphorylation (Yang et al. 2013) are activated by both ligands. We used immunoblots to confirm that IL-1β promotes phosphorylation of ERK1 and ERK2 in DRG neuron cultures (Stemkowski, Smith and Posse de Chaves, unpublished observations). We also found that inclusion of NGF (50 ng ml−1, 5 days, see Fig.1) greatly increased medium cell excitability and occluded effects of IL-1β. Thus in all-points histograms obtained from voltage responses to current ramps, there is no significant difference in the percentage of points above −25 mV between NGF treated neurons (n = 30) and neurons treated with NGF plus IL-1β (n = 30, P > 0.15, Fig.2I and J). In view of these findings, we omitted NGF from our cultures when studying effects of IL-1β on ionic currents. These findings can thus be directly related to our previous studies of effects of IL-1β on excitability where NGF was also omitted (Stemkowski & Smith, 2012a).
Effects of long-term IL-1β exposure on INa
Total INa was recorded from medium-diameter DRG neurons in NGF-free defined medium culture using a series of 40 ms depolarizing voltage commands from Vh = −90 mV (Fig.3Aa). To improve voltage-clamp control, Na+ concentration in the external solution was reduced to 50 mm. Using a Cs+ based electrode solution to block K+ currents, neurons were then treated with 300 nm TTX to isolate TTX-S INa from TTX-R INa (Fig.3Ab). Digital subtraction (Fig.3Ac) reveals that, under these NGF-free culture conditions, all measurable current in all 20 medium-diameter neurons was TTX-S INa.
Figure 3. Five to six days of IL-1β exposure increases the availability of TTX-S INa in medium-diameter DRG neurons.

A, INa recorded before and after superfusion of 300 nm TTX. Digital subtraction of currents in Ab from those in Aa reveals that all measurable current in medium-diameter neurons cultured in the absence of NGF was TTX-S INa (Ac). Voltage recordings corresponding to the recorded currents are shown in the lower record of Aa. B, current–voltage plot. TTX-S INa density for IL-1β treated medium-diameter neurons was not significantly different from control (0.05 < P ≤ 0.1) at voltage commands between −10 mV and +20 mV. However, peak TTX-S INa occurred at Vcmd = −20 mV for control neurons (−261 ± 48 pA pF−1, n = 9), whereas peak current density occurred at −30 mV for neurons exposed to IL-1β (−176 ± 44 pA pF−1, n = 11). C, normalized activation (I/I−20) curves (circles) were fit with a single Boltzmann function. IL-1β produced a significant hyperpolarizing shift on values for V1/2 (from −32.5 ± 2.6 mV, n = 9 to −41.4 ± 2.2 mV, n = 11). Slope factor was unaffected (control, 3.6 ± 1.1 mV, n = 9 vs. IL-1β: 3.3 ± 0.5 mV, n = 11). Single Boltzmann function fits of steady-state fast inactivation (I/I−110) curves (triangles) reveal that IL-1β had no significant effect on values for V1/2 (control, −61.3 ± 1.9 mV, n = 7 vs. IL-1β: −62.0 ± 0.9 mV, n = 11) or slope factor (control, 7.7 ± 0.8 mV, n = 7 vs. IL-1β: 8.8 ± 0.9 mV, n = 11). D, single Boltzmann function fits of normalized steady-state slow inactivation (I/I−120) curves reveal that IL-1β had no significant effect on values for V1/2 (control, −62.4 ± 6.1 mV, n = 5 vs. IL-1β: −57.8 ± 2.5 mV, n = 5; P > 0.05) or slope factor (control, 13.5 ± 1.9 mV, n = 5 vs. IL-1β: 13.6 ± 1.1 mV, n = 5). E, single exponential fits of TTX-S INa decay reveal no differences in the kinetics for fast inactivation in response to IL-1β treatment (Vcmd = −40 mV; control, 1.53 ± 0.59 ms, n = 5 vs. IL-1β: 1.82 ± 0.61 ms, n = 11). Error bars indicate means ± SEM. Significant difference versus control *P < 0.05 with unpaired t test. Traces in A were not subtracted for leak current. Vm in panels B–E refers to recorded membrane voltage.
Effects of IL-1β on TTX-S INa density were generally very modest. The I–V plot in Fig.3B appears to show that TTX-S INa for IL-1β treated medium-diameter neurons is actually smaller than control at voltage commands between −10 mV and +20 mV but this difference is not significant (0.05 < P ≤ 0.1, unpaired t test). However, peak TTX-S INa occurred at −20 mV for control neurons (−261 ± 48 pA pF−1, n = 9), but at −30 mV for neurons exposed to IL-1β (−176 ± 44 pA pF−1, n = 11, Fig.3B). Consistent with this finding, single Boltzmann function fitting of the curves for the voltage dependence of activation revealed that the average voltage midpoint (V1/2) was significantly shifted leftward (hyperpolarizing shift in TTX-S INa activation) after long-term IL-1β exposure (from −32.5 ± 2.6 mV, n = 9 to −41.4 ± 2.2 mV, n = 11; P < 0.05, unpaired t test; Fig.3C, also see Table 1). By contrast with gNa activation, IL-1β exposure failed to produce a significant shift in the curves for fast or slow inactivation (Fig.3C and D, respectively). Single exponential fits of TTX-S INa decay in medium-diameter neurons revealed no differences in the kinetics for fast inactivation in response to IL-1β treatment (Fig.3E).
Table 1.
Summary of single Boltzmann function parameters in control versus IL-1β treated medium-diameter DRG neurons
| Parameter | Control | IL-1β |
|---|---|---|
| INa activation V1/2 (mV) | −32.5 ± 2.6 mV (9) | −41.4 ± 2.2 mV (11)* |
| INa activation slope factor (mV) | 3.6 ± 1.1 mV (9) | 3.3 ± 0.5 (11) |
| INa steady-state fast inactivation V1/2 (mV) | −61.3 ± 1.9 mV (7) | −62.0 ± 0.9 (11) |
| INa steady-state fast inactivation slope factor (mV) | 7.7 ± 0.8 mV (7) | 8.8 ± 0.9 (11) |
| INa steady-state slow inactivation V1/2 (mV) | −62.4 ± 6.1 mV (5) | −57.8 ± 2.5 (5) |
| INa steady-state slow inactivation slope factor (mV) | 13.5 ± 1.9 mV (5) | 13.6 ± 1.1 (5) |
| IBa inactivation V1/2 (mV) | −45.3 ± 13.8 mV (7) | −78.8 ± 5.9 (13)* |
| IBa slope factor (mV) | 15.0 ± 2.2 mV (7) | 17.8 ± 1.4 (13)† |
| IH steady-state activation V1/2 (mV) | −70.7 ± 2.7 mV (9) | −65.9 ± 5.1 mV (10) |
| IH slope factor (mV) | 12.2 ± 1.6 mV (9) | 10.7 ± 1.7 (10) |
Values are means ± SEM (n). Significant difference versus control *P < 0.05 and †P < 0.01 with unpaired t test.
Effects of long-term IL-1β exposure on K+ currents
By contrast with its rather weak actions on INa (Fig.3), ICa and IH (see below), IL-1β promoted profound suppression of K+ currents. Voltage-clamp protocols and solutions were designed to examine both voltage- and Ca2+-dependent K+ currents (IK,Ca), since reductions in these currents are implicated in increased sensory neuron excitability and broadening of APs following peripheral nerve injury (Everill & Kocsis, 1999; Abdulla & Smith, 2001b; Kim et al. 2002). Since at least six types of K+ current can be recorded in the cell bodies of DRG neurons (Gold et al. 1996), we used a simplified approach to investigate the effects of long-term IL-1β exposure. We recorded total IK and Mn2+-resistant IK, and obtained Mn2+-sensitive IK and IA by subtraction and/or by adjusting holding potential (Vh).
Figure 4Aa illustrates total IK evoked by a series of depolarizing voltage commands from −120 mV in a medium-sized DRG neuron. Figure 4Ab illustrates Mn2+-resistant IK recorded in the same neuron in the presence of 5 mm Mn2+. Figure 4Ac is the subtraction of records in Fig.4Ab from those in Fig.4Aa to reveal Mn2+-sensitive IK, which corresponds to IK,Ca. Figure 4Ba illustrates Mn2+-resistant IK recorded from −120 mV in another neuron and Fig.4Bb illustrates Mn2+-resistant currents recorded in the same neuron following a prepulse to −30 mV. Subtraction of recordings in Fig.4Bb from those in Fig.4Ba reveals a rapidly activating/rapidly inactivating current that we have termed IA, recognizing that it may reflect activation of multiple channel types (Gold et al. 1996).
Figure 4. Five to six days of IL-1β exposure decreases IA density, as well as Mn2+-resistant and Mn2+-sensitive IK densities in medium-diameter DRG neurons.

Aa, family of total outward K+ currents recorded at voltages between −60 mV and +60 mV after a 500 ms conditioning prepulse to −120 mV. Ab, responses of the same neuron as in Aa to the same series of voltage commands in the presence of 5 mm Mn2+. Ac, subtraction of records in Ab from those in Aa to reveal Mn2+-sensitive IK (recordings of membrane voltage shown in lower trace). Ba, Mn2+-resistant IK recorded in another medium-sized neuron in the presence of 5 mm Mn2+ from a prepulse potential of −120 mV (recordings of membrane voltage shown in lower trace). Bb, recordings of currents evoked in the same neuron in presence of Mn2+, but from a prepulse potential of −30 mV (recordings of membrane voltage shown in lower trace). Bc, subtraction of data records in Bb from those in Ba to yield IA. C, averaged I–V curves reveal that Mn2+-resistant IK densities recorded from a prepulse potential of −30 mV were substantially smaller following exposure to long-term IL-1β with significant reductions at command voltages −20 mV to +60 mV (for example, peak non-inactivating IK density (Vcmd = +60 mV), from +169 ± 25 pA pF−1, n = 9 to +62 ± 10 pA pF−1, n = 16; P < 0.001). D, representative traces illustrating suppressed Mn2+-resistant IK in medium-diameter neurons exposed to IL-1β (grey trace) versus control (black trace; the voltage recording shown in lower trace is the from control neuron). E, I–V plot to illustrate that IL-1β also significantly suppressed IA density (at +60 mV control, +31 ± 9 pA pF−1, n = 10 vs. IL-1β, +13 ± 4 pA pF−1, n = 16; P < 0.05). F, representative traces illustrating suppressed peak IA in medium-diameter neurons exposed to IL-1β (grey trace) versus control (black trace; the voltage recording shown in lower trace is the from control neuron). G, averaged I–V curves indicate that IL-1β exposure significantly suppressed Mn2+-sensitive IK densities with significant reductions at command voltages between −40 mV and +60 mV (for example, peak inactivating Mn2+-sensitive IK density, from +98 ± 16 pA pF−1, n = 12 to +51 ± 10 pA pF−1, n = 16; P < 0.05). H, representative traces illustrating suppressed peak Mn2+-sensitive IK in medium-diameter neurons exposed to IL-1β (grey trace) versus control (black trace; the voltage recording shown in lower trace is from the control neuron). Error bars indicate means ± SEM. Significant difference versus control *P < 0.05, †P < 0.01 and §P < 0.001 with unpaired t test. Traces in A and B were not subtracted for leak current. All displayed voltages traces and values of Vm are from recordings of membrane voltage.
IL-1β produced profound suppression of Mn2+-resistant IK in medium-sized neurons (Fig.4C). Thus at +60 mV, steady-state current density was reduced from 169 ± 25 pA pF−1, n = 9 to 62 ± 10 pA pF−1, n = 16 (P < 0.001, unpaired t test, Fig.4C; a ∼64% decrease). Figure 4D illustrates representative records of Mn2+-resistant IK recorded at +60 mV in the absence or presence of IL-1β.
Ninety per cent (9/10) of control and 94% (15/16) of IL-1β treated medium-diameter neurons had measurable IA (P > 0.05, Fisher's exact test). Similar to Mn2+-resistant IK (Fig.4C), there was a significant reduction in IA density (for example, at +60 mV IA density was reduced from a control value of 31 ± 9 pA pF−1, n = 10 to 13 ± 4 pA pF−1, n = 16 in the presence of IL-1β; P < 0.05, unpaired t test; Fig.4E; an ∼68% decrease). Figure 4F illustrates representative records of IA recorded at +60 mV in the presence and absence of IL-1β.
IL-1β exposure also reduced Mn2+-sensitive IK density. Thus at +60 mV, current density was reduced from 98 ± 16 pA pF−1, n = 12 to 51 ± 10 pA pF−1, n = 16 (P < 0.05, unpaired t test; Fig.4G; a ∼36% decrease). Further, at command voltages between −30 mV and +10 mV, IL-1β reduced the size of the characteristic of gK,Ca ‘hump’ in the N-shaped I–V curve (Fig.4G) Figure 4H illustrates representative records of Mn2+-sensitive IK recorded at +60 mV in the presence and absence of IL-1β.
Figure 4C, E and G also illustrates that IL-1β failed to affect membrane resistance at potentials between −60 and −30 mV, indicating no effect on leak conductance as might be expected from the lack of effect of cytokine on the RMP of medium-diameter neurons (Stemkowski & Smith, 2012a). These findings (Fig.4C–H) do nevertheless imply that IL-1β attenuated delayed rectifier K+ currents (i.e. Mn2+-resistant IK), as well as IA and IK,Ca.
Effects of long-term IL-1β exposure on ICa/IBa
Ba2+ was substituted for Ca2+ as the charge carrier, and currents (IBa) were evoked using a series of 150 ms depolarizing voltage commands from −100 mV or from a holding potential reflective of their normal RMP (Vh = −60 mV). The I–V plots shown in Fig.5A were obtained using Vh = −100 mV. From this voltage, 5–6 days of IL-1β treatment significantly increased medium neuron IBa densities at command voltages between −40 mV and −20 mV (unpaired t test, P < 0.01). High voltage activated (HVA)-IBa peak current density (recorded at Vm = −10 mV) in the presence of IL-1β (−154 ± 12 pA pF−1, n = 14) appeared larger than that recorded in control cultures (−107 ± 22 pA pF−1, n = 9), but this effect fell just short of attaining significance (unpaired t test, 0.05 < P ≤ 0.1).
Figure 5. Effects of 5–6 days of IL-1β exposure on IBa in medium-diameter DRG neurons.
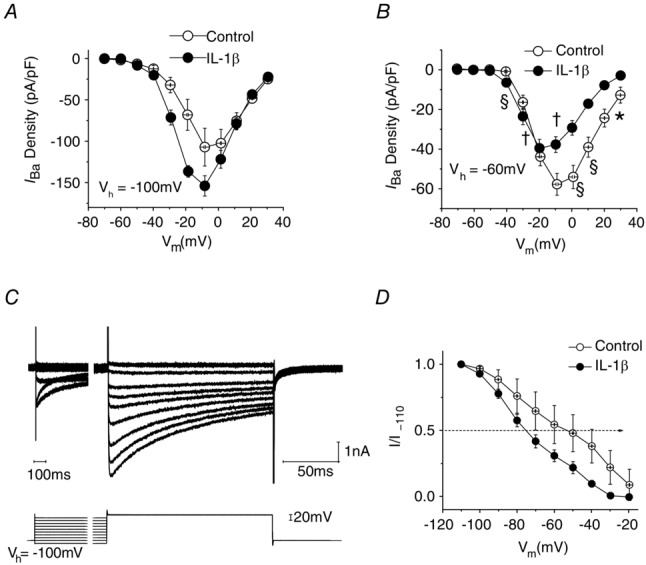
A, I–V plot shows that IL-1β exposure results in a slight increase in average IBa density in neurons studied from Vh = −100 mV. B, by contrast, when Vh = −60 mV I–V plots reveal a significant reduction in averaged IBa peak density (Vcmd = −10 mV) in neurons exposed to IL-1β (from −58 ± 6 pA pF−1, n = 10 to −38 ± 4 pA pF−1, n = 11; P < 0.01). C, representative traces illustrating currents and voltage protocols used to determine voltage dependence of inactivation. D, single Boltzmann function fitting of curves for the voltage dependence of inactivation reveal that IL-1β exposure led to a significant leftward shift (hyperpolarizing shift in IBa inactivation) in the values for V1/2 (illustrated by dotted line with arrowhead), whereas slope factor was unaffected. Error bars indicate means ± SEM. Significant difference versus control *P < 0.05, †P < 0.01 and §P < 0.001 with unpaired t test.
By contrast, IL-1β caused a significant reduction in peak IBa density in medium-diameter DRG neurons when currents were evoked from Vh = −60 mV. At −10 mV, IBa was reduced from 58 ± 6 pA pF−1, n = 10 to 38 ± 4 pA pF−1, n = 11 (P < 0.01, unpaired t test; Fig.5B). Unlike our previous studies of acutely dissociated medium-diameter neurons (Abdulla & Smith, 2001b), we were unable to detect appreciable T-type Ca2+ currents using Vh = −100 mV under the culture conditions that were employed.
To examine the possibility that reductions in the peak density of IBa seen when Vh = −60 mV are related to an effect of IL-1β on the voltage dependence of inactivation, the fraction of current available at −10 mV was determined following a series of 3.5 s prepulses to potentials between −110 and −20 mV. Recordings from a typical experiment are illustrated in Fig.5C. Although peak IBa density recorded at −10 mV from Vh = −100 mV was 51.57 ± 9.6 pA pF−1 (n = 9) and this was unchanged in the presence of IL-1β (58.52 ± 8.0 pA pF−1; n = 13, P > 0.5), there was a significant shift in V1/2 from a control value of −45.3 ± 13.8 mV (n = 7) to −78.8 ± 5.9 mV (n = 13) for IL-1β treated neurons (P = 0.02). Slope factor was unaffected (15.0 ± 2.2 mV, n = 7 for control neurons compared with 17.8 ± 1.4 mV, n = 13 for IL-1β treated neurons; P = 0.27; Fig.5D and Table 1). These findings imply that IL-1β may affect both density and inactivation of HVA ICa/IBa but close to the normal resting potential of medium neurons (−60 mV), the effect of increased inactivation dominates so that the amplitude of the observed current is decreased.
Effects of long-term IL-1β exposure on IH
Hyperpolarization-activated cation currents (IH) carried by HCN channels are present in many types of DRG neuron (Mayer & Westbrook, 1983; Scroggs et al.1994; Abdulla & Smith, 2001b; Emery et al. 2011). Since increases in IH in DRG neurons have been associated with various types of peripheral nerve injury (Chaplan et al. 2003; Yao et al. 2003; Emery et al. 2011), the effect of long-term IL-1β exposure on IH was examined. From Vh = −50 mV, IH was elicited by a series of incremental, hyperpolarizing voltage commands (from −60 to −130 mV) that were decremental in duration (from 4.25 to 2.5 s; Fig.6A). This voltage protocol was designed to maximize capture of steady-state IH activation, yet provide stable voltage-clamp recordings at very negative voltages. All 10 control medium-diameter neurons that were studied exhibited a robust IH at −90 mV (342 ± 91pA, n = 10). As reported by Abdulla & Smith (2001b), the inward current consisted of an initial instantaneous current (IINST), followed by slower inward relaxation (IH) that became larger and that developed more rapidly at more negative voltages (Fig.6A and B inset). Although the averaged I–V plots shown in Fig.6B appear to show that exposure to IL-1β increases IH density in medium-diameter neurons at voltage commands between −60 and −90 mV, these differences were not significant (Vcmd = −80 mV; from −6 ± 1 pA pF−1 in control neurons, n = 9 to −11 ± 2 pA pF−1, n = 12 in IL-1β treated neurons; 0.05 < P ≤ 0.1, unpaired t test). The effect of IL-1β on steady-state activation for IH was also examined. As described by Kouranova et al. (2008), the conductance ratio, g/g−130, was calculated from tail current (IH,Tail) amplitudes measured 100–200 ms after repolarization (Fig.6C inset) and g–V relationships for IH steady-state activation were then plotted (Fig.6C). The averaged g–V curves, however, are nearly superimposed and single Boltzmann function fitting of the steady-state activation curves for IH reveals that IL-1β exposure had no significant effect on the values for V1/2 of activation (control, −70.7 ± 2.7 mV, n = 9 vs. IL-1β, −65.9 ± 5.1, n = 10; P > 0.05, unpaired t test; Fig.6C, also see Table 1) or slope factor (control, 12.2 ± 1.6 mV, n = 9 vs. IL-1β, 10.7 ± 1.7 mV, n = 10; P > 0.05, unpaired t test).
Figure 6. Five to six days of IL-1β exposure increases the availability of IH in medium-diameter DRG neurons.

A, IH was elicited by a series of incremental hyperpolarizing voltage commands (from −60 mV to −130 mV from Vh = −50 mV). Voltage commands decreased in duration (from 4.25 s to 2.5 s). Voltage trace in lower part of panel is a recording of membrane voltage. B, averaged I–V plots to illustrate IH densities (n = 9 for control, n = 12 for recordings in IL-1β). There was no significant difference in IH density at any of the voltages illustrated. Inset shows that the inward current consisted of an initial instantaneous current (IINST), followed by slower inward relaxation (IH). C, the conductance ratio, g/g−130, was calculated from tail current (IH,Tail) amplitudes measured 100–200 ms after repolarization (inset). Single Boltzmann function fitting of steady-state activation curves for IH reveals that IL-1β had no significant effect on the values for V1/2 of activation (control, −70.7 ± 2.7 mV, n = 9 vs. IL-1β, −65.9 ± 5.1 mV, n = 10; P > 0.05) or slope factor (control, 12.2 ± 1.6 mV, n = 9 vs. IL-1β, 10.7 ± 1.7 mV, n = 10; P > 0.05). D, effect of voltage on fast activation time constant (τfast). In the presence of IL-1β, the rate of IH activation was increased. For example, at Vcmd = −70 mV τfast in control, 570.5 ± 92.0 ms, n = 5 vs. IL-1β, 294.0 ± 45.1, n = 11; P < 0.01. E, time constants for IH activation (τslow) were also significantly decreased in neurons exposed to IL-1β. For example, at Vcmd = −70 mV τslow in control, 4592.3 ± 1114.4 ms, n = 5 vs. IL-1β, 1800.4 ± 421.9, n = 11; P < 0.05). F, superimposition of a representative trace for a neuron exposed to IL-1β (grey trace) on that of a control neuron (black trace; Vcmd = −80 mV; the voltage recording shown in lower trace is from the control neuron). Note that IL-1β increased rates of IH activation. Error bars indicate means ± SEM. Significant difference versus control *P < 0.05, †P < 0.01 and §P < 0.001 with unpaired t test. Traces in A were not subtracted for leak current.
Despite the lack of a significant effect on IH density (Fig.6B) and steady-state activation (Fig.6C), IL-1β produced a clear effect on activation kinetics. Current onset was measured as the sum of two exponential functions as previously described by Kouranova et al. (2008). Since some individual IH traces (particularly those with low current amplitude <−80 pA) were better fitted by a single exponential function, they were omitted from the kinetic analysis. Figure 6D and E illustrates the voltage dependence of fast (τfast) and slow (τslow) time constants, respectively. Activation becomes faster toward negative voltages in both control neurons and those exposed to IL-1β. However, both fast and slow time constants became significantly decreased in IL-1β treated cell cultures over a command voltage range that overlapped with the greatest differences in IH densities (Vcmd = −70 mV τfast; control, 570.5 ± 92.0 ms, n = 5 vs. IL-1β, 294.0 ± 45.1 ms, n = 11; P < 0.01, unpaired t test; Fig.6D; and Vcmd = −70 mV τslow; control, 4592.3 ± 1114.4 ms, n = 5 vs. IL-1β, 1800.4 ± 421.9 ms, n = 11; P < 0.05, unpaired t test; Fig.6E). Figure 6F shows superimposed sample recordings of IH recorded from a control medium neuron and an IL-1β treated neuron.
Discussion
Reversibility of IL-1β effect
IL-1β is one of several early pro-inflammatory mediators that are generated by nerve injury. These initiate multiple processes that underlie the onset and chronic persistence of neuropathic pain (Watkins & Maier, 2002; Wolf et al. 2006; Gabay et al. 2011). To gain further insight into the underlying processes, we exposed neuron enriched DRG cultures to 100 pm IL-1β for 5–6 days as this coincided with the attainment of the peak level of IL-1β seen 7 days after peripheral nerve injury (Nadeau et al. 2011). Our results show that IL-1β-induced increases in excitability of medium-sized DRG neurons are reversible. This implies that a direct IL-1β–neuron interaction is not responsible for switching the phenotype of these neurons towards a permanent state that may favour increased excitability and spontaneous activity. This is not to say that a phenotypic shift does not occur as injury-induced changes in a both mRNA and protein levels in primary afferents have been described extensively (for reviews see Waxman et al. 1999; Costigan et al. 2009; Waxman & Zamponi, 2014). Our data simply imply that this change is not initiated by the direct effect of IL-1β on neurons.
Our findings do not rule out the possibility that the injury-induced increase in IL-1β triggers enduring increases in the excitability of DRG neurons via indirect processes involving other cell types. For example, another pro-inflammatory cytokine, tumour necrosis factor α (TNF-α) has been shown to polarize macrophages along a continuum toward a detrimental (M1) or a beneficial (M2) state in spinal cord injury (Kroner et al. 2014). Although IL-1β levels peak 7 days after sciatic nerve injury, they remain significantly elevated at 14 days post-injury. TNF-α levels also remain elevated at 14 days post-injury (Nadeau et al. 2011). Perhaps such levels are sufficient to increase DRG excitability in the long term. The possibility that the continued presence of inflammatory mediators, in addition to an overt phenotypic switch, may be involved in the long term maintenance of elevated DRG excitability is supported by the observation that intrathecal administration of IL-1Ra after the establishment neuropathic pain related behaviours in nerve injured animals is anti-allodynic (Mika et al. 2008; Gabay et al. 2011). It has also been shown that removal of the sciatic nerve cuff, and presumably irritation to the nerve, in CCI studies (Mosconi–Kruger model) after 1 or 5 days produces considerable attenuation of allodynia 20–30 days after initial placement (Dableh et al. 2011).
Properties of neurons in long-term DRG cell cultures
In order to deconstruct a complex system and to address the question of direct actions of IL-1β on neurons, we employed neuron enriched cultures to limit any effects of cytokines mediated indirectly by activation of other cell types. The presence of non-neuronal cells in DRG cell cultures and their known expression of IL-1RI (Copray et al. 2001) could present a substantial source for the production and release of undefined inflammatory mediators. Despite our attempts to limit growth of non-neuronal cells, both Schwann cells and fibroblasts (Lindsay, 1988) appeared to be present and increased in number with culture duration. Although Schwann cells can be a source of IL-1β (Watkins & Maier, 1999; Sommer & Kress, 2004), their increased presence was not concurrent with an increase in ambient levels of IL-1β (Stemkowski & Smith, 2012a).
Our decision to use defined medium without exogenously added neurotrophins was based on attempting to limit ambient activation of cell signalling pathways, such as MAPKs (MacGillivray et al. 2000; Lu et al. 2005; Binshtok et al. 2008) as these can also be recruited by the activation of the interleukin receptor (IL-1RI). This decision was validated by our finding that IL-1β failed to increase the excitability of NGF treated cultures (Fig 2I and J) and the unpublished observation that IL-1β promoted ERK phosphorylation in a similar manner to NGF.
Neurons maintained in neurotrophin-free defined medium expressed a slightly different electrophysiological phenotype from those that were acutely isolated (Abdulla & Smith, 2001b, 2002). Thus neither T-type Ca2+ channel current nor TTX-R INa were observed under our present conditions. This may not be a major issue as TTX-R INa makes up only 10% of the total current of acutely isolated medium sized DRG neurons (Abdulla & Smith, 2002). With regard to T-type Ca2+ current, it is not clear whether absence in our cultures represents loss of channel expression in otherwise functional DRG neurons, or complete loss of a subpopulation of neurons enriched with T-type Ca2+ current. The latter allows for the possibility that the medium-sized neurons supported in our DRG cultures are similar to acutely isolated medium-sized neuron subtypes with inherently less T-type Ca2+ current (Abdulla & Smith, 2001b).
Effects of IL-1β on ionic currents
Although a multiplicity of changes in various types of K+, Na+, Ca2+ and HCN channels undoubtedly contribute to increased primary afferent activity after nerve injury (Waxman & Zamponi, 2014) and these changes may reflect the actions of a wide variety of mediators including TNF-α, NGF, BDNF and prostaglandins, (Czeschik et al. 2008; Leung & Cahill, 2010; Chen et al. 2011; Stemkowski & Smith, 2012b), we see relatively weak actions of IL-1β on INa, ICa and IH and find that effects of IL-1β were dominated by decreases in K+ channel currents. Thus the amplitudes of A-current, delayed rectifier (Mn2+-resistant IK) and Ca2+-sensitive K+ currents (Mn2+-sensitive IK) were reduced by ∼68%, ∼64% and ∼36%, respectively.
It is unlikely that the effects of IL-1β on IK,Ca are secondary to changes in Ca2+ influx via Ca2+ channels as IL-1β promotes a substantial decrease in IK.Ca recorded from a holding potential of −120 mV (Fig.4G and H), yet total IBa recorded from negative holding potentials may be slightly increased (Fig.5A). Decreases in both the availability of gK,Ca (Abdulla & Smith, 2001b; Sarantopoulos et al. 2007) and voltage-gated potassium currents (Everill & Kocsis, 1999; Abdulla & Smith, 2001b; Kim et al. 2002) have been reported in DRG neurons after peripheral nerve injury. These findings may be expected if a persistent low level of IL-1β after the initial peak (Nadeau et al. 2011) is responsible for long-term attenuation of K+ currents after nerve injury.
Mechanisms of IL-1β action
Since the actions of IL-1β are reversible, it is unlikely that enduring alterations in the expression of ion channel protein (auxiliary or pore forming subunits) occur. There may, however, be alterations in ion channel trafficking, membrane insertion or phosphorylation which revert once the cytokine is removed. For example, IL-1β exposure can lead to the activation of extracellular signal regulated kinase (ERK) (Lu et al. 2005; Dobierzewska et al. 2012), which has been reported to directly phosphorylate specific residues within intracellular loop 1 (L1) of the NaV1.7 sodium channel, thereby allowing sodium channel activation at more hyperpolarized potentials (Stamboulian et al. 2010). This would be consistent with our observation for TTX-S INa shown in Fig.3C. Other kinases may also be recruited, including p38 MAPK (Funakoshi et al. 2001; Binshtoket al. 2008), which is known to reduce trafficking of KCa channel subunits to the membrane in chick ciliary ganglion neurons (Chae & Dryer, 2005). Furthermore, the MAPK pathway can regulate the inactivation of HVA ICa through actions on auxiliary calcium channel subunits (Fitzgerald, 2002). This may account for the shift in inactivation shown in Fig.5D.
IL-1β exposure can also activate protein kinase C (PKC) (Obreja et al. 2002; Liu et al. 2006) or, through the secondary production of prostaglandin E2, activate the cAMP/PKA signalling pathway (Maier et al.1990; Gray et al. 2004). Such activation can suppress A-currents (Hagiwara et al. 2003) and IK,Ca (Gold et al. 1996b; Shipston et al. 1999; Widmer et al. 2003). cAMP also directly binds to a domain in the C-terminal of the HCN channel (DiFrancesco & Tortora, 1991) which accelerates the opening of HCN2 channels (Wainger et al. 2001). All of these possibilities are congruent with our observations on K+ currents (Fig.4) and IH (Fig.6).
Relationship between current-clamp and voltage-clamp results
The changes in ionic currents in medium-diameter DRG neurons relate to the alterations in AP waveform and the increased cell excitability. The hyperpolarizing shift in voltage dependence of activation of TTX-S INa (Fig.3C) may contribute to the observed increase in rate of depolarization during the AP upstroke and decreased rheobase (Stemkowski & Smith, 2012a). It may also contribute to the increased spike height (Fig.2B) as more activation of Na+ conductance may be available prior to the onset of repolarizing K+ currents, which are themselves attenuated (Fig.4). Although this global attenuation of K+ currents in medium neurons is likely to contribute to attenuation of the AP afterhyperpolarization (Fig.2B), the observed increase in rate of activation of IH (Fig.6D–F) may also play a role (Stemkowski & Smith, 2012a). Despite the prediction that all observed changes under voltage-clamp conditions are in a direction that would promote increased excitability, more work is clearly required to establish the relationships between altered channel expression and increased excitability. This may be achieved by computer modelling of the voltage trajectories (AP shape and repetitive discharge characterstics) that would be predicted by the observed changes in various ionic conductances.
Acknowledgments
We thank Miss Briana Napier and Dr Nataliya Bukhanova for help with data analysis.
Glossary
- AP
action potential
- BSA
bovine serum albumin
- CCI
chronic constriction injury
- DRG
dorsal root ganglion
- DMEM
Dulbecco's modified Eagle's medium
- DMEMHS
Dulbecco modified Eagle's medium with heat inactiavted serum
- ERK
extracellular signal regulated kinase
- HBSS
Hepes-buffered saline solution
- HCN
hyperpolarization-activated cyclic nucleotide-gated (channels)
- HIV
human immunodeficiency virus
- HVA-IBa
current carried by Ba2+ through high voltage activated Ca2+ channels
- IBa
current carried by Ba2+ through Ca2+ channels
- ICa
calcium channel current
- IH
current through HCN channels
- IK
K+ channel current
- INa
Na+ channel current
- IL-β
interleukin 1β
- IB4
isolectin B4
- NGF
nerve growth factor
- PBS
phosphate buffered saline
- RMP
resting membrane potential
- TNF-α
tumour necrosis factor alpha
- TTX-R INa
tetrodotoxin-resistant Na+ channel current
- TTX-S INa
tetrodotoxin-sensitive Na+ channel current
- Vcmd
command potential (in voltage clamp experiments)
- Vh
holding potential (in voltage clamp experiments)
Additional information
Competing interests
None.
Author contributions
P.L.S. carried out the majority of the experiments and data analysis, and prepared the first draft of the manuscript. Additional experimental data were acquired and analysed by M-C. N. and Y.C. P.A.S. designed the study, supervised the experiments and edited the final version of the manuscript.
Funding
This work was supported by the Canadian Institutes of Health Research HOP126788. P.L.S. was supported by an Alberta Heritage Foundation for Medical Research (AHFMR) studentship and an AHFMR Dr Lionel E. McLeod Health Research Scholarship. M-C.N. was supported by an Alberta Innovates Health Sciences graduate student award.
References
- Abdulla FA, Smith PA. Ectopic α2-adrenoceptors couple to N-type Ca2+ channels in axotomized rat sensory neurons. J Neurosci. 1997a;17:1633–1641. doi: 10.1523/JNEUROSCI.17-05-01633.1997. [DOI] [PMC free article] [PubMed] [Google Scholar]
- Abdulla FA, Smith PA. Nociceptin inhibits T-type Ca2+ channel current in rat sensory neurons by a G-protein-independent mechanism. J Neurosci. 1997b;17:8721–8728. doi: 10.1523/JNEUROSCI.17-22-08721.1997. [DOI] [PMC free article] [PubMed] [Google Scholar]
- Abdulla FA, Smith PA. Axotomy and autotomy-induced changes in the excitability of rat dorsal root ganglion neurons. J Neurophysiol. 2001a;85:630–643. doi: 10.1152/jn.2001.85.2.630. [DOI] [PubMed] [Google Scholar]
- Abdulla FA, Smith PA. Axotomy- and autotomy-induced changes in Ca2+and K+ channel currents of rat dorsal root ganglion neurons. J Neurophysiol. 2001b;85:644–658. doi: 10.1152/jn.2001.85.2.644. [DOI] [PubMed] [Google Scholar]
- Abdulla FA, Smith PA. Changes in Na+ channel currents of rat dorsal root ganglion neurons following axotomy and axotomy-induced autotomy. J Neurophysiol. 2002;88:2518–2529. doi: 10.1152/jn.00913.2001. [DOI] [PubMed] [Google Scholar]
- Baccei ML, Kocsis JD. Voltage-gated calcium currents in axotomized adult rat cutaneous afferent neurons. J Neurophysiol. 2000;83:2227–2238. doi: 10.1152/jn.2000.83.4.2227. [DOI] [PubMed] [Google Scholar]
- Baron R, Binder A, Wasner G. Neuropathic pain: diagnosis, pathophysiological mechanisms, and treatment. Lancet Neurol. 2010;9:807–819. doi: 10.1016/S1474-4422(10)70143-5. [DOI] [PubMed] [Google Scholar]
- Binshtok AM, Wang H, Zimmermann K, Amaya F, Vardeh D, Shi L, Brenner GJ, Ji RR, Bean BP, Woolf CJ, Samad TA. Nociceptors are interleukin-1β sensors. J Neurosci. 2008;28:14062–14073. doi: 10.1523/JNEUROSCI.3795-08.2008. [DOI] [PMC free article] [PubMed] [Google Scholar]
- Chalazonitis A, Peterson ER, Crain SM. Nerve growth factor regulates the action potential duration of mature sensory neurons. Proc Natl Acad Sci USA. 1987;84:289–293. doi: 10.1073/pnas.84.1.289. [DOI] [PMC free article] [PubMed] [Google Scholar]
- Chae KS, Dryer SE. The p38 mitogen-activated protein kinase pathway negatively regulates Ca2+-activated K+ channel trafficking in developing parasympathetic neurons. J Neurochem. 2005;94:367–379. doi: 10.1111/j.1471-4159.2005.03201.x. [DOI] [PubMed] [Google Scholar]
- Chaplan SR, Guo HQ, Lee DH, Luo L, Liu C, Kuei C, Velumian AA, Butler MP, Brown SM, Dubin AE. Neuronal Hyperpolarization-Activated Pacemaker Channels Drive Neuropathic Pain. Journal of Neuroscience. 2003;23:1169–1178. doi: 10.1523/JNEUROSCI.23-04-01169.2003. [DOI] [PMC free article] [PubMed] [Google Scholar]
- Chen X, Pang RP, Shen KF, Zimmermann M, Xin WJ, Li YY, Liu XG. TNF-α enhances the currents of voltage gated sodium channels in uninjured dorsal root ganglion neurons following motor nerve injury. Exp Neurol. 2011;227:279–286. doi: 10.1016/j.expneurol.2010.11.017. [DOI] [PubMed] [Google Scholar]
- Copray JC, Mantingh I, Brouwer N, Biber K, Kust BM, Liem RS, Huitinga I, Tilders FJ, Van Dam AM, Boddeke HW. Expression of interleukin-1 beta in rat dorsal root ganglia. J Neuroimmunol. 2001;118:203–211. doi: 10.1016/s0165-5728(01)00324-1. [DOI] [PubMed] [Google Scholar]
- Costigan M, Scholz J, Woolf CJ. Neuropathic pain: a maladaptive response of the nervous system to damage. Annu Rev Neurosci. 2009;32:1–32. doi: 10.1146/annurev.neuro.051508.135531. [DOI] [PMC free article] [PubMed] [Google Scholar]
- Czeschik JC, Hagenacker T, Schafers M, Busselberg D. TNF-α differentially modulates ion channels of nociceptive neurons. Neurosci Lett. 2008;434:293–298. doi: 10.1016/j.neulet.2008.01.070. [DOI] [PubMed] [Google Scholar]
- Dableh LJ, Yashpal K, Henry JL. Neuropathic pain as a process: reversal of chronification in an animal model. J Pain Res. 2011;4:315–323. doi: 10.2147/JPR.S17882. [DOI] [PMC free article] [PubMed] [Google Scholar]
- Devor M, Vaso A, Adahan HM, Vyshka G. PNS origin of phantom limb sensation and pain: Reply to Letter to the Editor regarding Foell et al., Peripheral origin of phantom limb pain: Is it all resolved? Pain. 2014;155:2207–2208. doi: 10.1016/j.pain.2014.08.018. [DOI] [PubMed] [Google Scholar]
- Dib-Hajj SD, Black JA, Cummins TR, Kenney AM, Kocsis JD, Waxman SG. Rescue of α-SNS sodium channel expression in small dorsal root ganglion neurons after axotomy by nerve growth factor in vivo. J Neurophysiol. 1998;79:2668–2676. doi: 10.1152/jn.1998.79.5.2668. [DOI] [PubMed] [Google Scholar]
- DiFrancesco D, Tortora P. Direct activation of cardiac pacemaker channels by intracellular cyclic AMP. Nature. 1991;351:145–147. doi: 10.1038/351145a0. [DOI] [PubMed] [Google Scholar]
- Dobierzewska A, Shi L, Karakashian AA, Nikolova-Karakashian MN. Interleukin 1beta regulation of FoxO1 protein content and localization: evidence for a novel ceramide-dependent mechanism. J Biol Chem. 2012;287:44749–44760. doi: 10.1074/jbc.M112.378836. [DOI] [PMC free article] [PubMed] [Google Scholar]
- Emery EC, Young GT, Berrocoso EM, Chen L, McNaughton PA. HCN2 ion channels play a central role in inflammatory and neuropathic pain. Science. 2011;333:1462–1466. doi: 10.1126/science.1206243. [DOI] [PubMed] [Google Scholar]
- Everill B, Kocsis JD. Reduction of potassium currents in identified cutaneous afferent dorsal root ganglion neurons after axotomy. J Neurophysiol. 1999;82:700–708. doi: 10.1152/jn.1999.82.2.700. [DOI] [PubMed] [Google Scholar]
- Everill B, Kocsis JD. Nerve growth factor maintains potassium conductance after nerve injury in adult cutaneous afferent dorsal root ganglion neurons. Neuroscience. 2000;100:417–422. doi: 10.1016/s0306-4522(00)00263-3. [DOI] [PMC free article] [PubMed] [Google Scholar]
- Fitzgerald EM. The presence of Ca2+ channel beta subunit is required for mitogen-activated protein kinase (MAPK)-dependent modulation of alpha1B Ca2+ channels in COS-7 cells. J Physiol. 2002;543:425–437. doi: 10.1113/jphysiol.2002.022822. [DOI] [PMC free article] [PubMed] [Google Scholar]
- Funakoshi M, Sonoda Y, Tago K, Tominaga S, Kasahara T. Differential involvement of p38 mitogen-activated protein kinase and phosphatidyl inositol 3-kinase in the IL-1-mediated NF-kappa B and AP-1 activation. Int Immunopharmacol. 2001;1:595–604. doi: 10.1016/s1567-5769(00)00035-7. [DOI] [PubMed] [Google Scholar]
- Gabay E, Wolf G, Shavit Y, Yirmiya R, Tal M. Chronic blockade of interleukin-1 (IL-1) prevents and attenuates neuropathic pain behavior and spontaneous ectopic neuronal activity following nerve injury. Eur J Pain. 2011;15:242–248. doi: 10.1016/j.ejpain.2010.07.012. [DOI] [PubMed] [Google Scholar]
- Gilron I, Watson CP, Cahill CM, Moulin DE. Neuropathic pain: a practical guide for the clinician. CMAJ. 2006;175:265–275. doi: 10.1503/cmaj.060146. [DOI] [PMC free article] [PubMed] [Google Scholar]
- Gold MS, Shuster MJ, Levine JD. Characterization of six voltage-gated K+ currents in adult rat sensory neurons. J Neurophysiol. 1996;75:2629–2646. doi: 10.1152/jn.1996.75.6.2629. [DOI] [PubMed] [Google Scholar]
- Govrin-Lippmann R, Devor M. Ongoing activity in severed nerves: source and variation with time. Brain Res. 1978;159:406–410. doi: 10.1016/0006-8993(78)90548-6. [DOI] [PubMed] [Google Scholar]
- Gray T, Nettesheim P, Loftin C, Koo JS, Bonner J, Peddada S, Langenbach R. Interleukin-1beta-induced mucin production in human airway epithelium is mediated by cyclooxygenase-2, prostaglandin E2 receptors, and cyclic AMP-protein kinase A signaling. Mol Pharmacol. 2004;66:337–346. doi: 10.1124/mol.66.2.337. [DOI] [PubMed] [Google Scholar]
- Hagiwara K, Nunoki K, Ishii K, Abe T, Yanagisawa T. Differential inhibition of transient outward currents of Kv1.4 and Kv4.3 by endothelin. Biochem Biophys Res Commun. 2003;310:634–640. doi: 10.1016/j.bbrc.2003.09.062. [DOI] [PubMed] [Google Scholar]
- Harper AA, Lawson SN. Conduction velocity is related to morphological cell type in rat dorsal root ganglion neurones. J Physiol. 1985;359:31–46. doi: 10.1113/jphysiol.1985.sp015573. [DOI] [PMC free article] [PubMed] [Google Scholar]
- Kajander JC, Bennett GJ. Onset of a painful peripheral neuropathy in rat: a partial and differential deafferentation and spontaneous discharge in Aβ and Aδ primary afferent neurons. J Neurophysiol. 1992;68:734–744. doi: 10.1152/jn.1992.68.3.734. [DOI] [PubMed] [Google Scholar]
- Kaplan DR, Stephens RM. Neurotrophin signal transduction by the Trk receptor. J Neurobiol. 1994;25:1404–1407. doi: 10.1002/neu.480251108. [DOI] [PubMed] [Google Scholar]
- Kim DS, Choi JO, Rim HD, Cho HJ. Downregulation of voltage-gated potassium channel α gene expression in dorsal root ganglia following chronic constriction injury of the rat sciatic nerve. Brain Res Mol Brain Res. 2002;105:146–152. doi: 10.1016/s0169-328x(02)00388-1. [DOI] [PubMed] [Google Scholar]
- Kouranova EV, Strassle BW, Ring RH, Bowlby MR, Vasilyev DV. Hyperpolarization-activated cyclic nucleotide-gated channel mRNA and protein expression in large versus small diameter dorsal root ganglion neurons: correlation with hyperpolarization-activated current gating. Neuroscience. 2008;153:1008–1019. doi: 10.1016/j.neuroscience.2008.03.032. [DOI] [PubMed] [Google Scholar]
- Kim KJ, Yoon YW, Chung JM. Comparison of three rodent models of neuropathic pain. Exp Brain Res. 1997;113:200–206. doi: 10.1007/BF02450318. [DOI] [PubMed] [Google Scholar]
- Kroner A, Greenhalgh AD, Zarruk JG, Passos Dos Santos R, Gaestel M, David S. TNF and increased intracellular iron alter macrophage polarization to a detrimental M1 phenotype in the injured spinal cord. Neuron. 2014;83:1098–1116. doi: 10.1016/j.neuron.2014.07.027. [DOI] [PubMed] [Google Scholar]
- Lawson SN. Phenotype and function of somatic primary afferent nociceptive neurones with C-, Aδ- or Aα/β-fibres. Exp Physiol. 2002;87:239–244. doi: 10.1113/eph8702350. [DOI] [PubMed] [Google Scholar]
- Leung L, Cahill CM. TNF-α and neuropathic pain–a review. J Neuroinflammation. 2010;7:27. doi: 10.1186/1742-2094-7-27. [DOI] [PMC free article] [PubMed] [Google Scholar]
- Li J, Baccei ML. Pacemaker neurons within newborn spinal pain circuits. J Neurosci. 2011;31:9010–9022. doi: 10.1523/JNEUROSCI.6555-10.2011. [DOI] [PMC free article] [PubMed] [Google Scholar]
- Lindsay RM. Nerve growth factors (NGF, BDNF) enhance axonal regeneration but are not required for survival of adult sensory neurons. J Neurosci. 1988;8:2394–2405. doi: 10.1523/JNEUROSCI.08-07-02394.1988. [DOI] [PMC free article] [PubMed] [Google Scholar]
- Liu L, Yang TM, Liedtke W, Simon SA. Chronic IL-1beta Signaling Potentiates Voltage-Dependent Sodium Currents in Trigeminal Nociceptive Neurons. J Neurophysiol. 2006;95:1478–1490. doi: 10.1152/jn.00509.2005. [DOI] [PubMed] [Google Scholar]
- Lu KT, Wang YW, Wo YY, Yang YL. Extracellular signal-regulated kinase-mediated IL-1-induced cortical neuron damage during traumatic brain injury. Neurosci Lett. 2005;386:40–45. doi: 10.1016/j.neulet.2005.05.057. [DOI] [PubMed] [Google Scholar]
- Ma C, Shu Y, Zheng Z, Chen Y, Yao H, Greenquist KW, White FA, LaMotte RH. Similar electrophysiological changes in axotomized and neighboring intact dorsal root ganglion neurons. J Neurophysiol. 2003;89:1588–1602. doi: 10.1152/jn.00855.2002. [DOI] [PubMed] [Google Scholar]
- MacGillivray MK, Cruz TF, McCulloch CA. The recruitment of the interleukin-1 (IL-1) receptor-associated kinase (IRAK) into focal adhesion complexes is required for IL-1beta -induced ERK activation. J Biol Chem. 2000;275:23509–23515. doi: 10.1074/jbc.M003186200. [DOI] [PubMed] [Google Scholar]
- Maier JA, Hla T, Maciag T. Cyclooxygenase is an immediate-early gene induced by interleukin-1 in human endothelial cells. J Biol Chem. 1990;265:10805–10808. [PubMed] [Google Scholar]
- Mika J, Korostynski M, Kaminska D, Wawrzczak-Bargiela A, Osikowicz M, Makuch W, Przewlocki R, Przewlocka B. Interleukin-1 alpha has antiallodynic and antihyperalgesic activities in a rat neuropathic pain model. Pain. 2008;138:587–597. doi: 10.1016/j.pain.2008.02.015. [DOI] [PubMed] [Google Scholar]
- Mayer ML, Westbrook GL. A voltage-clamp analysis of inward (anomalous) rectification in mouse spinal sensory ganglion neurones. J Physiol. 1983;340:19–45. doi: 10.1113/jphysiol.1983.sp014747. [DOI] [PMC free article] [PubMed] [Google Scholar]
- Mosconi T, Kruger L. Fixed-diameter polyethylene cuffs applied to the rat sciatic nerve induce a painful neuropathy: ultrastructural morphometric analysis of axonal alterations. Pain. 1996;64:37–57. doi: 10.1016/0304-3959(95)00077-1. [DOI] [PubMed] [Google Scholar]
- Nadeau S, Filali M, Zhang J, Kerr BJ, Rivest S, Soulet D, Iwakura Y, de Rivero Vaccari JP, Keane RW, Lacroix S. Functional recovery after peripheral nerve injury is dependent on the pro-inflammatory cytokines IL-1β and TNF: implications for neuropathic pain. J Neurosci. 2011;31:12533–12542. doi: 10.1523/JNEUROSCI.2840-11.2011. [DOI] [PMC free article] [PubMed] [Google Scholar]
- Obreja O, Rathee PK, Lips KS, Distler C, Kress M. IL-1 beta potentiates heat-activated currents in rat sensory neurons: involvement of IL-1RI, tyrosine kinase, and protein kinase C. FASEB J. 2002;16:1497–1503. doi: 10.1096/fj.02-0101com. [DOI] [PubMed] [Google Scholar]
- Nitzan-Luques A, Devor M, Tal M. Genotype-selective phenotypic switch in primary afferent neurons contributes to neuropathic pain. Pain. 2011;152:2413–2426. doi: 10.1016/j.pain.2011.07.012. [DOI] [PubMed] [Google Scholar]
- Pitcher GM, Henry JL. Governing role of primary afferent drive in increased excitation of spinal nociceptive neurons in a model of sciatic neuropathy. Exp Neurol. 2008;214:219–228. doi: 10.1016/j.expneurol.2008.08.003. [DOI] [PMC free article] [PubMed] [Google Scholar]
- Sarantopoulos CD, McCallum JB, Rigaud M, Fuchs A, Kwok WM, Hogan QH. Opposing effects of spinal nerve ligation on calcium-activated potassium currents in axotomized and adjacent mammalian primary afferent neurons. Brain Res. 2007;1132:84–99. doi: 10.1016/j.brainres.2006.11.055. [DOI] [PMC free article] [PubMed] [Google Scholar]
- Scholz J, Woolf CJ. The neuropathic pain triad: neurons, immune cells and glia. Nat Neurosci. 2007;10:1361–1368. doi: 10.1038/nn1992. [DOI] [PubMed] [Google Scholar]
- Scroggs RS, Todorovic SM, Anderson EG, Fox AP. Variation in IH, IIR, and ILEAK between acutely isolated adult rat dorsal root ganglion neurons of different size. J Neurophysiol. 1994;71:271–279. doi: 10.1152/jn.1994.71.1.271. [DOI] [PubMed] [Google Scholar]
- Shipston MJ, Duncan RR, Clark AG, Antoni FA, Tian L. Molecular components of large conductance calcium-activated potassium (BK) channels in mouse pituitary corticotropes. Mol Endocrinol. 1999;13:1728–1737. doi: 10.1210/mend.13.10.0355. [DOI] [PubMed] [Google Scholar]
- Sommer C, Kress M. Recent findings on how proinflammatory cytokines cause pain: peripheral mechanisms in inflammatory and neuropathic hyperalgesia. Neurosci Lett. 2004;361:184–187. doi: 10.1016/j.neulet.2003.12.007. [DOI] [PubMed] [Google Scholar]
- Stamboulian S, Choi JS, Ahn HS, Chang YW, Tyrrell L, Black JA, Waxman SG, Dib-Hajj SD. ERK1/2 mitogen-activated protein kinase phosphorylates sodium channel Na(v)1.7 and alters its gating properties. J Neurosci. 2010;30:1637–1647. doi: 10.1523/JNEUROSCI.4872-09.2010. [DOI] [PMC free article] [PubMed] [Google Scholar]
- Stemkowski PL, Smith PA. 2010. Long-term interleukin-1β exposure increases small IB4-positive and medium sensory neuron excitability by differential actions on ionic conductances. Program No. 175.2. 2010 Neuroscience Meeting Planner. Society for Neuroscience, Washington, DC.
- Stemkowski PL, Jones KE, Smith PA. Long-term interleukin-1β exposure increases small IB4-positive and medium sensory neuron excitability by differential actions on ionic conductances. Program and Abstracts from the Fifth Annual Canadian Neuroscience Meeting. 2011:102–103. [Google Scholar]
- Stemkowski PL, Smith PA. Long-term IL-1beta exposure causes subpopulation-dependent alterations in rat dorsal root ganglion neuron excitability. J Neurophysiol. 2012a;107:1586–1597. doi: 10.1152/jn.00587.2011. [DOI] [PubMed] [Google Scholar]
- Stemkowski PL, Smith PA. Sensory neurons, ion channels, inflammation and the onset of neuropathic pain. Can J Neurol Sci. 2012b;39:416–435. doi: 10.1017/s0317167100013937. [DOI] [PubMed] [Google Scholar]
- Sukhotinsky I, Ben Dor E, Raber P, Devor M. Key role of the dorsal root ganglion in neuropathic tactile hypersensibility. Eur J Pain. 2004;8:135–143. doi: 10.1016/S1090-3801(03)00086-7. [DOI] [PubMed] [Google Scholar]
- Tan ZY, Donnelly DF, LaMotte RH. Effects of a chronic compression of the dorsal root ganglion on voltage-gated Na+ and K+ currents in cutaneous afferent neurons. J Neurophysiol. 2006;95:1115–1123. doi: 10.1152/jn.00830.2005. [DOI] [PubMed] [Google Scholar]
- Treede R-D, Jensen TS, Campbell JN, Cruccu G, Dostrovsky JO, Griffin JW, Hansson P, Hughes R, Nurmikko T, Serra J. Neuropathic pain: Redefinition and a grading system for clinical and research purposes. Neurology. 2008;70:1630–1635. doi: 10.1212/01.wnl.0000282763.29778.59. [DOI] [PubMed] [Google Scholar]
- Vaso A, Adahan HM, Gjika A, Zahaj S, Zhurda T, Vyshka G, Devor M. Peripheral nervous system origin of phantom limb pain. Pain. 2014;155:1384–1391. doi: 10.1016/j.pain.2014.04.018. [DOI] [PubMed] [Google Scholar]
- Wainger BJ, DeGennaro M, Santoro B, Siegelbaum SA, Tibbs GR. Molecular mechanism of cAMP modulation of HCN pacemaker channels. Nature. 2001;411:805–810. doi: 10.1038/35081088. [DOI] [PubMed] [Google Scholar]
- Wall PD, Devor M, Inbal R, Scadding JW, Schonfeld D, Seltzer Z, Tomkiewicz MM. Autotomy following peripheral nerve lesions: experimental anaesthesia dolorosa. Pain. 1979;7:103–113. doi: 10.1016/0304-3959(79)90002-2. [DOI] [PubMed] [Google Scholar]
- Watkins LR, Maier SF. Implications of immune-to-brain communication for sickness and pain. Proc Natl Acad Sci U S A. 1999;96:7710–7713. doi: 10.1073/pnas.96.14.7710. [DOI] [PMC free article] [PubMed] [Google Scholar]
- Watkins LR, Maier SF. Beyond neurons: Evidence that immune and glial cells contribute to pathological pain states. Physiol Rev. 2002;82:981–1011. doi: 10.1152/physrev.00011.2002. [DOI] [PubMed] [Google Scholar]
- Waxman SG, Dib-Hajj S, Cummins TR, Black JA. Sodium channels and pain. Proc Natl Acad Sci U S A. 1999;96:7635–7639. doi: 10.1073/pnas.96.14.7635. [DOI] [PMC free article] [PubMed] [Google Scholar]
- Waxman SG, Zamponi GW. Regulating excitability of peripheral afferents: emerging ion channel targets. Nat Neurosci. 2014;17:153–163. doi: 10.1038/nn.3602. [DOI] [PubMed] [Google Scholar]
- Widmer HA, Rowe IC, Shipston MJ. Conditional protein phosphorylation regulates BK channel activity in rat cerebellar Purkinje neurons. J Physiol. 2003;552:379–391. doi: 10.1113/jphysiol.2003.046441. [DOI] [PMC free article] [PubMed] [Google Scholar]
- Wolf G, Gabay E, Tal M, Yirmiya R, Shavit Y. Genetic impairment of interleukin-1 signaling attenuates neuropathic pain, autotomy, and spontaneous ectopic neuronal activity, following nerve injury in mice. Pain. 2006;120:315–324. doi: 10.1016/j.pain.2005.11.011. [DOI] [PubMed] [Google Scholar]
- Yang KY, Bae WS, Kim MJ, Bae YC, Kim YJ, Kim HJ, Nam SH, Ahn DK. Participation of the central p38 and ERK1/2 pathways in IL-1β-induced sensitization of nociception in rats. Prog Neuropsychopharmacol Biol Psychiatry. 2013;46:98–104. doi: 10.1016/j.pnpbp.2013.07.004. [DOI] [PubMed] [Google Scholar]
- Yao H, Donnelly DF, Ma C, LaMotte RH. Upregulation of the hyperpolarization-activated cation current after chronic compression of the dorsal root ganglion. J Neurosci. 2003;23:2069–2074. doi: 10.1523/JNEUROSCI.23-06-02069.2003. [DOI] [PMC free article] [PubMed] [Google Scholar]