

Abstract
The brainbow recombination fluorescent protein system has been used for a multitude of applications in fate and lineage tracking. Here, we use a mouse with an ubiquitously expressed brainbow construct, termed the Confetti mouse, to perform T lymphocyte cell lineage tracking. We demonstrate that antigen-specific T lymphocyte clonotypes can be identified and phenotyped using flow cytometry instead of performing expensive and time-consuming methods of single cell sequencing.
Keywords: T cell receptor, clonotype, lineage tracking
1. Introduction
Clonal selection theory states every T and B cell has a single, unique receptor on its surface that transmits activation signals upon recognition of cognate antigen. For most T cells, these unique receptors are composed of an α and β chain heterodimer created by the rearrangement of V(D)J gene segments during thymic T cell development. The characteristics of αβ TCR interactions with peptide presented by major histocompatibility class I or II (pMHC) has been shown to guide T cell function and differentiation(Kim et al., 2013; Tubo et al., 2013; Turner et al., 2003; van Panhuys et al., 2014). These works indicate TCR:pMHC interactions promote default T cell differentiation pathways, but others have shown these preferential helper lineages can be redirected if given exogenous factors(Zhu et al., 2010). How physical interactions of the αβ TCR promote T cell development and differential functions in diverse polyclonal responses is important to study in order to understand clonotypic population dynamics. To dissect the complex polyclonal T cell response we therefore need an easy method to identify distinct αβ TCR clonotypes to understand how they affect T cell function and differentiation.
To address the problem of correlating T cell phenotype with αβ TCR clonotypes, groups have developed polyclonal, αβ paired single-cell TCR sequencing methods(Dash et al., 2011; La Gruta et al., 2010; Thomas et al., 2013). This method can correlate αβ TCR sequences to phenotype, but throughput is low and requires extended time for data analysis. Genetic barcoding is an alternative means of tracking individual T cell clonotype, but these techniques are technically challenging and time consuming(Buchholz et al., 2013; Schepers et al., 2008). To increase throughput, groups have turned to next-generation sequencing, however, it is currently difficult to correlate antigen-specific αβ TCRs clonotypes with T cell phenotype. Thus, new techniques need to be developed to identify clonotype and phenotype that are high throughput, cost effective and easy to use. In this report we investigate and validate the Confetti mouse as a viable tool to simultaneously track T cell clonotypes and phenotypes using flow cytometry.
2. Materials and methods
2.1. Mice
Rosa26-Confetti and Rosa26-CreER were purchased from the Jackson Laboratories and bred at Emory University. All animals were housed in an Emory University Department of Animal Resources facility (Atlanta, GA) and used in accordance with an Institutional Animal Care and Use Committee–approved protocol.
2.2. Animal procedures
To induce Cre-mediated recombination and XFP expression, tamoxifen (Sigma Aldrich) was dissolved in corn oil (Simga Aldrich) at a concentration of 20 mg/ml and 100 μl (2mg) was injected into mice IP on days 0 and 2. Mice were immunized or infected between days 7 and 14 after final tamoxifen injections. MOG35–55 (MEVGWYRSPFSRVVHLYRNGK) peptide was synthesized on a Prelude peptide synthesizer (Protein Technologies, Inc.). For peptide immunization, 200μg of MOG35-55 was emulsified in 150μl of complete Freund’s adjuvant (CFA, at a concentration of 2.5 mg/ml of M. tuberculosis) and injected subcutaneously into the flank on day 0. Acute LCMV Armstrong (2x10⁵) infections were administered IP on day 0.
2.3. Tetramer Enrichment
APC labeled MOG38–49:I-Ab and GP66-77:I-Ab tetramers were provided by the National Institute of Allergy and Infectious Diseases Tetramer Core Facility at Emory University. Tetramer enrichment and staining was preformed as previously described(Moon et al., 2009). Briefly, mouse peripheral lymphoid organs (spleen and inguinal, para-aortic, brachial, axillary, cervical, mesenteric lymph nodes) were processed into a single cell suspension. These cells were stained with the respective tetramer (4μg/ml) for 60 min at room temperature, washed, stained with anti-APC magnetic microbeads (Miltenyi Biotec), and enriched on a magnetized LS column (Miltenyi Biotec). Tetramer enriched samples were stained for analysis by flow cytometry using CD4 (RM4-5, Biolegend), CD8α (53-6.7, Tonbo Biosciences), CD44 (IM7, eBiosciences), B220 (RA3-6B2, eBiosciences) CD11c (N418, eBiosciences) and F4/80 (BM8, eBiosciences). Samples were collected on a LSR II cytometer (Benton Dickinson) and analyzed using FlowJo software (Treestar). For excitation of GFP+, YFP+ and RFP+ cells, 488nm, 405nm and 561nm lasers were used, respectively. Emissions from the three fluorescent proteins required the use of the following bandpass filters: a 530/30 filter to detect GFP, 525/50 filter to detect YFP and a 582/15 filter to detect RFP.
2.4. Single cell TCR sequencing
Single cell sequencing was performed as previously described(Dash et al., 2011). In brief, naïve MOG-specific CD4 T cells were isolated by fluorophore-tetramer enrichment and index-sorted by a FACS Aria II (Benton Dickinson) into cDNA master mix. Nested TCRα/β PCR was performed and samples were sent to Beckman Coulter Genomics for sequencing. Sequences were tabulated and parsed by in-house designed software and analyzed using the IMGT database(Lefranc, 2008, 2004; Lefranc et al., 2004).
3. Results and discussion
We first bred the commercially available Confetti (Brainbow 2.1 construct) mice to Rosa26-CreER mice. The Confetti construct allows for each cell to have the potential to express 1 of 4 fluorescent proteins (XFPs), without the possibility of multiple XFPs in the same cell (Fig. 1a)(Cai et al., 2013; Livet et al., 2007; Schepers et al., 2012). To induce Cre-mediated LoxP recombination, we initially gave a reduced dose of tamoxifen to cause inefficient recombination of the fluorescent proteins and only label a small frequency of CD4 T cells. This reduced frequency of XFP labeled cells was necessary as the 4 unique XFPs is much lower than the preimmune repertoire for a single antigen-specific CD4 T cell population (ranging from 5–150 cells)(Jenkins and Moon, 2012). For instance, if we induced LoxP recombination of 100% of CD4 T cells, a given antigen-specific population of 100 cells would have 25 unique clonotypes labeled by each XFP (100 cells/4 XFP possibilities=25 unique clonotypes/XFP). As the labeling of different αβ clonotypes with the same XFP would confound clonotype tracking data, we chose to reduce the dose of tamoxifen to limit Cre recombination and label on average a single cell per XFP for a given antigen specificity (4 XFPs/100 cells= 4% labeling) (Fig 1b).
Figure 1.
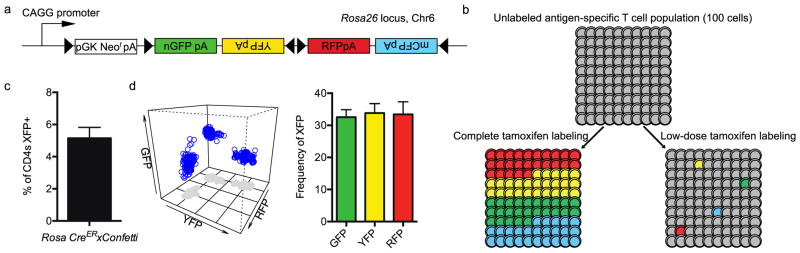
Tamoxifen injection into R26-Confetti x R26-CreER mice causes random fluorescent protein expression. (a) Confetti gene construct. (b) Diagram for the rationale of low-dose tamoxifen labeling of a given antigen-specific CD4 T cell population. (c) Percentage of CD4 T cells expressing a XFP (n=6 mice). (d) The frequency of each fluorescent protein expressed in blood resident CD4 T cells (n=6 mice).
After low-dose tamoxifen injection in Rosa26-CreERxConfetti mice, flow cytometry was performed to identify CD4 T cells with excised LoxP segments via the expression of XFP. From the blood of Rosa26-CreERxConfetti mice injected with tamoxifen, we identified 3 distinct fluorescent colors: RFP, YFP and GFP, which on average made up 5% of the total CD4 T cell population (Fig. 1c). Due to low protein expression levels, we were unable to identify CFP positive cells without the use of a secondary reagent. To demonstrate unique XFP expression, Boolean gating was performed on all XFP positive cells and graphed using a 3D flow cytometry plot (Fig. 1d). As shown, each XFP could be identified as a unique population. When analyzing the XFP CD4 T cells in the blood of multiple naïve mice, no single color was dominant and there were no significant differences in the frequencies of XFP recombination (Fig. 1d). This indicates recombination of floxed segments and expression of XFP is random and will be equally distributed to CD4 T cell clonotypes, with each mouse having a unique set of labeled antigen-specific CD4 T cells.
To validate the confetti clonotype tracking system, low-dose tamoxifen treated Rosa26-CreERxConfetti mice were immunized subcutaneously with myelin oligodendrocyte glycoprotein 35-55 peptide (MOG35-55)/CFA emulsion. MOG is a myelin antigen used to induce autoimmune demyelinating disease in mice. After tetramer-fluorophore magnetic bead enrichment (Fig. 2a), XFP+ MOG38-49:I-Ab(MOG)-specific CD4 T cells were single-cell index sorted and paired αβ TCR single cell sequencing was performed(Dash et al., 2011). Index sorting allows for the measurement of the fluorescent properties of each individual sorted cell. Upon analysis of index sorting data, we found variable expression levels of the XFPs by the MOG-specific CD4 T cells, as demonstrated by the range of fluorescent intensities of GFP+ MOG-specific CD4 T cells from the representative flow cytometry plots (Fig 2a,b). When the CD4 T cells from MOG immunized animals were analyzed, a potential of 6 distinct clones could be identified (Fig 2b). As MOG-specific cells do not expand as much as a foreign antigen-specific T cell response, we set out to confirm the findings of 6 distinct clones in low-dose tamoxifen treated Rosa26-CreERxConfetti mice infected with lymphocytic choriomeningitis virus (LCMV)-Armstrong. We tracked CD4 T cells specific for GP66-77:I-Ab, an immunodominant epitope, at peak clonal expansion and found 8 distinct XFP clones at the peak of clonal expansion based upon XFP intensity in the CD4 T cells when gated on CD44+/− and GP66-77:I-Ab tetramer (Fig 3). This data demonstrates the Rosa26-CreERxConfetti mouse doubled the initial estimate of potential clones that could be tracked in the immune response by flow cytometry, making this system more robust than initially suggested.
Figure 2.

XFP antigen-specific CD4 T cells are enriched for the same αβ TCR clonotype. (a) Representative gating of MOG-specific CD4 T cells after fluorophore-tetramer enrichment from FACS index sorting. (b) Representative plots of MOG-specific CD4 T cells expressing XFP molecules. (c) Geometric mean fluorescent intensity (GMFI) of GFP+ index sorted cells with associated TCRβ CDR3 sequences showing GMFI separates T cell clonotypes. (●) =Similar clonotype, (⭘)= Unique clonotype. (d,e) Simpson’s Index analysis of sequenced TCR α and β chains shows decreased diversity in XFP+ MOG or GP66-specific CD4 T cells.
Figure 3.

Identification of 8 distinct clonotype colors in LCMV-Armstong infected R26-Confetti x R26-CreER XFP+ CD4 T cells. Flow cytometry gating of a representative d8 LCMV infected splenocytes subsets to identify T cell clonotypes with variable GMFI staining.
To determine if a population of antigen-specific, XFP+ T cells share the same TCR clonotype, we turned to single cell sequencing to validate the Confetti system. We first compared bulk CD4 T cell sequences from a naive mouse (n=97 sequences), CD44+ CD4 T cells from a naïve mouse (n=53 sequences), XFP- MOG-specific CD4 T cells (n=133 sequences) and fluorescent intensity separated XFP+ MOG-specific CD4 T cells (α chain, n=68, β chain, n=82 sequences). When the sequences were divided based on high, medium and low geometric mean fluorescent intensity (GMFI), we found individual clones had unique expression of XFPs (Fig. 2c), again validating that up to 8 distinct clones could be tracked using this system. When we analyzed all XFP+ T cell sequences, we found XFP+ MOG-specific CD4 T cells were highly enriched for the same clonotypes as measured by Simpson’s index. Simpson’s index represents the probability of picking two cells that share the same TCR chains out of a given population of CD4 T cells (Fig. 2d). We show the use of the Rosa26-CreERxConfetti mouse increases the likelihood of identifying the same clone from less than 2% (MOG-specific XFP-) up to 60–70% (Fig. 2d). This experiment was repeated using the GP66:I-Ab/LCMV Armstrong system, finding similar results (Fig. 2e).
Together, these data demonstrate the Rosa26-CreERxConfetti mouse as a viable method to track antigen-specific αβ TCR clonotypes during an immune response. Compared to single cell sequencing, barcoding or next generation sequencing, this method uses readily available techniques and reagents, at lower cost coupled with easier data analysis. One limitation with the system is the ability to only track 8 αβ TCR clones of a given antigen-specificity, although this may not present a problem for many potential applications on T cell fate mapping and phenotype plasticity. As an alternative, the commercially available Brainbow 1.0 transgenic mouse could be used as it has multiple copies of the Brainbow 1.0 casette driven by the CAG promoter(Tabansky et al., 2013). Due to the multiple copies of Brainbow 1.0 transgene, there can be combinatorial expression of XFPs with a reported 21 distinct XFP combinations or potential clones tracked, allowing for more complex clonotype tracking(Tabansky et al., 2013).
Highlights.
Validation of the Confetti tracking system for use in T cells.
Flow cytometry can be used to identify TCR clonotypes with the confetti system.
Confetti tracking can identify up to 8 distinct T cell clones in an antigen-specific T cell response.
Rapid, concurrent phenotype and clonotype analysis of T cells.
Acknowledgments
This work was supported by NIH grant T32 AI007610, RO1 NS071518 and National Multiple Sclerosis Society grant RG4047. Aaron Rae at Emory+Children’s Pediatric Research Immunology Core carried out FACS. Benjamin Barwick created programs for sequence analysis. Laurel Lawrence maintained the mouse colony. The authors would like to thank Lori Blanchfield, Rakieb Andargarchew, Jennifer Cosby and Emily Cartwright for helpful discussion.
Footnotes
The authors have no conflicts of interest to disclose.
Publisher's Disclaimer: This is a PDF file of an unedited manuscript that has been accepted for publication. As a service to our customers we are providing this early version of the manuscript. The manuscript will undergo copyediting, typesetting, and review of the resulting proof before it is published in its final citable form. Please note that during the production process errors may be discovered which could affect the content, and all legal disclaimers that apply to the journal pertain.
References
- Buchholz VR, Flossdorf M, Hensel I, Kretschmer L, Weissbrich B, Gräf P, Verschoor A, Schiemann M, Höfer T, Busch DH. Disparate individual fates compose robust CD8+ T cell immunity. Science. 2013;340:630–5. doi: 10.1126/science.1235454. [DOI] [PubMed] [Google Scholar]
- Cai D, Cohen KB, Luo T, Lichtman JW, Sanes JR. Improved tools for the Brainbow toolbox. Nat Methods. 2013;10:540–7. doi: 10.1038/nmeth.2450. [DOI] [PubMed] [Google Scholar]
- Dash P, McClaren JL, Oguin TH, Rothwell W, Todd B, Morris MY, Becksfort J, Reynolds C, Brown SA, Doherty PC, Thomas PG. Paired analysis of TCRα and TCRβ chains at the single-cell level in mice. J Clin Invest. 2011;121:288–95. doi: 10.1172/JCI44752. [DOI] [PMC free article] [PubMed] [Google Scholar]
- Jenkins MK, Moon JJ. The Role of Naive T Cell Precursor Frequency and Recruitment in Dictating Immune Response Magnitude. J Immunol. 2012;188:4135–4140. doi: 10.4049/jimmunol.1102661. [DOI] [PMC free article] [PubMed] [Google Scholar]
- Kim C, Wilson T, Fischer KF, Williams MA. Sustained interactions between T cell receptors and antigens promote the differentiation of CD4+ memory T cells. Immunity. 2013;39:508–20. doi: 10.1016/j.immuni.2013.08.033. [DOI] [PMC free article] [PubMed] [Google Scholar]
- La Gruta NL, Rothwell WT, Cukalac T, Swan NG, Valkenburg SA, Kedzierska K, Thomas PG, Doherty PC, Turner SJ. Primary CTL response magnitude in mice is determined by the extent of naive T cell recruitment and subsequent clonal expansion. J Clin Invest. 2010;120:1885–94. doi: 10.1172/JCI41538. [DOI] [PMC free article] [PubMed] [Google Scholar]
- Lefranc MP. IMGT-ONTOLOGY and IMGT databases, tools and Web resources for immunogenetics and immunoinformatics. Mol Immunol. 2004;40:647–60. doi: 10.1016/j.molimm.2003.09.006. [DOI] [PubMed] [Google Scholar]
- Lefranc MP. IMGT, the International ImMunoGeneTics Information System for Immunoinformatics : methods for querying IMGT databases, tools, and web resources in the context of immunoinformatics. Mol Biotechnol. 2008;40:101–11. doi: 10.1007/s12033-008-9062-7. [DOI] [PubMed] [Google Scholar]
- Lefranc MP, Giudicelli V, Ginestoux C, Bosc N, Folch G, Guiraudou D, Jabado-Michaloud J, Magris S, Scaviner D, Thouvenin V, Combres K, Girod D, Jeanjean S, Protat C, Yousfi-Monod M, Duprat E, Kaas Q, Pommié C, Chaume D, Lefranc G. IMGT-ONTOLOGY for immunogenetics and immunoinformatics. In Silico Biol. 2004;4:17–29. [PubMed] [Google Scholar]
- Livet J, Weissman TA, Kang H, Draft RW, Lu J, Bennis RA, Sanes JR, Lichtman JW. Transgenic strategies for combinatorial expression of fluorescent proteins in the nervous system. Nature. 2007;450:56–62. doi: 10.1038/nature06293. [DOI] [PubMed] [Google Scholar]
- Moon JJ, Chu HH, Hataye J, Pagán AJ, Pepper M, McLachlan JB, Zell T, Jenkins MK. Tracking epitope-specific T cells. Nat Protoc. 2009;4:565–81. doi: 10.1038/nprot.2009.9. [DOI] [PMC free article] [PubMed] [Google Scholar]
- Schepers AG, Snippert HJ, Stange DE, van den Born M, van Es JH, van de Wetering M, Clevers H. Lineage tracing reveals Lgr5+ stem cell activity in mouse intestinal adenomas. Science. 2012;337:730–5. doi: 10.1126/science.1224676. [DOI] [PubMed] [Google Scholar]
- Schepers K, Swart E, van Heijst JWJ, Gerlach C, Castrucci M, Sie D, Heimerikx M, Velds A, Kerkhoven RM, Arens R, Schumacher TNM. Dissecting T cell lineage relationships by cellular barcoding. J Exp Med. 2008;205:2309–18. doi: 10.1084/jem.20072462. [DOI] [PMC free article] [PubMed] [Google Scholar]
- Tabansky I, Lenarcic A, Draft RW, Loulier K, Keskin DB, Rosains J, Rivera-Feliciano J, Lichtman JW, Livet J, Stern JNH, Sanes JR, Eggan K. Developmental bias in cleavage-stage mouse blastomeres. Curr Biol. 2013;23:21–31. doi: 10.1016/j.cub.2012.10.054. [DOI] [PMC free article] [PubMed] [Google Scholar]
- Thomas PG, Handel A, Doherty PC, La Gruta NL. Ecological analysis of antigen-specific CTL repertoires defines the relationship between naive and immune T-cell populations. Proc Natl Acad Sci U S A. 2013;110:1839–44. doi: 10.1073/pnas.1222149110. [DOI] [PMC free article] [PubMed] [Google Scholar]
- Tubo NJ, Pagán AJ, Taylor JJ, Nelson RW, Linehan JL, Ertelt JM, Huseby ES, Way SS, Jenkins MK. Single Naive CD4(+) T Cells from a Diverse Repertoire Produce Different Effector Cell Types during Infection. Cell. 2013;153:785–96. doi: 10.1016/j.cell.2013.04.007. [DOI] [PMC free article] [PubMed] [Google Scholar]
- Turner SJ, Diaz G, Cross R, Doherty PC. Analysis of clonotype distribution and persistence for an influenza virus-specific CD8+ T cell response. Immunity. 2003;18:549–59. doi: 10.1016/s1074-7613(03)00087-6. [DOI] [PubMed] [Google Scholar]
- Van Panhuys N, Klauschen F, Germain RN. T-Cell-Receptor-Dependent Signal Intensity Dominantly Controls CD4(+) T Cell Polarization In Vivo. Immunity. 2014:1–12. doi: 10.1016/j.immuni.2014.06.003. [DOI] [PMC free article] [PubMed] [Google Scholar]
- Zhu J, Yamane H, Paul WE. Differentiation of effector CD4 T cell populations. Annu Rev Immunol. 2010;28:445–89. doi: 10.1146/annurev-immunol-030409-101212. [DOI] [PMC free article] [PubMed] [Google Scholar]