

Abstract
Objectives
To estimate how data errors in electronic health records (EHR) can affect the accuracy of common emergency department (ED) operational performance metrics.
Methods
Using a 3-month, 7,348-visit dataset of electronic timestamps from a suburban academic ED as a baseline, Monte Carlo simulation was used to introduce four types of data errors (substitution, missing, random, and systematic bias) at three frequency levels (2%, 4%, and 7%). Three commonly used ED operational metrics (arrival to clinician evaluation, disposition decision to exit for admitted patients, and ED length of stay for admitted patients) were calculated and the proportion of ED visits that achieved each performance goal was determined.
Results
Even small data errors have measurable effects on a clinical organization's ability to accurately determine whether it is meeting its operational performance goals. Systematic substitution errors, increased frequency of errors, and the use of shorter-duration metrics resulted in a lower proportion of ED visits reported as meeting the associated performance objectives. However, the presence of other error types mitigated somewhat the effect of the systematic substitution error. Longer time-duration metrics were found to be less sensitive to data errors than shorter time-duration metrics.
Conclusions
Infrequent and small-magnitude data errors in EHR timestamps can compromise a clinical organization's ability to determine accurately if it is meeting performance goals. By understanding the types and frequencies of data errors in an organization's EHR, organizational leaders can use data-management best practices to better measure true performance and enhance operational decision-making.
Introduction
Health care is increasingly reliant on information technology and data to drive decisions necessary to achieve a high-quality, 21st century health care system.1-3 Fueled by the Health Information Technology for Economic and Clinical Health (HITECH) Act, health care organizations have rapidly increased the pace of electronic health record (EHR) implementations and the amount of digital data available.4,5 This surge in electronic data can facilitate the comparison of health care organization performance through sources such as Centers for Medicare and Medicaid Services' Hospital Compare website (http://www.medicare.gov/hospitalcompare/).6 Electronic data can also enable health care organizations to identify areas of strength and weakness within their own operational environments.
While the switch from paper to electronic data can be beneficial, there can be unintended negative consequences even among the highest-functioning health care systems.7-9 One particular area of concern is the quality of timestamp data collected and reported by these electronic systems. Timestamp data record the date and time that a particular activity occurs in the ED (e.g., arrival of the patient). For example, the Georgia Hospital Association mistakenly introduced zeros into the arrival times of Georgia emergency department (ED) data, creating the misperception that Georgia EDs had substantially prolonged length-of-stay compared with other states.10 While these errors were eventually corrected, they underscore the lack of emphasis on health care data quality. In another study demonstrating how data quality can affect clinical decision-making, pediatric ED patients with bronchiolitis had their displayed oxygen saturation levels artificially increased by 3%, an amount predetermined to be clinically insignificant.11 However, this intentional data manipulation resulted in fewer patients admitted to the hospital. While these patients had similar clinical outcomes, this seemingly insignificant data manipulation had profound operational consequences for this group of patients.
Data quality is also particularly relevant for operational decision-making because policy changes can influence the cost and timeliness of care for every patient who presents to a health care organization. Moreover, because health care managers tend to respond to reported performance metrics without understanding the accuracy of the underlying data,12,13 the stage is set for operational decision-making based on faulty information. The focus on data quality in health care organizations thus far has been for research, not for operational performance, limiting our knowledge of how data quality affects decisions that determine operational performance.14,15
The ED is particularly susceptible to data quality problems given the inherent time constraints of care, measurement of shorter time intervals (e.g., minutes and hours rather than days), and the need for manual data collection requiring end-user interaction to indicate that an action has been performed (e.g., medication order). This dependence on human involvement can diminish data quality.16-18 Given the central role that EDs play as the primary source of hospital admissions,19 a key safety net,20 and a source of care for those with time-sensitive conditions in a clinical environment increasingly dependent on electronic information systems,21 data quality is particularly relevant for ED efficiency and performance. Also, because administrative data are used to make decisions on staffing and operational policies, falsely reassuring or alarming data could motivate inappropriate decisions, change perceptions of an organization's capabilities, and threaten long-term viability. We define operational data quality as the ability of the data to accurately represent the operational events and processes that occur during the delivery of care, from the level of the individual patient up to the overall care delivery system.
Considering the strategic importance of organizational decision-making and the vital role operational data play in making these decisions, we studied the effects of data errors on an ED's ability to accurately determine whether it is meeting performance goals in a simulated dataset. Our research questions included: do data errors affect a clinical organization's ability to identify if operational performance goals were met? Do specific types of errors have greater effects on operational metrics of performance than others? We hypothesized that 1) operational performance goals would be perceived as being met less frequently if data errors are introduced; 2) more types of errors would result in fewer operational goals perceived as being met; and 3) as the frequency of errors increases, performance goals would be perceived to be met less frequently. These hypotheses are concerned with the perceptions of operational decision-makers because the operational data that underlie the metrics may not be truly representative of reality. Decision-makers' perceptions of performance drive their decisions because they rely on potentially error-laden data.
Methods
Study Design
We used Monte Carlo methods to generate a simulated operational data set by introducing errors into a flawless baseline dataset. This study was approved by our institutional review board.
Study Setting and Population
We obtained electronic data from a suburban, 22-bed ED in 2011 and have previously published our data-collection methods.22 We selected a three-month period (September 1, 2011 to November 30, 2011) because ED operational decision-making is often done using weekly, monthly, and quarterly data. Having a full three months' of data ensured that we had the entire population of ED patients for that period and that we could assess the full effect of each type of data error. This dataset included the five primary timestamps of ED patient flow, or what we call the ABCDEs of ED patient flow.8,23 They include: Arrival, Bed placement, Clinician evaluation, Disposition decision, and Exit. We also included acuity level (Emergency Severity Index) and disposition status (i.e., admission or discharged).
Study Protocol
We consider three ED operational metrics: 1) arrival to clinician evaluation (i.e., the interval from when a patient arrives until seen by a clinician); 2) disposition decision to exit for admitted patients (i.e., the interval from admission decision until the patient physically exits the ED); and 3) length of stay for admitted patients (i.e., the interval from ED arrival until the patient physically exits the ED). These commonly reported operational metrics were already monitored closely by this ED's leadership.6 For each patient visit, operational metrics were compared to predetermined goals: 30 minutes for arrival to clinician evaluation, 60 minutes for disposition decision to exit, and 240 minutes for admitted length of stay. If the interval duration was less than or equal to the benchmark, that operational metric was considered to have “met” the performance goal (in that management would perceive it as having met that goal). Thus, each patient visit could meet from zero to three of the performance goals listed above.
Assumptions and Data Cleaning
We needed an error-free dataset to serve as our baseline, so we established a set of rules to evaluate and guide our data cleaning. Because the involved timestamps are sequential and negative durations would be operationally meaningless, we assumed that negative time durations could not occur. While negative durations can occur in other ED processes (e.g., physician evaluation in triage prior to bed placement), such activities were not a focus of this study. In order to create a clean dataset with no negative values, we recognized that we had to use all five ABCDE timestamps in our data cleaning, and assumed that these five timestamps were sequential.
Next, we proceeded to data cleaning. The data were first evaluated for missingness. In total, four timestamp data points (out of 36,740 total data points, or 0.011%) were missing. The four missing values were replaced using mean imputation after calculating service intervals (time elapsed between two timestamps, e.g., arrival to bed placement) for all five timestamps. When missingness rates are <5%, single-method mean imputation is an acceptable form of imputation.24 Mean service durations were added to the preceding timestamp to calculate the replacement timestamp. Next, we examined the calculated service intervals for any negative values. Out of the 7,348 intervals, we found 0 negative values for the arrival to bed placement interval, 286 (3.9%) negative values for the bed placement to clinician evaluation, 100 (1.3%) negative values for the clinician to disposition decision; and 88 (1.2%) negative values for the disposition decision to exit. If negative, the earlier of the two timestamps was set to the minimum of the two timestamps creating a zero, non-negative time interval.
In conjunction with this ED's administration, we examined the dataset for outliers for each operational metric. This required establishing upper limits – plausibility thresholds – above which were deemed operationally unlikely durations. We defined plausibility thresholds for each operational metric as follows: >180 minutes for arrival to bed placement; >120 minutes for bed placement to clinician evaluation; and >1440 minutes for both clinician evaluation to disposition decision, and disposition decision to exit. We chose a longer threshold for the arrival to bed placement metric because patients already occupying exam rooms provide visual cues to the providers and wait shorter periods of time. Additionally, because the disposition decision to exit and length of stay intervals encompass more activities with longer associated durations, we used 1440 minutes as the plausibility threshold. In our original dataset, only five (0.07%) visits had arrival to bed placement values >180 minutes, and only 106 (1.4%) of the bed placement to clinician evaluation intervals were >120 minutes.
After establishing plausibility thresholds, we re-evaluated the dataset for negative values and outliers and re-cleaned the data one more time, resulting in no negative values or outliers. Following data cleaning, we had a dataset we felt was complete, error-free, and representative of the existing environment, thereby providing a baseline for our simulation model and subsequent analyses.
Data Errors
We limited our study to four data errors known to exist in practice: substitution, systematic bias, random bias, and missingness.10,22 We defined a substitution error to occur when one data value is substituted for another. For example, we substituted the timestamp “23:59” or 11:59 PM (same day) for existing timestamps. We selected the value “23:59” because it is a substitution error that was seen in a single case report.22 We defined systematic bias errors to be when a data value is shifted by a single, predetermined amount. Such an error can occur if a computer clock were erroneous, resulting in the systematic shift of timestamps. In this study, affected timestamps had 10 minutes added. We selected 10 minutes as a plausible amount of time that may go unnoticed and subsequently not corrected. Random bias involved the addition of a random value uniformly distributed between zero and 20 minutes (with a mean of 10 minutes) to an existing timestamp. Manual data collection (e.g., end-users documenting their activities) can introduce such errors.25 Similar to systematic bias, we selected an average of 10 minutes as a plausible amount of time that could both be unnoticed and uncorrected. Last, missingness errors resulted in the timestamp being set to missing. Such errors occur when end-users do not document activities or deletion of data errors occur.
We developed a 2k full-factorial design of experiments with k=4 types of errors at three different levels of frequencies (2%, 4%, and 7%) to represent the rate at which these errors could occur. While the missingness in our dataset was 0.011%, prior work found that such errors occurred up to 13% in a prior study. Therefore, we felt that 2%, 4%, and 7% represented a conservative, yet plausible estimate of error frequency levels.22 We assumed that an error could occur in any timestamp with equal frequency. Including the baseline case, we created 46 scenarios to conduct our study (Table 1). While random and systematic errors acted by increasing existing timestamps (making them later), there should be no positive bias to the duration of the overall time intervals because both timestamps that define the start and end of the intervals had equal probabilities of being shifted.
Table 1.
Factorial design of four error types introduced into the dataset at three levels of frequency (2%, 4%, 7%).
| Error Types | Error Frequency Levels and Scenario Numbers | |||||
|---|---|---|---|---|---|---|
| A | B | C | D | 2% | 4% | 7% |
| - | - | - | - | Baseline | ||
| X | - | - | - | A2 | A4 | A7 |
| - | X | - | - | B2 | B4 | B7 |
| X | X | - | - | AB2 | AB4 | AB7 |
| - | - | X | - | C2 | C4 | C7 |
| X | - | X | - | AC2 | AC4 | AC7 |
| - | X | X | - | BC2 | BC4 | BC7 |
| X | X | X | - | ABC2 | ABC4 | ABC7 |
| - | - | - | X | D2 | D4 | D7 |
| X | - | - | X | AD2 | AD4 | AD7 |
| - | X | - | X | BD2 | BD4 | BD7 |
| X | X | - | X | ABD2 | ABD4 | ABD7 |
| - | - | X | X | CD2 | CD4 | CD7 |
| X | - | X | X | ACD2 | ACD4 | ACD7 |
| - | X | X | X | BCD2 | BCD4 | BCD7 |
| X | X | X | X | ABCD2 | ABCD4 | ABCD7 |
Error types include: A-systematic substitution (23:59); B-systematic bias (10 minutes); C-missing; D-random bias (mean=10 minutes).
Monte Carlo Simulation
We developed a Monte Carlo simulation using Microsoft Excel 2010 to introduce errors into the cleaned, baseline dataset representing every patient who presented for care during this three-month period. Monte Carlo simulation is useful and appropriate for modeling events subject to stochastic influences (i.e., follow a probability distribution), but which may be assumed to be independent.26 The 2010 version of Excel included a Mersenne Twister algorithm for pseudo-random number generation, making this an acceptable tool passing numerous tests of statistical randomness, including the Diehard tests and most of the TestU01 Crush tests.27,28 Using the scenario's error frequency, a random number generator probabilistically determined whether a data error would be introduced, and if so, the error type. According to the experimental scenario (Table 1), this was repeated for each timestamp and could result in one of four types of errors at three frequency levels (2%, 4%, and 7%) per patient visit. Only a single error was permitted per timestamp, but multiple timestamps could be affected per patient record.
Data Analysis
Following error introduction, we assumed that basic data cleaning would be performed by administrators prior to use for either reporting or decision-making. Therefore, the previously defined data cleaning step was repeated for each experimental scenario.
Service durations were calculated and then stratified by daily two-hour blocks and day of the week (weekday versus weekend). Weekday and weekends were considered separately because this ED's leadership felt the associated patient populations and service characteristics were distinct.
For each operational metric, we used every patient visit in our population to calculate the proportion of patients that met their respective goals, by scenario for each error frequency level. Since we used the entire population, this was not an estimate, but rather a count of patient visits meeting or not meeting performance goals. We then calculated the difference in proportions from the baseline case for each operational metric. Given the large number of scenarios, we used a data visualization technique called “heat mapping” to evaluate for temporal trends that statistical analyses might not identify. Heat mapping graphically represents large amounts of data in two-dimensional plots using different colors and color intensities to represent data values.29,30 Heat maps are frequently used in genetics to map large volumes of gene expression data.30 Last, we used histograms to evaluate the distribution of changes from the baseline case for patient visits perceived as meeting performance goals.
Results
We identified 7,348 patients in this dataset, including 26.7% who were admitted. Table 2 shows descriptive statistics for the baseline case by operational metric, following data cleaning and prior to the introduction of errors. Both mean and median values were shorter in duration on the weekend. The arrival to clinician evaluation measures of central tendency (mean and median) were shorter than their predetermined goal (30 minutes), but both the disposition decision to exit and the length of stay for admitted patient measures exceeded their respective goals of 60 and 240 minutes. Using heat maps to assess hourly and temporal patterns (example heat map, Data Supplement 1), we identified no pattern suggestive of a temporal effect across the 2-hour blocks for each operational metric, nor differences between weekdays and weekends.
Table 2.
Descriptive statistics for the baseline case dataset without data errors.
| Characteristic | n | % | ||
|---|---|---|---|---|
| Number of patients | 7,348 | |||
| Disposition | ||||
| Admitted | 1,962 | 26.7 | ||
| Discharged | 5,386 | 73.3 | ||
|
| ||||
| Service Interval | Mean | SD | Median | IQR |
|
| ||||
| Arrival to clinician evaluation | ||||
| Weekday | 16.9 | 17.5 | 13 | 7-21 |
| Weekend | 14.8 | 14.9 | 11 | 6-18 |
| Disposition decision to exit (admit) | ||||
| Weekday | 78.0 | 150.4 | 47 | 28-76 |
| Weekend | 69.0 | 134.3 | 45 | 26-74 |
| Length of stay (admit) | ||||
| Weekday | 307.7 | 178.5 | 278 | 219-352 |
| Weekend | 293.5 | 184.8 | 260 | 205-325 |
All times are in minutes.
As the error frequency level increased from 2% to 7%, fewer patient visits met each operational metric's goal (Table 3). This effect was largest among the disposition decision to exit measure, decreasing from 66.8% to 65.5% (absolute difference of 1.3%).
Table 3.
Proportion of ED patients who meet the respective time interval goal in the baseline case (with no errors) and at the 2%, 4%, and 7% error frequency levels.
| Time Interval | Goal (minutes) | Base Case | Error Frequency Level | ||
|---|---|---|---|---|---|
|
| |||||
| 2% | 4% | 7% | |||
| Arrival to clinician evaluation | 30 | 90.3% | 90.0% | 89.8% | 89.4% |
| Disposition decision to exit (admit) | 60 | 66.8% | 66.3% | 66.2% | 65.5% |
| Length of stay (admit) | 240 | 37.7% | 37.5% | 37.5% | 37.1% |
When examining the proportional differences by scenario for each operational metric baseline case, we identified several changes in the distribution and magnitude of errors compared to the baseline case. Across all operational metrics, as the frequency of errors increased, the majority of deviations from the baseline case were in a negative direction. In other words, fewer patients were perceived as meeting the goals for each operational metric at each error frequency level. Next, the disposition decision to exit operational metric had the largest magnitude of deviation, with one scenario having an absolute 3.6% fewer patients perceived as meeting the performance goal. On the other hand, the largest positive deviation (i.e., the goal was perceived as being met after error introduction) across all error frequency levels was 0.5%. The arrival to clinician evaluation operational metric had the most scenarios change from the baseline case, with 13 out of 15 (86.7%) not perceived as meeting the performance goal, and this was seen at the 7% error frequency level.
When we plotted the relative difference from the baseline case for each scenario (Figure 1), several patterns emerged. First, the perceived ability of this ED to meet each operational metric's goal is affected by error types and the frequency level. For the disposition decision to exit and length of stay operational metrics, the up-down alternating pattern in the graph corresponds with the presence or absence of the 23:59 “systematic substitution” error created by the initial sequence of experiments. With few exceptions, the presence of this error makes the operational metric for each scenario deviate further from the baseline case. Additionally, the deviation from the baseline increases as the error frequency level rises. In fact, the largest absolute deviation from the baseline case (3.6%) corresponded with the A7 scenario (23:59 systematic substitution error, 7% frequency level) for the disposition decision to exit operational metric.
Figure 1.
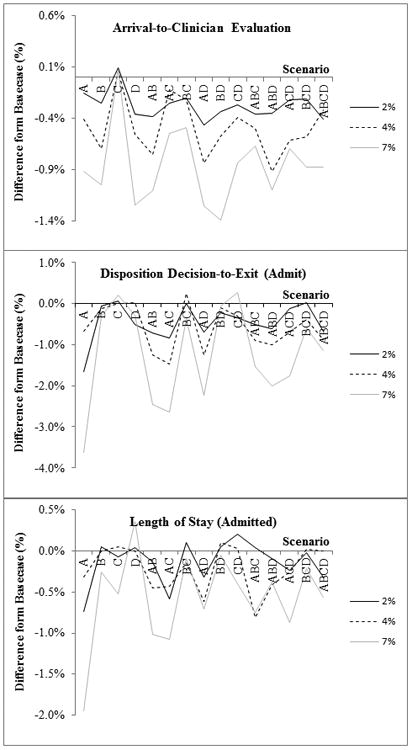
Line graph of percent difference from the baseline case by scenario at the 2%, 4%, and 7% error frequency levels for the following operational metrics: a) Arrival to clinician evaluation; b) Disposition decision to exit (admit); and c) length of stay (admit).
Discussion
Our study provides a novel understanding of the effects of data errors on operational data in the ED. We found that even small errors have measureable effects on a clinical organization's ability to accurately determine whether it is meeting its operational goals. Despite using conservative estimates of error magnitude and frequency compared to errors likely to occur in real-world settings, we found EHR data errors had potentially devastating effects on an ED's ability to accurately track success with operational performance metrics. These findings underscore the fundamental role of high data quality when evaluating health care organizational performance.
Error types differentially affect the distribution of the error differences from the baseline case by operational metric. For example, when evaluating disposition decision to exit, seven scenarios resulted in an absolute difference from the baseline case of ≥1.5%. For the remaining operational metrics, only one scenario reached this magnitude. The largest difference from the baseline case corresponded with the 23:59 systematic substitution error in the disposition decision to exit interval, resulting in 3.6% fewer patients meeting the performance goal.
The introduction of multiple error types may impede error identification. Single substitution errors accounted for the most patient visits falsely not meeting performance goals. When additional errors types were introduced, the combination produced results closer to the “true” baseline case (Figure 1). This may explain why poor data quality is difficult to identify and quantify, as seen in the business literature on enterprise information systems, but is now demonstrated in a health care setting.31-34 Thus, particular types of errors (e.g., substitution errors or those with a large error magnitudes) may be more important to monitor. Prioritizing error types may make data-quality efforts more efficient. For example, monitoring for specific timestamps that appear more frequently than expected could be a strategy to identify when substitution errors occur.
Next, the choice of operational metrics and associated performance goals may be a key determinant of the measurement system's robustness in the face of data errors. Operational metrics with shorter goal durations (e.g., arrival to clinician evaluation) were perceived to have met the targeted goals in fewer scenarios following error introduction. However, operational metrics with longer duration goals required a larger error to have a noticeable effect. EDs that rely on human interaction to document a timestamp (e.g., clinician evaluation time) may preferentially select longer duration operational metrics, which are less likely to compromise the quality of such a time period. Alternatively, passively captured timestamps requiring no human interaction (e.g., with the use of radio frequency identification tags) could increase the quality and reliability of the time period evaluation. Passive data collection may also permit the evaluation of shorter time periods.
While the effect of data error introduction on operational metrics was relatively small compared with the higher rate of timestamp errors, as seen in the clinical example of pediatric ED patients with bronchiolitis,11 even minimal deviations from the baseline case can potentially have substantial cost and operational consequences. EDs using a proportional goal for an operational metric (e.g., percentage of patients meeting their arrival to clinician evaluation goal), could be affected by even small magnitude errors. For example, 90% is a common goal for the arrival to clinician evaluation interval. However, in the baseline case of our study, 90.3% of visits met this goal. Small magnitude errors, such as those caused by an incorrect computer clock, can make this ED go from meeting its performance goal in the baseline case and 2% error frequency levels, to falsely believing it is no longer meeting them at the 4% and 7% error frequency levels. Considering that the ED manager and hospital administration may have different thresholds for action, it is difficult to say how often such data errors would translate into actionable change. However, the implications of even seemingly small data errors become readily apparent when organizational leadership acts upon these operational metrics. Unlike bronchiolitis in the earlier clinical example, changes to operational policies are systematic and can affect every patient presenting in the ED. Operational policy changes, such as activating additional staffing, could result in increased personnel cost or other changes affecting how every ED patient is cared for. Such changes may not have been previously justified and may divert resources from other important and justified projects.
Data quality best practices
To ensure high-quality data and to minimize the effect of data errors on operational decision-making, we have identified six best practice procedures that should be used prior to the use of operational data for decision-making purposes. First, there should be an automated approach (e.g., computer scripts) to identify times or errors that appear more frequently than they should. Such surveillance could prompt an investigation of data quality and sources of data errors. Second, data cleaning should be done consistently and thoroughly prior to use of data to ensure that high-frequency, known errors are removed prior to any decision-making. Third, a data-integrity champion should be established to be responsible for the monitoring and the regular reporting of data quality results. Fourth, if identifiable, there should be an acceptable threshold for each error type. If exceeded, this too could trigger an analysis (e.g., root cause analysis) to identify why error rates have changed. Fifth, if new errors are identified following the reporting of performance results, a revision of prior performance should be made available. Finally, implementation of new information systems should warrant an increased level of scrutiny until end-user behavior, procedures, and practices are normalized.
This study raises additional questions for further investigation. How extensive is the problem of data errors in EHRs and what other types and frequencies of errors exist? What are the factors associated with data error introduction and how can they best be mitigated? Are some EHRs more robust to data quality perturbations? What error frequency level should be tolerated in existing information systems? What are common administrative data handling practices in clinical organizations prior to their use in operational decision-making? Answering these questions would help to identify the amount of attention, effort, and resources that should be applied to monitoring data quality in a clinical information system.
Limitations
First, our dataset is from a single ED over a three-month period and may not be representative of all potential errors types and frequency rates, thereby limiting our generalizability. For example, the substitution error of 23:59 was only seen in a single setting. To address this, we used known error types and conservative frequency levels for each error type. Further, we randomly introduced each of the errors using Monte Carlo simulation to limit selection bias in our study design. We consider this an exploratory analysis to initially evaluate whether data errors introduced into an EHR could affect perceived operational performance, and future studies should address more completely how different types of data errors affect perceived operational performance.
Second, the selection of these error types resulted in calculated intervals that were more likely to be lengthened than shortened following the introduction of errors, thereby biasing operational metrics away from meeting established goals. Again, these are known error types, but future analyses should include error types that occur earlier than the existing timestamp, since changing the direction of error types (i.e., negative errors) could affect our findings. Also, future analyses should vary the frequency of error rates, as some error types might occur at different rates.
Last, our “perfect” dataset is not an exact replica of the setting from which we obtained our data. We cleaned these data so that the error types we were studying (e.g., missingness) were not present in the dataset prior to manipulation, and all results were compared with this perfect dataset. Using imputation to fill in data points that were missing or nonsensical in the original dataset could potentially have biased our results toward finding a significant effect. However, the low frequency of imputation (<5% for all types of errors) lessens this concern. Further, some facilities may not clean their data, nor might they use the same approach that we did. This cleaning step has an important effect because negative values, albeit infrequent, were removed from the dataset, creating an error-free dataset to serve as a baseline for comparison. Substitution errors were partially mitigated by our approach. However, substitution errors that do not result in calculated intervals that are large in magnitude may not be identified and removed by our approach to data cleaning.
Conclusions
Data errors can disguise our understanding of operational performance in clinical environments such as the ED, and may result in inappropriate decision-making. Single-substitution error types occurring at the 7% frequency level resulted in up to 3.6% fewer patient visits being perceived as meeting performance goals. Prioritizing data quality is necessary to ensure that operational decision-making is based on accurate administrative data, and that limited health care resources can be directed where they are most needed.
Supplementary Material
Acknowledgments
The authors would like to thank Christopher J. Lindsell, PhD and W. David Kelton, PhD for their assistance and input in preparation of this project and manuscript.
Funding: The project described was supported by Award Number K12 HL109019 from the National Heart, Lung, and Blood Institute. The content is solely the responsibility of the authors and does not necessarily represent the official views of the National Heart, Lung, and Blood Institute or the National Institutes of Health.
Footnotes
Competing Interests: None
Meeting Presentations: Production and Operations Management Society, May 2013, Denver, CO., Society for Academic Emergency Medicine, May 2014, Dallas, TX.
References
- 1.Kohn LT, Corrigan J, Donaldson MS. To err is human: building a safer health system. Washington, D.C.: National Academies Press; 2000. [PubMed] [Google Scholar]
- 2.Lahiri A, Seidmann A. The hang-over effect in information-intensive service systems. P Ann Hicss. 2010:2538–47. [Google Scholar]
- 3.Reid PP, Compton WD, Grossman JH, et al. Building a better delivery system: a new engineering/health care partnership. Washington, D.C.: National Academies Press; 2005. [PubMed] [Google Scholar]
- 4.Agarwal R, Gao GD, DesRoches C, Jha AK. The digital transformation of healthcare: current status and the road ahead. Inform Syst Res. 2010;21:796–809. [Google Scholar]
- 5.Hsiao CJ, Hing E, Socey TC, Cai B. Electronic Health Record Systems and Intent to Apply for Meaningful Use Incentives Among Office-based Physician Practices: United States, 2001–2011. Hyattsville, MD: National Center for Health Statistics; 2011. [PubMed] [Google Scholar]
- 6.Hospital Compare. [Accessed June 14, 2015]; Medicare.gov. Available at: http://www.medicare.gov/hospitalcompare/
- 7.Scott JT, Rundall TG, Vogt TM, Hsu J. Kaiser Permanente's experience of implementing an electronic medical record: a qualitative study. BMJ. 2005;331:1313–6. doi: 10.1136/bmj.38638.497477.68. [DOI] [PMC free article] [PubMed] [Google Scholar]
- 8.Ward MJ, Froehle CM, Hart KW, Collins SP, Lindsell CJ. Transient and sustained changes in operational performance, patient evaluation, and medication administration during electronic health record implementation in the emergency department. Ann Emerg Med. 2014;63(3):320–8. doi: 10.1016/j.annemergmed.2013.08.019. [DOI] [PMC free article] [PubMed] [Google Scholar]
- 9.Ward MJ, Landman AB, Case K, Berthelot J, Pilgrim RL, Pines JM. The effect of electronic health record implementation on community emergency department operational measures of performance. Ann Emerg Med. 2014;63:723–30. doi: 10.1016/j.annemergmed.2013.12.019. [DOI] [PMC free article] [PubMed] [Google Scholar]
- 10.Clark C. CMS Posts ED Wait Times, Rankling Some Hospitals. [Accessed June 14, 2015]; Available at: http://www.healthleadersmedia.com/page-1/QUA-289903/CMS-Posts-ED-Wait-Times-Rankling-Some-Hospitals.
- 11.Schuh S, Freedman S, Coates A, et al. Effect of oximetry on hospitalization in bronchiolitis: a randomized clinical trial. JAMA. 2014;312:712–8. doi: 10.1001/jama.2014.8637. [DOI] [PubMed] [Google Scholar]
- 12.Davies S, Saynina O, Schultz E, McDonald KM, Baker LC. Implications of metric choice for common applications of readmission metrics. Health Serv Res. 2013;48:1978–95. doi: 10.1111/1475-6773.12075. [DOI] [PMC free article] [PubMed] [Google Scholar]
- 13.Richardson PR, Gordon JRM. Measuring total manufacturing performance. Sloan Manage Rev. 1980;21:47–58. [Google Scholar]
- 14.Gilbert EH, Lowenstein SR, Koziol-McLain J, Barta DC, Steiner J. Chart reviews in emergency medicine research: where are the methods? Ann Emerg Med. 1996;27:305–8. doi: 10.1016/s0196-0644(96)70264-0. [DOI] [PubMed] [Google Scholar]
- 15.Worster A, Bledsoe RD, Cleve P, Fernandes CM, Upadhye S, Eva K. Reassessing the methods of medical record review studies in emergency medicine research. Ann Emerg Med. 2005;45:448–51. doi: 10.1016/j.annemergmed.2004.11.021. [DOI] [PubMed] [Google Scholar]
- 16.Smith PC, Araya-Guerra R, Bublitz C, et al. Missing clinical information during primary care visits. JAMA. 2005;293:565–71. doi: 10.1001/jama.293.5.565. [DOI] [PubMed] [Google Scholar]
- 17.Benin AL, Fenick A, Herrin J, Vitkauskas G, Chen J, Brandt C. How good are the data? Feasible approach to validation of metrics of quality derived from an outpatient electronic health record. Am J Med Qual. 2011;26:441–51. doi: 10.1177/1062860611403136. [DOI] [PubMed] [Google Scholar]
- 18.Hogan WR, Wagner MM. Accuracy of data in computer-based patient records. J Am Med Inform Assoc. 1997;4:342–55. doi: 10.1136/jamia.1997.0040342. [DOI] [PMC free article] [PubMed] [Google Scholar]
- 19.Schuur JD, Venkatesh AK. The growing role of emergency departments in hospital admissions. N Engl J Med. 2012;367:391–3. doi: 10.1056/NEJMp1204431. [DOI] [PubMed] [Google Scholar]
- 20.Tang N, Stein J, Hsia RY, Maselli JH, Gonzales R. Trends and characteristics of US emergency department visits, 1997-2007. JAMA. 2010;304:664–70. doi: 10.1001/jama.2010.1112. [DOI] [PMC free article] [PubMed] [Google Scholar]
- 21.Geisler BP, Schuur JD, Pallin DJ. Estimates of electronic medical records in U.S. emergency departments. PLoS One. 2010;5:e9274. doi: 10.1371/journal.pone.0009274. [DOI] [PMC free article] [PubMed] [Google Scholar]
- 22.Ward MJ, Froehle CM, Hart KW, Lindsell CJ. Operational data integrity during electronic health record implementation in the ED. Am J Emerg Med. 2013;31:1029–33. doi: 10.1016/j.ajem.2013.03.027. [DOI] [PubMed] [Google Scholar]
- 23.Welch SJ, Asplin BR, Stone-Griffith S, et al. Emergency department operational metrics, measures and definitions: results of the Second Performance Measures and Benchmarking Summit. Ann Emerg Med. 2011;58:33–40. doi: 10.1016/j.annemergmed.2010.08.040. [DOI] [PubMed] [Google Scholar]
- 24.Harrell FE. Regression Modeling Strategies: with Applications to Linear Models, Logistic Regression, and Survival Analysis. New York, NY: Springer; 2001. [Google Scholar]
- 25.Gordon BD, Flottemesch TJ, Asplin BR. Accuracy of staff-initiated emergency department tracking system timestamps in identifying actual event times. Ann Emerg Med. 2008;52:504–11. doi: 10.1016/j.annemergmed.2007.11.036. [DOI] [PMC free article] [PubMed] [Google Scholar]
- 26.Law AM. Simulation modeling and analysis. 4th. Boston, MA: McGraw-Hill; 2006. [Google Scholar]
- 27.L'Ecuyer P, Simard R. TestU01: A C library for empirical testing of random number generators. Acm T Math Software. 2007;33 [Google Scholar]
- 28.Melard G. On the accuracy of statistical procedures in Microsoft Excel 2010. Comput Stat. 2014;29:1095–128. [Google Scholar]
- 29.Deu-Pons J, Schroeder MP, Lopez-Bigas N. Heatmap: an interactive heatmap viewer for the web. Bioinformatics. 2014;30:1757–8. doi: 10.1093/bioinformatics/btu094. [DOI] [PubMed] [Google Scholar]
- 30.Deng W, Wang Y, Liu Z, Cheng H, Xue Y. HemI: a toolkit for illustrating heatmaps. PLoS One. 2014;9:e111988. doi: 10.1371/journal.pone.0111988. [DOI] [PMC free article] [PubMed] [Google Scholar]
- 31.Redman TC. The impact of poor data quality on the typical enterprise. Comm Assoc Comp Mach. 1998;41:79–82. [Google Scholar]
- 32.Reid AC. Invisible data quality issues in a CRM implementation. J Datab Market Customer Strat Manage. 2005;12:305–14. [Google Scholar]
- 33.Tayi GK, Ballou DP. Examining data quality. Comm Assoc Comp Mach. 1998;41:54–7. [Google Scholar]
- 34.Vosburg J, Kumar A. Managing dirty data in organizations using ERP: lessons from a case study. Ind Manage Data Syst. 2001;101:21–31. [Google Scholar]
Associated Data
This section collects any data citations, data availability statements, or supplementary materials included in this article.