

Abstract
Background
Basal-like breast cancer (BLBC) is a rare aggressive subtype that is less likely to be detected through mammographic screening. Identification of circulating markers associated with BLBC could have promise in detecting and managing this deadly disease.
Methods
Using samples from the Polish Breast Cancer study, a high-quality population-based case-control study of breast cancer, we screened 10,000 antigens on protein arrays using 45 BLBC patients and 45 controls, and identified 748 promising plasma autoantibodies (AAbs) associated with BLBC. ELISA assays of promising markers were performed on a total of 145 BLBC cases and 145 age-matched controls. Sensitivities at 98% specificity were calculated and a BLBC classifier was constructed.
Results
We identified a 13-AAbs (CTAG1B, CTAG2, TP53, RNF216, PPHLN1, PIP4K2C, ZBTB16, TAS2R8, WBP2NL, DOK2, PSRC1, MN1, TRIM21) that distinguished BLBC from controls with 33% sensitivity and 98% specificity. We also discovered a strong association of TP53 AAb with its protein expression (p=0.009) in BLBC patients. In addition, MN1 and TP53 AAbs were associated with worse survival (MN1 AAb marker HR=2.25 95%CI= 1.03-4.91 p=0.04; TP53, HR=2.02, 95%CI 1.06-3.85, p=0.03). We found limited evidence that AAb levels differed by demographic characteristics.
Conclusions
These AAbs warrant further investigation in clinical studies to determine their value for further understanding the biology of BLBC and possible detection.
Impact
Our study identifies 13 AAb markers associated specifically with BLBC and may improve detection or management of this deadly disease.
Introduction
Breast cancer is known to encompass multiple clinically, molecularly and pathologically defined subtypes that have very different etiologies, clinical presentations and outcomes (1-3). Mammographic screening has reduced mortality for breast cancer overall but not for all cancer subtypes; specifically, interval cancers that are estrogen receptor (ER) negative tend to be aggressive and are not well detected by mammography (4-6).
There is great interest in identifying circulating markers associated with aggressive ER-negative basal-like breast cancers (BLBC), which although rarer than other subtypes, are more common in BRCA1 mutation carriers and African-Americans, and occur at younger ages when most mammographic screening programs have shown poorer performance to detect cancer (7, 8). In cancer studies, autoantibodies (AAbs) represent a promising class of biomarkers for early detection. AAbs are created by the immune system in response to host proteins and have been shown to be elevated in cancer patients (9-13). Large-scale proteomic screening is an important approach to identify AAb markers and we have previously identified AAbs associated with different diseases, including cancers, using nucleic acid programmable protein arrays (NAPPA) (14-18). The advantage of NAPPA over other proteomic screening methods is that it displays thousands of in vitro-expressed full-length human proteins on glass slides without the need of laborious methods for protein purification (19, 20).
Few studies trying to identify AAbs associated with breast cancer have focused on identifying markers for specific molecular subtypes, primarily because of limited access to highly characterized samples of sufficient numbers. Although many immunohistochemical (IHC) signatures have been described to classify BLBC, the proposed IHC panel by Nielsen et al is the most robust with 100% specificity and 76% sensitivity to classify BLBC when compared to molecular profiling methods (21). The Nielsen IHC panel defines BLBC as those lacking estrogen receptor (ER) and human epidermal growth factor receptor 2 (HER2) expression, with positive expression of epidermal growth factor receptor (EGFR) or basal cytokeratin 5/6 (CK5/6). Here we carried out a study to identify AAbs associated with BLBC using samples collected from a high quality, population based case-control study in Poland.
Materials and Methods
Study samples
Subjects were selected from a population-based breast cancer case-control study of 2386 cases and 2502 age and study site matched controls, between ages 20 and 74 years who resided in Warsaw or Łódź, Poland from 2000-2003 (22). Breast cancer risk factors were obtained from a questionnaire as previously described (22). We specifically evaluated age at blood collection, age at menarche, parity, menopausal status, current BMI, family history of breast cancer, and history of benign breast disease. Pathology for all the study cases were reviewed centrally as previously described to provide standardized classification. The basal-like subtype was defined by PAM50 signature when mRNA expression profiles were available (n=18); the rest (n=127) were identified by immunohistochemical (IHC) staining for the five markers (ER, PR, HER2, CK5/6, EGFR) as previously described (23, 24). The Luminal A, Luminal B, and HER2-enriched subtypes were classified using PAM50 signature. We identified 145 cases with tumor tissues and plasma samples available (25). Similar to previous reports (21), we observed an 80% concordance rate between the five-IHC marker panel and the mRNA expression profiles. Each case was individually matched on age (5 years) and study site with population based controls. To determine the specificity of AAbs identified for BLBC, we selected an additional set of age-matched non-basal cases (age matched to sample sets 2 and 3) classified by mRNA expression profiles (30 Lum A, 22 LumB and 18 HER2). The majority of blood samples among cases were collected prior to treatment (52% of BLBC, 57% of LumA, 86% of LumB and 78% of HER2). All subjects provided informed consent and the study was approved by IRB boards in Poland and NCI.
Protein array experiments
All open reading frames were obtained from DNASU (https://dnasu.org/). Production of the protein array and array quality control experiments were performed as previously described (26, 27). In brief, arrays displaying 10,000 human proteins (distributed evenly on five array sets) were manufactured. A common control plasma sample was repeated in every experiment to assess reproducibility. Consistency among experiments was determined with scatter plots comparing spot intensity measurements of the same plasma sample tested on different experiments. Details are described in Supplementary Materials and Methods.
Protein array image analysis and quantification
We measured the spot intensity of the scanned slides using ArrayPro Analyzer (MediaCybernetics). Raw intensity values were normalized by subtracting the background signal for the slide, which was estimated by the first quantile of signal intensity in spots with no printed DNA, and divided by the median of background-subtracted intensity from non-control spots. In addition, to capture diffused signal (ring) that cannot be quantified by the image analysis software, one researcher qualitatively examined all images to identify and confirm positive responses, which was described previously (28). Briefly, the researcher adjusted raw images to extreme contrast and brightness using ArrayPro Analyzer, and graded each spot at a scale of 0 to 5 based on ring's intensity and morphology.
Antigen selection for focused array
Using the normalized array data from the screening, we calculated sensitivity at 95% specificity based on the data generated from printing batch 1 of each array set, area under receiver operating characteristic curve (AUC), partial AUC above 95% specificity (pAUC), as well as Welch's t test P value for each tested protein antigen. In addition, we designed a novel metric, named K, to measure antigens with strong antibody responses in a fraction of BLBC patients while remain consistent in controls to aid the candidate selection. K was empirically defined using the formula below.
where qcases and qcontrols denote the empirical quantile functions of normalized data from cases and controls, respectively. Specifically, qcases(0.975) – qcases(0.800) was chosen to quantify the separation of the top 20 percentile of the cases’ signals, as K was designed to be sensitive to markers with moderate sensitivity yet better separation. The K value is useful at identifying biomarkers that work well for a subset of the true cases, even if the marker does not show a response in other cases. To demand that the selected marker works for more than one case, we chose the top boundary at 97.5 percentile. For antibodies with the same classification performance, a higher K value indicated greater separation of sero-reactivity of positive cases and negative controls.
We created focused protein arrays for stringent evaluation of antigens that met at least one of the following criteria: 1) antigens ranked in approximately the top 2% of antigens on each array set based on any of these metrics: sensitivity at 95% specificity (n=228), AUC (n=185), pAUC (n=197), or P value of Welch's t test (n=197); 2) antigens with K > 1.2 and sensitivity at least 15% at 95% specificity (n=63); and 3) antigens with greater prevalence in cases than in controls by visual analysis (n=198). Specifically, frequency in cases minus frequency in controls was greater than or equal to 2, and frequency in cases divided by frequency in controls was greater than or equal to 1.5; 4) antigen with greater prevalence in controls than in cases by visual analysis (n=16). Specifically, frequency in controls minus frequency in cases was greater than or equal to 5, and frequency in controls divided by frequency in cases was greater than 1.5. In total, 748 proteins were included for manufacturing focused array.
Power analysis for the biomarker discovery
We calculated the power for antigen selection using a homogeneous disease model and a heterogeneous disease model (29). Using each model and Monte Carlo simulation, we calculated the proportion of markers with 20% sensitivity and 95% specificity that met criteria 1 or 3 in above section “Antigen selection for focused array”. The visual inspection criterion was not considered in the power analysis. Under the homogeneous disease model, 95% of markers with 20% sensitivity and 95% specificity met the selection criteria, and 5% of non-markers with 5% sensitivity at 95% specificity met the criteria. Under the heterogeneous model, 73% of markers and 6% of non-markers met the criteria. Hence, nearly all such markers with 20% sensitivity and 95% specificity would be selected by our screening process if basal-like subtype is homogeneous, and if it is itself heterogeneous, our process would still be expected to select 73% of these markers.
Antigen selection for ELISA verification
Protein antigens were selected for subsequent ELISA verification when they showed higher prevalence in basal-like breast cancer (BLBC) in sample set 1 based on visual analysis. Specifically, they had to meet all of the following criteria: 1). their frequency in BLBC minus frequency in controls is greater than or equal to 3; 2). frequency in cases divided by frequency in controls is greater than or equal to 2; and 3). frequency in cases is greater than or equal to 4. Totally, eighty-two unique proteins met these criteria and we successfully developed programmable ELISA assay for 71 of them. Two pairs of samples (PBCS-1243, PBCS-2930; PBCS-1754, PBCS-1325) were not measured in ELISA verification experiments due to limited amount of plasma at the time of experiment.
ELISA assays
ELISA assays were performed to verify selected AAb responses towards protein antigens using freshly produced human proteins as previously described (30). In brief, 96-well highbind ELISA plates (Corning) were coated with the goat anti-GST antibody (GE Healthcare) at 10 μg/ml in 0.2 M sodium bicarbonate buffer pH9.4 overnight at 4°C one day prior to experiment. All high-throughput liquid handling were performed using a BioMek NxP Laboratory Automation Workstation (Beckman Coulter). See Supplementary Materials and Methods for additional details.
Statistical analysis
Frequencies of tumor characteristics and demographics between cases were compared using chi-square tests. Associations with known breast cancer risk factors were determined using multivariable logistic regression models as previously described (22).
ROC analysis was performed without feature selection (to avoid over fitting) using leave-one-out cross validation. The 13-AAb classifier was developed by classifying samples as positive if they exceeded antigen-specific cutoffs for at least 2 of the 13 antigens. Antigen-specific cutoffs were set to achieve 98% classifier specificity by adjusting the specificity at the antigen level to 98.7%. In this cross validation, for a given antigen-level specificity, we calculated the cutoffs for each antigen using the remaining samples and used these cutoffs to classify the held-out sample. The ROC curve was calculated by adjusting the antigen-level specificity. 95% confidence intervals of ROC curve and AUC were estimated by bootstrapping within BLBC or controls.
We assessed the association of AAb levels in relation to demographic characteristics using Kruskal Wallis test. To determine AAb responders from ELISA analysis, we categorized subjects as responders to specific antigens of interest using 95-percentile cut-point using data from control subjects. This method was used to determine the association of AAb responses with tissue abundance of TP53 protein, as well as the overall survival.
The Kaplan-Meier (KM) method was used to generate survival curves for categories of the AAb responders/non-responders (31). HR and 95% confidence intervals (CI) associated with AAb markers adjusted for age, tumor size, grade, and node status, were estimated using Cox proportional hazard models (32). Survival analysis was performed using Stata/SE v11.2 for Windows (College Station, TX).
Results
Sample tumor characteristics and risk factors
BLBC for 145 cases with plasma and individually age-matched controls were identified in the Polish breast cancer study and their characteristics presented in Table 1. Sample set 1, used for protein array screening, comprised 45 cases and 45 controls (Figure. 1; Table 1). The remaining 100 BLBC were randomly assigned to sample sets 2 and 3 for follow up studies of promising AAb markers. Sample set 4 were age-matched non-basal subtypes selected to determine specificity of AAbs identified for BLBC. Analysis of tumor characteristics showed cases in sample set 1 more likely to be of higher grade and less likely to be node positive compared to sample set 2 and 3. Evaluation of established breast cancer risk factors for the 145 BLBC cases and 145 age-matched controls showed early age at menarche, positive family history of breast cancer, history of benign breast disease and ever having a screening mammogram associated with increased breast cancer risk (Table S1).
Table 1.
Descriptive characteristics of samples used to identify AAbs associated with BLBC.
| Sample Set 1 |
Sample Set 2 |
Sample Set 3 |
Sample Set 4 |
||||||
|---|---|---|---|---|---|---|---|---|---|
| basal-like n=45 | control n=45 | basal-like n=50 | control n=50 | basal-like n=50 | control n=50 | LumA n=30 | LumB n=22 | HER2 n=18 | |
| Age, mean (SD) | 53.1(9.8) | 51.6 (9.6) | 54.1 (10.4) | 54.1(10.4) | 52.6(11.2) | 52.6 (11.2) | 54.3 (11.0) | 56.5 (9.6) | 58.0 (7.1) |
| Age min-max | 32-74 | 30-70 | 31-72 | 31-72 | 34-74 | 34-74 | 36-73 | 39-73 | 46-71 |
| Parous (%) | 93 | 84 | 84 | 82 | 84 | 82 | 87 | 82 | 83 |
| Menopausal (%) | 64 | 56 | 74 | 58 | 58 | 52 | 70 | 73 | 83 |
| Poorly differentiated (%) | 76 | 43 | 48 | 3 | 23 | 34 | |||
| Node positive (%)a | 29 | 53 | 42 | 47 | 45 | 56 | |||
| >2mm size (%) | 62 | 62 | 62 | 33 | 50 | 72 | |||
Chi2 P<0.05 between sample set
Figure 1.

Overview of study design.
AAb screen of 10,000 antigens using NAPPA array
We performed comprehensive profiling of 10,000 full-length human proteins in sample set 1 to identify promising AAb markers associated with BLBC using both quantitative and visual analysis (Figure S1). Quality of protein array and plasma experiments was assured with consistent protein display (Figure 2A-C) and high reproducibility (Figure 2D-E; Figure S2). Across the 10,000-antigen array, the median number of AAb responses was similar between cases and controls (Figure S3; Table S2; Table S3). The protein array data have been deposit in the National Center for Biotechnology Information's Gene Expression Omnibus (GEO) and are accessible through GEO series accession number GSE68119 (http://www.ncbi.nlm.nih.gov/geo/query/acc.cgi?acc=GSE68119). To assess protein characteristics that trigger AAbs in general, we performed gene set enrichment analysis (GSEA) of potential common biochemical protein properties, such as protein length, isoelectric point, aromaticity and fractions of predicted secondary structures, as well as predicted antigenicity by common algorithms using proteins that elicit AAb responses in both BLBC cases and controls (see Supplementary Materials and Methods). We found significant over representation of proteins predicted with high antigenicity (Figure S4). AAb responses were positively associated with protein length, isoelectric point, and fraction of turns, and negatively associated with aromaticity, fraction of α helices (Figure S5). Gene ontology of cellular component analysis indicated that autoantigens identified by visual analysis were significantly enriched in the nucleus and centrosome; while significantly depleted in the plasma membrane, extracellular region and endoplasmic reticulum membrane (Figure S6).
Figure 2.

Protein array screening. Protein array was quality controlled by both DNA staining with picogreen (A), and anti-GST staining of in vitro produced proteins (B). C. Scatterplot of signal intensity measures of protein displays of two protein arrays produced in one single print batch. D. Scatterplot of signal intensity measures of two identical protein arrays probed with the same plasma sample. E. Scatterplot of signal intensity measures of two replicate spots with one array.
In order to identify candidate AAbs among the 10,000 antigens that distinguished BLBC from controls, we took two complementary approaches (Figure 1). In the first approach, using the array data from sample set 1, we selected 748 antigens (see Materials and Methods; Table S4; Figure S7; Figure S8) to produce focused arrays for testing using sample set 2 (Table 1). From these, fourteen antigens with sensitivities above 10% at 98% specificity and K>0.9 in sample set 2 were selected for blinded replication testing with sample set 3 (Table S5). In our second approach, using visual analysis, we selected 82 antigens on the 10,000 array that distinguished BLBC compared to controls in sample set 1 for ELISA (see Materials and Methods). ELISA assays were successfully developed for 71 of the 82 antigens (Table S6). After analysis of sample set 1, 15 antigens with sensitivities above 10% at 98% specificity and K>0.9 (Table S7) were identified. Using these two approaches, focused arrays and ELISA, AAbs against 26 unique proteins were carried forward for a subsequent blind test by ELISA.
Blind test of 26 AAb markers associated with BLBC
To test these 26 candidate antigens from our staged screen, an ELISA study using sample sets 1 and 2 as a training set was performed in order to set threshold values (98% specificity) for each antigen. We then blindly tested the performance of these 26 markers using sample set 3 (Figure 1). In the training set, plasma antibodies against CTAG1B and CTAG2 proteins demonstrated the best ability to differentiate patients from controls with sensitivities of 21%, 19% respectively at 98% specificity (Table 2). In the blinded test, all 26 antigens were assessed using cutoff values defined by the control samples in the training study. AAbs against TP53, CTAG1B, PPHLN1, WBP2NL, DOK2 showed sensitivities above 5% at 98% specificity in both training and test sets. AAbs against CTAG2 showed lower specificity (96%) in the test set, but its sensitivity remained high at 18% (Table 2).
Table 2.
Training and test statistics for potential BLBC autoantibody biomarkers.
| Antigen | Training (Sample sets 1&2: basal, n=95; control, n=95) |
Blinded Test (Sample set 3: basal, n=50; control, n=50) |
|||
|---|---|---|---|---|---|
| sensitivity | specificity | cutoffsa | sensitivity | specificity | |
| CTAG1B | 0.213 | 0.979 | 1.606 | 0.200 | 1.000 |
| CTAG2 | 0.191 | 0.979 | 1.149 | 0.180 | 0.960 |
| TRIM21 | 0.158 | 0.979 | 1.208 | 0.140 | 0.860 |
| RNF216 | 0.110 | 0.978 | 1.369 | 0.043 | 0.956 |
| MN1 | 0.105 | 0.979 | 1.311 | 0.060 | 0.920 |
| PIP4K2C | 0.105 | 0.979 | 1.200 | 0.020 | 1.000 |
| TP53 | 0.084 | 0.979 | 3.171 | 0.200 | 1.000 |
| ZBTB16 | 0.084 | 0.979 | 1.393 | 0.040 | 0.980 |
| DOK2 | 0.074 | 0.979 | 1.164 | 0.060 | 1.000 |
| PPHLN1 | 0.063 | 0.979 | 3.394 | 0.080 | 1.000 |
| TAS2R8 | 0.063 | 0.979 | 1.064 | 0.080 | 0.940 |
| SSMEM1 | 0.063 | 0.979 | 1.562 | 0.060 | 0.960 |
| DYRK3 | 0.063 | 0.979 | 1.462 | 0.040 | 0.940 |
| KRT8 | 0.053 | 0.979 | 1.645 | 0.060 | 0.960 |
| LMO4 | 0.053 | 0.979 | 1.199 | 0.020 | 0.980 |
| WBP2NL | 0.053 | 0.979 | 1.991 | 0.060 | 0.980 |
| JUNB | 0.042 | 0.979 | 1.165 | 0.020 | 0.960 |
| TSGA13 | 0.042 | 0.979 | 1.313 | 0.020 | 0.980 |
| PVRL4 | 0.042 | 0.979 | 0.899 | 0.020 | 0.920 |
| CCDC68 | 0.042 | 0.979 | 2.438 | 0.000 | 0.940 |
| BCL2 | 0.042 | 0.979 | 1.160 | 0.000 | 1.000 |
| SNRK | 0.032 | 0.979 | 4.127 | 0.020 | 0.960 |
| PSRC1 | 0.032 | 0.979 | 1.372 | 0.120 | 0.960 |
| KCNIP3 | 0.032 | 0.979 | 0.973 | 0.000 | 0.960 |
| POU4F1 | 0.032 | 0.979 | 0.992 | 0.080 | 0.940 |
| RNF32 | 0.021 | 0.979 | 1.445 | 0.040 | 0.980 |
ELISA relative absorbance at 98 percentile of controls.
Of the 26 AAbs, 13 antigens had sensitivity ≥5% and ≥98% specificity and receiver operating characteristic (ROC) analysis showed the 13 AAb classifier had an area under the curve (AUC) of 0.68 (95% confidence interval, 0.67-0.70) to distinguish BLBC from controls (Table S8). The curve was computed under leave-one-out cross-validation by varying the cutoff values in the prediction model (see Materials and Methods, Figure 3). This plasma 13-AAb panel predicted BLBC from controls at a sensitivity of 33% and a specificity of 98%. Assessment of these 13-AAb markers by demographic characteristics among controls found limited evidence of associations, with none meeting Bonferroni p value <5×10⁻⁴. The most significant relationships seen were with PPHLN1 and higher levels with younger ages at menarche (P=0.009) and RNF216 and higher levels among subjects whose BMI>30 compared to lower BMIs (P=0.008, data not shown).
Figure 3.

ROC curve of the 13-AAb classifier. 95% confidence interval was also computed (yellow).
AAb marker responses in other breast cancer subtypes
To examine the specificity of the 13 AAbs relative to other non-basal subtypes, we performed ELISA using sample set 4 comprising 30 Luminal A, 22 Luminal B, and 18 HER2-enriched patients, and compared them to BLBC. Results indicated that AAbs targeting CTAG1B, CTAG2 and TP53 were significantly higher in BLBC patients’ plasma (Figure 4; Table S9) relative to other breast cancer subtypes. Other markers showed some responses in other breast cancer subtypes including RNF216, PPHLN1, PIP4K2C, WBP2NL, DOK2, and MN1 (Table S9).
Figure 4.
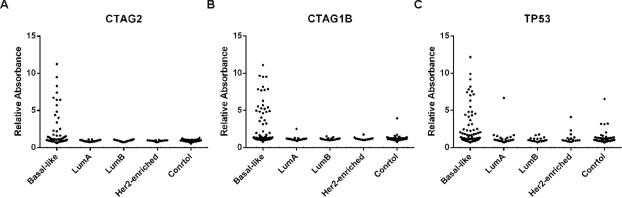
AAb responses in various breast cancer subtypes.
Immunohistochemical data on TP53 and mRNA expression for 13-AAb targets
AAbs to TP53 was one of the most significant markers associated with BLBC and because disease-specific AAbs are usually associated with presence of the corresponding antigens in the tumor tissue (33), we examined if higher protein level expression of TP53 assessed by immunohistochemistry (IHC) on tumor microarrays was associated with AAb levels. Analysis of AAb response to TP53 by IHC positive staining from 79 (54%) of BLBC, showed positive TP53 AAb responses observed in 30% (16/54) with positive TP53 IHC staining, compared with 4% (1/25) of cases with AAb responses that were negative for TP53 expression (p=0.009, Table S10). For the remaining 12 AAb biomarkers, using TCGA breast cancer data we found CTAG1B, RNF216 and PSRC1 to show significantly elevated mRNA levels in BLBC compared with other subtypes (34) (Figure S9). Other markers did not show any significant changes in mRNA expression from TCGA.
Association of AAb and survival
Survival analysis of the 13 AAb markers showed two markers associated with overall survival: TP53 and MN1 (Table S11). Among BLBC, those who displayed AAbs against TP53 protein had shorter survival than those without responses (p=0.03) (Figure S10A). Patients with AAbs against MN1 protein also presented worse survival than those without responses (p=0.04) (Figure S10B), although in multivariable models the Hazard Ratio (HR) was similar, the association was no longer statistically significant (Table S11).
Discussion
Using plasma samples from 145 patients with BLBC and equal number of age-matched controls derived from a large population-based case-control study of breast cancer, our proteomic screen of 10,000 antigens with NAPPA technology identified a 13-AAb signature that distinguishes BLBC from controls with 33% sensitivity and 98% specificity (CTAG1B, CTAG2, TP53, RNF216, PPHLN1, PIP4K2C, ZBTB16, TAS2R8, WBP2NL, DOK2, PSRC1, MN1, TRIM21). Some of these markers are likely related to overexpression of their corresponding mRNA/protein targets in BLBC themselves (TP53, CTAG1B, RNF216 and PSRC1). Our analysis also suggests AAb markers may be important to consider for prognosis/survival of BLBC patients (specifically, TP53 and MN1) and warrant further investigation in future clinical studies.
In general, the NAPPA arrays used to discover AAb responses for BLBC were highly reproducible and our 10,000-antigen panel tested about half of the proteins encoded by human genome. We did not find overall AAb responses to differ significantly between cases and controls and there was considerable variability between subjects. Our data from NAPPA arrays showed AAbs tend to develop in response to proteins with a high fraction of turns, a low fraction of helices and low aromaticity and tend to be located in the nucleus or centrosome. These biochemical properties and subcellular localization preferences hint at protein characteristics likely to be auto-immunogenic. However, a more definitive study of auto-immunogenicity at the proteome scale would require a larger sample size. It would be particularly interesting to evaluate whether such biochemical properties are specific to cancer.
Previous work on breast cancer-associated AAbs have had mixed results (17, 35-38), likely related to the fact that breast cancer encompasses multiple diseases with limited studies on specific subtypes (29). A handful of studies have evaluated blood markers for triple negative breast cancers (TNBC, defined as ER, progesterone receptor and HER2 negative through IHC analysis) (35, 38), which is a heterogeneous group that includes BLBC subtype. Among the 13 AAbs we identified to be associated with BLBC, sensitivities ranged from 6% to-21% with 98% specificity for all markers. AAbs to CTAG1B, CTAG2 and TP53 were specific to BLBC compared to other molecular subtypes. The top AAb marker we identified was CTAG1B/CTAG1A genes (the protein product known as NY-ESO-1) antigen, which has been identified in other cancer sites and first discovered in a study of esophageal cancer (39). CTAG2 AAb was the second best performer with 18.8% sensitivity at 98% specificity, and has 91% sequence homology with coding region of CTAG1B/CTAG1A. Our data are consistent with a recent small study of TNBC by Ademuyiwa et. al, in which they reported positive plasma AAb responses against NY-ESO-1 in 8 of 11 TNBC patients who had elevated tissue protein levels of NY-ESO-1(40). This observational study did not include controls or any validation.
Among the other markers we identified, data suggest these to be biologically plausible and relevant markers. For example, PPHLN1 encodes periphilin-1, which is involved in epithelial differentiation and shown to elicit AAbs in gastric and breast cancers (41). PSRC1 encodes the mitotic proline/serine rich coiled-coil protein 1 and data support the presence of its AAb in blood to indicate the transition of the precursor lesion ductal carcinoma in situ to invasive disease (11). AAbs to TRIM21, an E3 ubiquitin ligase that promotes p27 degradation, were initially associated with autoimmune rheumatic disease (42), but their appearance in cancer patients’ sera was observed in subsequent studies (43). It also participates in destabilization of TP53 protein according to a recent study (44).
Of all the AAb markers we identified, TP53 is by far the most widely studied one. In our analysis, TP53 AAbs had 12.4% sensitivity and 98% specificity for BLBC. Interestingly, AAbs against TP53 and CTAG1B proteins have also been reported in patients with tumors from other organ sites, such as ovarian cancer (14, 45, 46), colorectal cancer (33, 45, 46), and lung cancer (33, 45-47). The rare occurrence of these two AAbs in non-basal subtypes (LumA, Lum B, HER2-enriched) is encouraging for their potential use as a diagnostic tool for these aggressive breast cancers. Furthermore, the fact that multiple tumors with aggressive phenotypes also show associations with these AAbs suggests this marker might have value in detection of multiple cancers (33). This is also consistent with recent Cancer Genome Atlas (TCGA) transcriptomic profiles showing similarities between breast, ovarian and lung tumors (3).
The mechanism of AAb generation remains unclear. Possible explanations include high protein abundance in tumor tissues and mutations (33). IHC staining of TP53 and CTAG1B proteins in previous studies have shown increased tumor tissue expression in TNBC (40, 48, 49), and our IHC data in relation to AAb responses for TP53 are consistent. Using TCGA data we found CTAG1B, RNF216 and PSRC1 to show significant evidence of elevated mRNA levels in BLBC compared with other subtypes. Although other markers did not show altered mRNA levels, it is widely accepted that mRNA expression does not always predict protein levels, and future proteomic profiling could help clarify the underlying molecular underpinnings that elicit AAb responses.
Our data also suggested AAb markers may have prognostic value consistent with previous reports in other cancer studies (11, 50). In particular, we found AAbs against TP53 and MN1 proteins associated with worse survival among BLBC patients consistent with other cancer studies (33, 48). MN1 encodes meningioma 1, a probable tumor suppressor protein of unknown function. MN1 mRNA is a negative prognostic marker in acute myeloid leukemia (AML) (51) and its low protein expression is associated with better treatment response (52). Future clinical studies warrant investigation for their value as markers for prognosis or response to treatment in BLBC.
Strengths of our study include use of a large number of BLBC patient samples and age-matched controls collected within a population-based case-control study of breast cancer, with detailed data on tumor characteristics, demographics, treatment and survival. To identify AAb markers we used highly reproducible NAPPA arrays with validation in independent sample sets and validation of promising AAb markers using more clinically relevant ELISA assays. A limitation of this study is, although we screened for proteins encoded by ~50% of the human genome, these arrays do not display many proteins with post translational modifications that might also be important AAb targets for distinguishing cases from controls (53-57). Moreover, given that we performed this analysis in a case-control study with a few samples collected post-treatment, it is unclear how early these markers are present with respect to clinical diagnosis. And future studies evaluating these markers in prospective cohorts are needed.
In summary, we have performed the largest proteomic screen using NAPPA technology and identified 13 AAb biomarkers associated with BLBC. With further validation, these markers might contribute to improved detection of BLBC, an aggressive subtype that afflicts younger women where mammography is less sensitive (4-6). Our analysis of AAbs associated with BLBC represent promising markers for early detection because: 1) their sensitivity is not dependent on visualization, so young women with poorly imaged dense breasts may still benefit; and 2) blood testing can be performed repeatedly without risk of radiation exposure or expensive techniques such as MRI, making this a good approach for those who may require frequent testing. Future work in clinical and prospective observational studies is needed to determine the value of these markers for early detection, prognosis and response to treatment.
Supplementary Material
Acknowledgements
We would like to thank Michael Fiacco for maintaining blinded data. We would also like to thank Carlos Morales Betanzos for advice on preparing the figures. The PBCS would like to thank Louise Brinton, Montserrat Garcia-Closas and Mark Sherman for their efforts in launching and conducting of the study. We thank the patients and their families for taking part in this study. Samples from the Polish breast cancer study (PBCS) were collected under IRB protocol# OH99CN040.
Financial support
J. Wang, G. Wallstrom, K. Barker, J.G. Park, G. Demirkan, K.S. Anderson, J. Qiu and J. LaBaer were supported by a grant from the Early Detection Research Network (5U01CA117374-02 to J. LaBaer and K.S. Anderson). J.D. Figueroa and J. Lissowska were supported by the Intramural Research Funds of the National Cancer Institute, Department of Health and Human Services, USA (to J.D. Figueroa).
Footnotes
The authors disclose no potential conflicts of interest
References
- 1.Chen WY, Colditz GA. Risk factors and hormone-receptor status: epidemiology, risk-prediction models and treatment implications for breast cancer. Nature Clinical Practice Oncology. 2007;4:415–23. doi: 10.1038/ncponc0851. [DOI] [PubMed] [Google Scholar]
- 2.Perou CM, Sorlie T, Eisen MB, van de Rijn M, Jeffrey SS, Rees CA, et al. Molecular portraits of human breast tumours. Nature. 2000;406:747–52. doi: 10.1038/35021093. [DOI] [PubMed] [Google Scholar]
- 3.Koboldt DC, Fulton RS, McLellan MD, Schmidt H, Kalicki-Veizer J, McMichael JF, et al. Comprehensive molecular portraits of human breast tumours. Nature. 2012;490:61–70. doi: 10.1038/nature11412. [DOI] [PMC free article] [PubMed] [Google Scholar]
- 4.Domingo L, Salas D, Zubizarreta R, Bare M, Sarriugarte G, Barata T, et al. Tumor phenotype and breast density in distinct categories of interval cancer: results of population-based mammography screening in Spain. Breast Cancer Research. 2014;16:11. doi: 10.1186/bcr3595. [DOI] [PMC free article] [PubMed] [Google Scholar]
- 5.Kirsh VA, Chiarelli AM, Edwards SA, O'Malley FP, Shumak RS, Yaffe MJ, et al. Tumor Characteristics Associated With Mammographic Detection of Breast Cancer in the Ontario Breast Screening Program. Journal of the National Cancer Institute. 2011;103:942–50. doi: 10.1093/jnci/djr138. [DOI] [PubMed] [Google Scholar]
- 6.Foulkes WD, Smith IE, Reis JS. Triple-Negative Breast Cancer. New England Journal of Medicine. 2010;363:1938–48. doi: 10.1056/NEJMra1001389. [DOI] [PubMed] [Google Scholar]
- 7.Cheang MCU, Voduc D, Bajdik C, Leung S, McKinney S, Chia SK, et al. Basal-like breast cancer defined by five biomarkers has superior prognostic value then triple-negative phenotype. Clinical Cancer Research. 2008;14:1368–76. doi: 10.1158/1078-0432.CCR-07-1658. [DOI] [PubMed] [Google Scholar]
- 8.Metzger O, Tutt A, de Azambuja E, Saini KS, Viale G, Loi S, et al. Dissecting the Heterogeneity of Triple-Negative Breast Cancer. Journal of Clinical Oncology. 2012;30:1879–87. doi: 10.1200/JCO.2011.38.2010. [DOI] [PubMed] [Google Scholar]
- 9.Anderson KS, LaBaer J. The sentinel within: Exploiting the immune system for cancer biomarkers. Journal of Proteome Research. 2005;4:1123–33. doi: 10.1021/pr0500814. [DOI] [PMC free article] [PubMed] [Google Scholar]
- 10.Hanash SM, Baik CS, Kallioniemi O. Emerging molecular biomarkers-blood-based strategies to detect and monitor cancer. Nature Reviews Clinical Oncology. 2011;8:142–50. doi: 10.1038/nrclinonc.2010.220. [DOI] [PubMed] [Google Scholar]
- 11.Mange A, Lacombe J, Bascoul-Mollevi C, Jarlier M, Lamy PJ, Rouanet P, et al. Serum Autoantibody Signature of Ductal Carcinoma In Situ Progression to Invasive Breast Cancer. Clinical Cancer Research. 2012;18:1992–2000. doi: 10.1158/1078-0432.CCR-11-2527. [DOI] [PubMed] [Google Scholar]
- 12.Wang XJ, Yu JJ, Sreekumar A, Varambally S, Shen RL, Giacherio D, et al. Autoantibody signatures in prostate cancer. New England Journal of Medicine. 2005;353:1224–35. doi: 10.1056/NEJMoa051931. [DOI] [PubMed] [Google Scholar]
- 13.Qiu J, Choi G, Li L, Wang H, Pitteri SJ, Pereira-Faca SR, et al. Occurrence of Autoantibodies to Annexin I, 14-3-3 Theta and LAMR1 in Prediagnostic Lung Cancer Sera. Journal of Clinical Oncology. 2008;26:5060–6. doi: 10.1200/JCO.2008.16.2388. [DOI] [PMC free article] [PubMed] [Google Scholar]
- 14.Anderson KS, Wong J, Vitonis A, Crum CP, Sluss PM, LaBaer J, et al. p53 Autoantibodies as Potential Detection and Prognostic Biomarkers in Serous Ovarian Cancer. Cancer Epidemiology Biomarkers & Prevention. 2010;19:859–68. doi: 10.1158/1055-9965.EPI-09-0880. [DOI] [PMC free article] [PubMed] [Google Scholar]
- 15.Miersch S, Bian XF, Wallstrom G, Sibani S, Logvinenko T, Wasserfall CH, et al. Serological autoantibody profiling of type 1 diabetes by protein arrays. Journal of Proteomics. 2013;94:486–96. doi: 10.1016/j.jprot.2013.10.018. [DOI] [PubMed] [Google Scholar]
- 16.Wright C, Sibani S, Trudgian D, Fischer R, Kessler B, LaBaer J, et al. Detection of Multiple Autoantibodies in Patients with Ankylosing Spondylitis Using Nucleic Acid Programmable Protein Arrays. Molecular & Cellular Proteomics. 2012;11:10. doi: 10.1074/mcp.M9.00384. [DOI] [PMC free article] [PubMed] [Google Scholar]
- 17.Anderson KS, Sibani S, Wallstrom G, Qiu J, Mendoza EA, Raphael J, et al. Protein Microarray Signature of Autoantibody Biomarkers for the Early Detection of Breast Cancer. Journal of Proteome Research. 2011;10:85–96. doi: 10.1021/pr100686b. [DOI] [PMC free article] [PubMed] [Google Scholar]
- 18.Anderson KS, Cramer DW, Sibani S, Wallstrom G, Wong J, Park J, et al. Autoantibody Signature for the Serologic Detection of Ovarian Cancer. J Proteome Res. 2014 doi: 10.1021/pr500908n. [DOI] [PMC free article] [PubMed] [Google Scholar]
- 19.Ramachandran N, Hainsworth E, Bhullar B, Eisenstein S, Rosen B, Lau AY, et al. Self-assembling protein microarrays. Science. 2004;305:86–90. doi: 10.1126/science.1097639. [DOI] [PubMed] [Google Scholar]
- 20.Ramachandran N, Raphael JV, Hainsworth E, Demirkan G, Fuentes MG, Rolfs A, et al. Next-generation high-density self-assembling functional protein arrays. Nature Methods. 2008;5:535–8. doi: 10.1038/nmeth.1210. [DOI] [PMC free article] [PubMed] [Google Scholar]
- 21.Nielsen TO, Parker JS, Leung S, Voduc D, Ebbert M, Vickery T, et al. A Comparison of PAM50 Intrinsic Subtyping with Immunohistochemistry and Clinical Prognostic Factors in Tamoxifen-Treated Estrogen Receptor-Positive Breast Cancer. Clinical Cancer Research. 2010;16:5222–32. doi: 10.1158/1078-0432.CCR-10-1282. [DOI] [PMC free article] [PubMed] [Google Scholar]
- 22.Garcia-Closas M, Brinton LA, Lissowska J, Chatterjee N, Peplonska B, Anderson WF, et al. Established breast cancer risk factors by clinically important tumour characteristics. British Journal of Cancer. 2006;95:123–9. doi: 10.1038/sj.bjc.6603207. [DOI] [PMC free article] [PubMed] [Google Scholar]
- 23.Sherman ME, Rimm DL, Yang XHR, Chatterjee N, Brinton LA, Lissowska J, et al. Variation in breast cancer hormone receptor and HER2 levels by etiologic factors: A population-based analysis. International Journal of Cancer. 2007;121:1079–85. doi: 10.1002/ijc.22812. [DOI] [PubMed] [Google Scholar]
- 24.Yang XR, Pfeiffer RM, Garcia-Closas M, Rimm DL, Lissowska J, Brinton LA, et al. Hormonal markers in breast cancer: Coexpression, relationship with pathologic characteristics, and risk factor associations in a population-based study. Cancer Research. 2007;67:10608–17. doi: 10.1158/0008-5472.CAN-07-2142. [DOI] [PubMed] [Google Scholar]
- 25.Sun X, Sandhu R, Figueroa JD, Gierach GL, Sherman ME, Troester MA. Benign Breast Tissue Composition in Breast Cancer Patients: Association with Risk Factors, Clinical Variables, and Gene Expression. Cancer Epidemiol Biomarkers Prev. 2014 doi: 10.1158/1055-9965.EPI-14-0507. [DOI] [PMC free article] [PubMed] [Google Scholar]
- 26.Festa F, Rollins SM, Vattem K, Hathaway M, Lorenz P, Mendoza EA, et al. Robust microarray production of freshly expressed proteins in a human milieu. Proteomics Clinical Applications. 2013;7:372–7. doi: 10.1002/prca.201200063. [DOI] [PMC free article] [PubMed] [Google Scholar]
- 27.Wang J, Barker K, Steel J, Park J, Saul J, Festa F, et al. A versatile protein microarray platform enabling antibody profiling against denatured proteins. Proteomics Clinical Applications. 2013;7:378–83. doi: 10.1002/prca.201200062. [DOI] [PMC free article] [PubMed] [Google Scholar]
- 28.Montor WR, Huang J, Hu YH, Hainsworth E, Lynch S, Kronish JW, et al. Genome-Wide Study of Pseudomonas aeruginosa Outer Membrane Protein Immunogenicity Using Self-Assembling Protein Microarrays. Infection and Immunity. 2009;77:4877–86. doi: 10.1128/IAI.00698-09. [DOI] [PMC free article] [PubMed] [Google Scholar]
- 29.Wallstrom G, Anderson KS, LaBaer J. Biomarker Discovery for Heterogeneous Diseases. Cancer Epidemiology Biomarkers & Prevention. 2013;22:747–55. doi: 10.1158/1055-9965.EPI-12-1236. [DOI] [PMC free article] [PubMed] [Google Scholar]
- 30.Ramachandran N, Anderson KS, Raphael JV, Hainsworth E, Sibani S, Montor WR, et al. Tracking humoral responses using self assembling protein microarrays. Proteomics Clinical Applications. 2008;2:1518–27. doi: 10.1002/prca.200800034. [DOI] [PMC free article] [PubMed] [Google Scholar]
- 31.Kaplan EL, Meier P. NONPARAMETRIC-ESTIMATION FROM INCOMPLETE OBSERVATIONS. Journal of the American Statistical Association. 1958;53:457–81. [Google Scholar]
- 32.Cox DR. REGRESSION MODELS AND LIFE-TABLES. Journal of the Royal Statistical Society Series B-Statistical Methodology. 1972;34:187–220. [Google Scholar]
- 33.Reuschenbach M, Doeberitz MV, Wentzensen N. A systematic review of humoral immune responses against tumor antigens. Cancer Immunology Immunotherapy. 2009;58:1535–44. doi: 10.1007/s00262-009-0733-4. [DOI] [PMC free article] [PubMed] [Google Scholar]
- 34.Cline MS, Craft B, Swatloski T, Goldman M, Ma S, Haussler D, et al. Exploring TCGA Pan-Cancer data at the UCSC Cancer Genomics Browser. Sci Rep. 2013;3:2652. doi: 10.1038/srep02652. [DOI] [PMC free article] [PubMed] [Google Scholar]
- 35.Li CI, Mirus JE, Zhang YZ, Ramirez AB, Ladd JJ, Prentice RL, et al. Discovery and preliminary confirmation of novel early detection biomarkers for triple-negative breast cancer using preclinical plasma samples from the Women's Health Initiative observational study. Breast Cancer Research and Treatment. 2012;135:611–8. doi: 10.1007/s10549-012-2204-4. [DOI] [PMC free article] [PubMed] [Google Scholar]
- 36.Koziol JA, Zhang JY, Casiano CA, Peng XX, Shi FD, Feng AC, et al. Recursive partitioning as an approach to selection of immune markers for tumor diagnosis. Clinical Cancer Research. 2003;9:5120–6. [PubMed] [Google Scholar]
- 37.Lacombe J, Mange A, Jarlier M, Bascoul-Mollevi C, Rouanet P, Lamy PJ, et al. Identification and validation of new autoantibodies for the diagnosis of DCIS and node negative early-stage breast cancers. International Journal of Cancer. 2013;132:1105–13. doi: 10.1002/ijc.27766. [DOI] [PubMed] [Google Scholar]
- 38.Cabezon T, Gromova I, Gromov P, Serizawa R, Wielenga VT, Kroman N, et al. Proteomic Profiling of Triple-negative Breast Carcinomas in Combination With a Three-tier Orthogonal Technology Approach Identifies Mage-A4 as Potential Therapeutic Target in Estrogen Receptor Negative Breast Cancer. Molecular & Cellular Proteomics. 2013;12:381–94. doi: 10.1074/mcp.M112.019786. [DOI] [PMC free article] [PubMed] [Google Scholar]
- 39.Chen YT, Scanlan MJ, Sahin U, Tureci O, Gure AO, Tsang SL, et al. A testicular antigen aberrantly expressed in human cancers detected by autologous antibody screening. Proceedings of the National Academy of Sciences of the United States of America. 1997;94:1914–8. doi: 10.1073/pnas.94.5.1914. [DOI] [PMC free article] [PubMed] [Google Scholar]
- 40.Ademuyiwa FO, Bshara W, Attwood K, Morrison C, Edge SB, Ambrosone CB, et al. NY-ESO-1 Cancer Testis Antigen Demonstrates High Immunogenicity in Triple Negative Breast Cancer. Plos One. 2012;7:9. doi: 10.1371/journal.pone.0038783. [DOI] [PMC free article] [PubMed] [Google Scholar]
- 41.Line A, Stengrevics A, Slucka Z, Li G, Jankevics E, Rees RC. Serological identification and expression analysis of gastric cancer-associated genes. British Journal of Cancer. 2002;86:1824–30. doi: 10.1038/sj.bjc.6600321. [DOI] [PMC free article] [PubMed] [Google Scholar]
- 42.Ghillani P, Andre C, Toly C, Rouquette AM, Bengoufa D, Nicaise P, et al. Clinical significance of anti-Ro52 (TRIM21) antibodies non-associated with anti-SSA 60 kDa antibodies: Results of a multicentric study. Autoimmunity Reviews. 2011;10:509–13. doi: 10.1016/j.autrev.2011.03.004. [DOI] [PubMed] [Google Scholar]
- 43.Kuboshima M, Shimada H, Liu TL, Nomura F, Takiguchi M, Hiwasa T, et al. Presence of serum tripartite motif-containing 21 antibodies in patients with esophageal squamous cell carcinoma. Cancer Science. 2006;97:380–6. doi: 10.1111/j.1349-7006.2006.00192.x. [DOI] [PMC free article] [PubMed] [Google Scholar]
- 44.Reddy BA, van der Knaap JA, Bot AGM, Mohd-Sarip A, Dekkers DHW, Timmermans MA, et al. Nucleotide Biosynthetic Enzyme GMP Synthase Is a TRIM21-Controlled Relay of p53 Stabilization. Molecular Cell. 2014;53:458–70. doi: 10.1016/j.molcel.2013.12.017. [DOI] [PubMed] [Google Scholar]
- 45.Soussi T. p53 antibodies in the sera of patients with various types of cancer: A review. Cancer Research. 2000;60:1777–88. [PubMed] [Google Scholar]
- 46.Stockert E, Jager E, Chen YT, Scanlan MJ, Gout I, Karbach J, et al. A survey of the humoral immune response of cancer patients to a panel of human tumor antigens. Journal of Experimental Medicine. 1998;187:1349–54. doi: 10.1084/jem.187.8.1349. [DOI] [PMC free article] [PubMed] [Google Scholar]
- 47.Boyle P, Chapman CJ, Holdenrieder S, Murray A, Robertson C, Wood WC, et al. Clinical validation of an autoantibody test for lung cancer. Annals of Oncology. 2011;22:383–9. doi: 10.1093/annonc/mdq361. [DOI] [PMC free article] [PubMed] [Google Scholar]
- 48.Rakha EA, El-Sayed ME, Green AR, Lee AHS, Robertson JF, Ellis IO. Prognostic markers in triple-negative breast cancer. Cancer. 2007;109:25–32. doi: 10.1002/cncr.22381. [DOI] [PubMed] [Google Scholar]
- 49.Grigoriadis A, Caballero OL, Hoek KS, da Silva L, Chen YT, Shin SJ, et al. CT-X antigen expression in human breast cancer. Proceedings of the National Academy of Sciences of the United States of America. 2009;106:13493–8. doi: 10.1073/pnas.0906840106. [DOI] [PMC free article] [PubMed] [Google Scholar]
- 50.Gnjatic S, Ritter E, Buchler MW, Giese NA, Brors B, Frei C, et al. Seromic profiling of ovarian and pancreatic cancer. Proceedings of the National Academy of Sciences of the United States of America. 2010;107:5088–93. doi: 10.1073/pnas.0914213107. [DOI] [PMC free article] [PubMed] [Google Scholar]
- 51.Langer C, Marcucci G, Holland KB, Radmacher MD, Maharry K, Paschka P, et al. Prognostic Importance of MN1 Transcript Levels, and Biologic Insights From MN1-Associated Gene and MicroRNA Expression Signatures in Cytogenetically Normal Acute Myeloid Leukemia: A Cancer and Leukemia Group B Study. Journal of Clinical Oncology. 2009;27:3198–204. doi: 10.1200/JCO.2008.20.6110. [DOI] [PMC free article] [PubMed] [Google Scholar]
- 52.Schwind S, Marcucci G, Kohlschmidt J, Radmacher MD, Mrozek K, Maharry K, et al. Low expression of MN1 associates with better treatment response in older patients with de novo cytogenetically normal acute myeloid leukemia. Blood. 2011;118:4188–98. doi: 10.1182/blood-2011-06-357764. [DOI] [PMC free article] [PubMed] [Google Scholar]
- 53.Blixt O, Clo E, Nudelman AS, Sorensen KK, Clausen T, Wandall HH, et al. A High-Throughput O-Glycopeptide Discovery Platform for Seromic Profiling. Journal of Proteome Research. 2010;9:5250–61. doi: 10.1021/pr1005229. [DOI] [PMC free article] [PubMed] [Google Scholar]
- 54.Whelan SA, Lu M, He JB, Yan WH, Saxton RE, Faull KF, et al. Mass Spectrometry (LC-MS/MS) Site-Mapping of N-Glycosylated Membrane Proteins for Breast Cancer Biomarkers. Journal of Proteome Research. 2009;8:4151–60. doi: 10.1021/pr900322g. [DOI] [PMC free article] [PubMed] [Google Scholar]
- 55.Tomaino B, Cappello P, Capello M, Fredolini C, Sperduti I, Migliorini P, et al. Circulating Autoantibodies to Phosphorylated alpha-Enolase are a Hallmark of Pancreatic Cancer. Journal of Proteome Research. 2011;10:105–12. doi: 10.1021/pr100213b. [DOI] [PubMed] [Google Scholar]
- 56.Wandall HH, Blixt O, Tarp MA, Pedersen JW, Bennett EP, Mandel U, et al. Cancer Biomarkers Defined by Autoantibody Signatures to Aberrant O-Glycopeptide Epitopes. Cancer Research. 2010;70:1306–13. doi: 10.1158/0008-5472.CAN-09-2893. [DOI] [PMC free article] [PubMed] [Google Scholar]
- 57.Yu X, Woolery AR, Luong P, Hao YH, Grammel M, Westcott N, et al. Copper-catalyzed azide-alkyne cycloaddition (click chemistry)-based detection of global pathogen-host AMPylation on self-assembled human protein microarrays. Molecular & cellular proteomics : MCP. 2014;13:3164–76. doi: 10.1074/mcp.M114.041103. [DOI] [PMC free article] [PubMed] [Google Scholar]
Associated Data
This section collects any data citations, data availability statements, or supplementary materials included in this article.