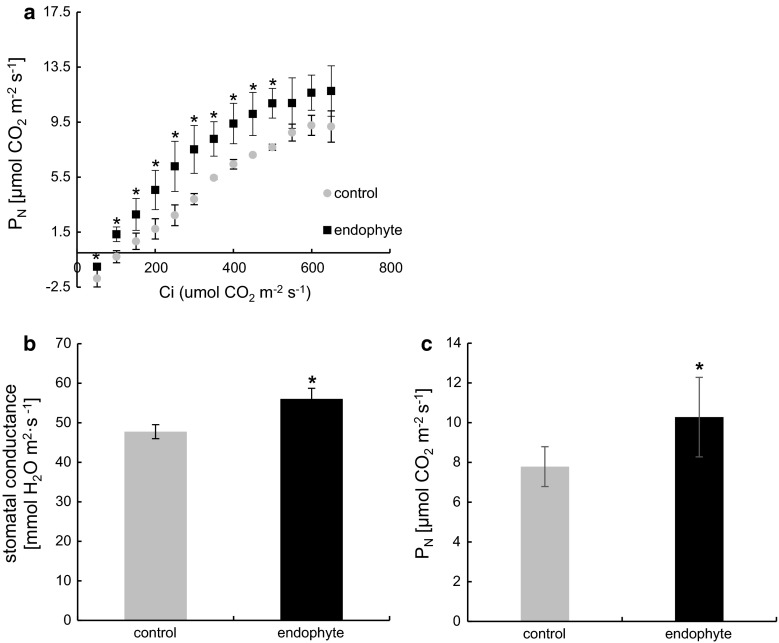
Fig. 3.
A/Ci curve (a) and stomatal conductance (b), and nett photosynthesis (c) at optimal CO2 levels of D. glomerata colonized with E. typhina—black squares and control—grey circles. Marks represent mean values from five independent measurements (n = 5 ± SD). Stars above symbols indicate statistically significant differences in relation to control at P ≤ 0.05

