Abstract
Ballistocardiography is a non-invasive measurement of the mechanical movement of the body caused by cardiac ejection of blood. Recent studies have demonstrated that ballistocardiogram (BCG) signals can be measured using a modified home weighing scale, and used to track changes in myocardial contractility and cardiac output. With this approach, the BCG can potentially be used both for preventive screening and for chronic disease management applications. However, for achieving high signal quality, subjects are required to stand still on the scale in an upright position for the measurement; the effects of intentional (for user comfort) or unintentional (due to user error) modifications in the position or posture of the subject during the measurement have not been investigated in the existing literature. In this study, we quantified the effects of different standing and seated postures on the measured BCG signals, and on the most salient BCG-derived features compared to reference standard measurements (e.g., impedance cardiography). We determined that the standing upright posture led to the least distorted signals as hypothesized, and that the correlation between BCG-derived timing interval features (R-J interval) and the pre-ejection period, PEP (measured using ICG), decreased significantly with impaired posture or sitting position. We further implemented two novel approaches to improve the PEP estimates from other standing and sitting postures, using system identification and improved J-wave detection methods. These approaches can improve the usability of standing BCG measurements in unsupervised settings (i.e. the home), by improving the robustness to non-ideal posture, as well as enabling high quality seated BCG measurements.
Index Terms: Ballistocardiogram, home monitoring, sensor informatics
I. Introduction
Home monitoring of cardiovascular health has gained a great deal of attention in the past decade. According to a report from the American Heart Association (AHA), almost 25% of all deaths in America are caused by heart disorders each year. The prevalance of heart disease is expected to rise in the coming years and 40.5% of Americans are projected to suffer from cardiovascular disorders by 2030 [1]; this would further increase the already-skyrocketing costs of healthcare, and lead to a shortage in the number of healthcare providers per patient. There is thus a compelling need to disseminate the diagnostics and screening technologies from the centralized clinic to the homes of patients for increasing the accessibility and decreasing the overall cost of care.
Two archetypal examples of clinical problems requiring improved continuous monitoring capability are heart failure (HF) and hypertension. HF is a disorder where the heart cannot supply sufficient blood to meet the demand of the tissues and organs [2], [3] —accordingly, monitoring HF patients at home would require the ability to measure cardiac output and myocardial contractility. Hypertension is defined as elevated blood pressure above 140 mmHg (systolic) and/or 90 mmHg (diastolic) [4], and would thus require the measurement of pressures. For such diseases and conditions related to the mechanical health of the heart and vasculature, there are few—if any—commercially available solutions for patients that are accurate and also convenient for serial measurements at home [5].
In the research domain, one measurement modality that has gained some interest recently for such applications is ballistocardiography: the measurement of the reactionary forces of the body to cardiac ejection of blood into the vasculature [6], [7]. The ballistocardiogram (BCG) signal has been measured using instrumented chairs [8]–[10], weighing scales [11]–[13], beds [14]–[16], and force plates [17], [18], all of which can potentially be integrated into patients’ homes. Additionally, researchers have demonstrated that the BCG signals contain clinically-relevant information regarding cardiac output (based on the rms power of the BCG [12]) and myocardial contractility (based on the R-J interval, the time delay between the electrocardiogram, ECG, R-wave and the BCG maximum peak, the J-wave [19], [20]).
In particular, our team has focused on the weighing scale form factor, which offers many potential benefits including (1) the fact that other sensors can be integrated into the same scale for multi-modal patient monitoring, (2) weighing scales are already prevalent in millions of households in the US, and (3) the sensors already inside of most electronic weighing scales are sufficiently sensitive for BCG measurement, thus reducing the potential barrier to translation into the commercial domain. Unfortunately, one disadvantage for the scale platform is that the subjects must stand still in an upright posture for the measurements. In addition to a subject accidentally slouching for a measurement, it is possible that some subjects will have reduced physical strength, and thus the measurements must be taken in a seated position instead. Studies have noted that the BCG signal can be affected by posture, using various measurement hardware such as fiber optic sensors [21], [22]. However, these postural effects have not been studied in depth.
The objective of this paper is to (1) investigate the changes in the BCG signal and derived parameters under different postures and positions, and (2) demonstrate novel methods based on our recent work [23], [24] to improve the system performance for these other postures. We hypothesize a framework for understanding BCG measurement, and the effects of subject posture/position, as summarized in Fig. 1. Specifically, we focus on improving the estimation of R-J intervals from the ECG and BCG, as a surrogate measure of contractility [19], [20], and evaluate our results based on standard measurements of the pre-ejection period (PEP) from the impedance cardiogram (ICG) signals [25]–[27].
Fig. 1.
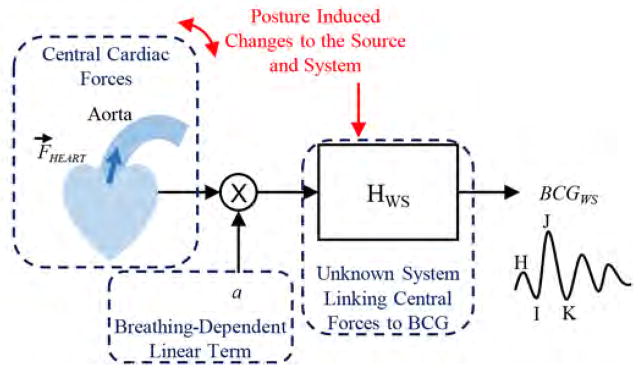
Block diagram illustrating the transfer function relating central cardiac (hemodynamic) forces to ballistocardiogram (BCG) signals measured with a modified weighing scale. The posture can both affect the source (via changes in angle) and system.
These novel methods can improve the usability of the BCG scale in unsupervised settings (i.e. the home), by improving robustness to non-ideal posture, as well as enabling high quality seated BCG measurements which would expand the available patient population.
II. Methods
A. Protocol
Data were collected from each subject in five different postures/positions, Pi, as illustrated in Fig. 2. Three standing and two seated postures were investigated. The first posture involved standing in an upright posture as delineated in previous studies [13], [19], [28], [29]. Two more standing postures were considered in which subjects were asked to stand in a slouched posture. The angle θS made by tangent to the thoracic spine (more specifically the tangent to the T2 – T4 vertebrae) with the perpendicular was measured in both positions. The last phase of the project involved two sitting positions and, in this case, both positions were specified by the angle θK made by the knee joint. Each subject was asked to keep his or her back in an upright position for the two seated postures. Thus the five postures considered in the study are specified below:
Fig. 2.
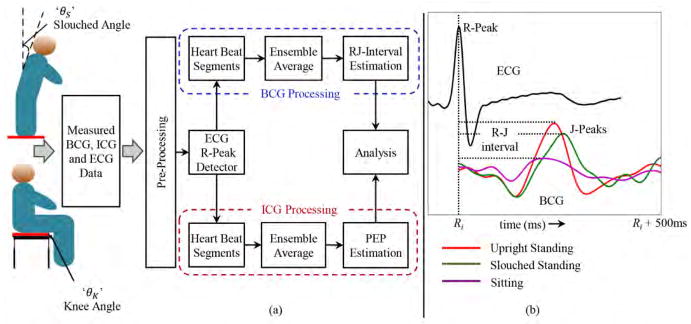
(a) Block diagram of the set up. (b) Sample waveforms for ECG and BCG in different postures. The R-peak in ECG is used as a reference point for the extraction of BCG waveforms in every heartbeat.
Posture 1 (P1): Upright standing position θS ≈ 0°.
Posture 2 (P2): Slightly slouched standing position θS = 20 ~ 40°.
Posture 3 (P3): Heavily slouched standing position where θS = 40° ~ 60°
Posture 4 (P4): Seated position where knee angle θK ≈ 90°
Posture 5 (P5): Seated position where knee angle is θK = 60° ~ 80°
The standing upright posture provides the best coupling of vertical (head-to-foot) cardiac forces to the scale as shown in previous studies [7], [11]–[13]. Postures P2 and P3 were considered since they would simply represent the user accidentally taking measurements without standing completely upright or due to back problems. P4 represented the upright sitting condition and was considered since some patients are not able to stand still on the scale. Such seated BCG measurements have been considered in the literature [11], [30], but this important comparison of signal quality and feature accuracy has not been conducted to date. Finally, the reason for including P5 in this study was to explore the increase in pressure wave reflections at the femoral bifurbication and how these reflections affect the BCG.
Data were collected from 13 subjects (12 male and one female, 26 ± 4 years, 75 ± 10 kg, 177 ± 7.7 cm height) under a protocol approved by the Georgia Institute of Technology Institutional Review Board (IRB). In postures P1 – P3, the subjects were asked to stand on the BCG weighing scale; in postures P4 and P5, the BCG scale was placed on a flat solid stool and subjects were asked to sit on the platform. The ECG and ICG data were simultaneously captured along with the BCG data. In P1 and P4, each subject was asked to breathe normally in a resting state for 30 seconds, perform a Valsalva maneuver for 15 seconds, and then remain still on the scale for 30 - 40 seconds [29], [31], [32]. In P2, P3 and P5, each subject was asked to breathe normally in a resting state for 30 - 40 seconds and no Valsalva maneuver was performed. The values of θS for slouched standing positions in the measured data for 13 subjects were θS = 35° ± 3° for P2 and θS = 52° ± 4.5° for P3. Similarly, for P5 the knee angle θK = 70° ± 3°.
B. Hardware Design
The ECG and ICG signals were measured using the BN-EL50 and BN-NICO wireless measurement modules (BIOPAC Systems, Inc., Goleta, CA), then transmitted wirelessly to the data acquisition system (MP150WSW, BIOPAC Systems, Inc., Goleta, CA) for subsequent digitization at 1 kHz. The BCG was measured using a custom analog amplifier as described in previous work [24].
C. Preliminary Data Processing
1) ECG, BCG & ICG signal processing
The ECG signal was passed through a finite impulse response (FIR) band pass filter (cut-off frequencies 2.5 - 40 Hz, Kaiser window) and the BCG and ICG signals through FIR filters (Kaiser window, cutoff frequencies 0.8 - 15 Hz for BCG and 0.8 - 35 Hz for ICG). The R-peaks, Rr (r was the peak index), in the ECG signal were automatically detected with a QRS complex detection algorithm and used as fiduciary points for segmenting the BCG data: signals in Rr +600 ms frames or “heartbeats” following each R-peak were extracted over the entire data period and aligned to form a collection or an ensemble. Let be the matrix that represented this collection for the j-th subject in posture k and each row of was denoted by and represented the l-th sample of the m-th frame/heartbeat of the BCG signal ( and , where k ∈ [1, 2, …, 5], j ∈ [1, 2, …, J], J = 13 subjects, d = 600 samples and M represented the number of heartbeats/BCG frames for a given subject j in posture k). For the ICG data, again the R-peaks Rr from the ECG were used as reference points and the ICG signals were extracted from Rr + 500 ms for each subject in each posture to form an ensemble . Let the average of all rows in each of the BCG and ICG data matrices be denoted by bold letters and , respectively.
2) Parameter Extraction
The R-J intervals and PEP were calculated for each subject in all postures. The BCG and ICG heartbeats/rows of matrices and in the resting state were partitioned into sub-ensembles of 5 second periods. All the rows from the BCG or ICG data matrix in each 5 second period were averaged to form sub-ensemble averaged waveforms. Since the 15 second post-Valsalva period was also included in the data for P1 and P4 for all subjects, the heartbeats from the post-Valsalva 15 second period were also divided into sub-ensembles.
The J-peak in the BCG ensemble averaged waveform was detected as the global peak in the first 400 ms portion of the signal. Apart from the R-J interval, the R-K and the R-I intervals were also calculated. However, the R-J interval measurement was a more consistent feature in the BCG signal and the J-wave was larger in amplitude than either the I- or the K-wave. Thus the J-peak was more easily identifiable as it was less corrupted by noise and motion artifacts. Additionally, the R-J interval had been shown in previous papers [13], [19], [29] to be correlated to the pre-ejection period both for subjects at rest and with the use of physiological perturbations.
PEP is defined as the time elapsed from the Q-point in the ECG to the B-point on the ICG signal. However, it is not always easy to detect the Q-point in the ECG and the B-point in the ICG. In our analysis, we used the R-peak in the ECG as a reference and for finding the B-point of the ICG, the ensemble averaged signal was filtered twice with a Savitzky Golay differentiator filter (21 taps) [19]. The peak of the differentiated signal was then selected as the B-point and PEP was estimated as the R-B interval.
D. Time Domain Posture-Induced Differences
To capture possible posture-induced differences in the time domain, we calculated for each subject and posture the root mean square (RMS) difference between each normalized BCG frame and its corresponding average over the entire BCG data matrix. We interpreted this difference as an “error”. The normalization was simply a scaling factor calculated for each frame that minimized this RMS error. Because of this normalization, the RMS error quantified shape distortion that could not be corrected by a scaling factor. For the m-th unnormalized BCG frame for subject j in posture k and average , the amplitude scaling factor am was calculated for each individual beat [28] by the formula
| (1) |
where R was the cross-correlation operator. The RMS error between individual beats weighted by am and the average for that posture was then calculated by
| (2) |
where l indicated the sample index. The RMS errors thus calculated by (2) for postures P2, P3, P4 and P5 for each subject were then normalized by division from the corresponding error in posture P1 for that subject. Let represented this normalized error for j-th subject in posture k and let εk represented the array of errors for all subjects in posture . The mean (μεk) and the standard deviation (σεk) of εk were calculated for all postures.
E. Frequency Domain Posture-Induced Differences
The power spectral density (PSD) was estimated using the Discrete Fourier Transform (DFT) of BCG average in each of the standing postures (P1, P2 and P3). The PSD estimates were interpolated to increase the resolution by four times. Let denoted the PSD estimate, where ‘k’ denoted the posture (k ∈ [2, 3]), j represented the subject number and f represented the frequency index. The mean and the standard deviation of PSD for f = 0 → 14 Hz were calculated for each of the standing posture for all the subjects.
F. Methods for Improved Estimation of BCG Parameters
1) System Identification
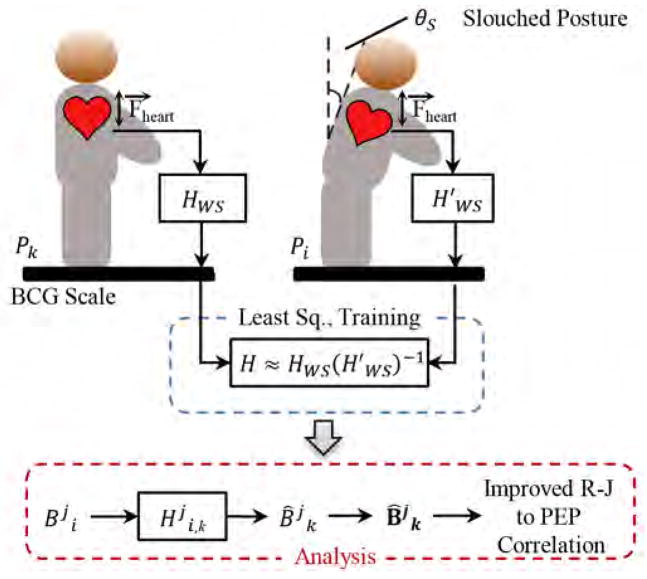
The BCG signal from the weighing scale was believed to originate from cardiac ejection of blood. Let HWS be the transfer function for the system that represented a transformation between these central cardiac forces and the corresponding BCG signal on the weighing scale in the upright standing position. Also let be the analogous functions in the slouched standing postures. The aim was to design a linear transformation that mapped the slouched standing posture BCG ensemble average to the good-posture BCG ensemble average assuming that there was no morphological change in cardiac forces between these postures, but only in the transfer function mapping these central forces to the peripheral BCG measurement site. The transformation could not be exact and hence, formed an estimator of the good posture BCG waveform, when the observation was the slouched-standing posture BCG waveform. In symbols, given , the transformation produced the optimal estimate in the form . A similar system identification approach had been demonstrated in our prior work for investigating the relationship between the wearable BCG and the weighing scale BCG [23], [24].
For every subject, two transformation functions were obtained converting the BCG signals in postures P2 and P3 to posture P1. Let denoted the transformation from any posture i to posture k for the j-th subject. Fig. 3 shows the block diagram for the design part of the transformation function and the analysis part which used these transfer functions for analyzing the improvement in estimates of BCG derived parameters. These transformation functions were obtained by training on the first 20 seconds of the BCG data using 5×2-fold cross-validation [33]. In order to obtain a transformation from posture i to posture k, the following procedure was adopted:
Fig. 3.
Block diagram of the system identification. HWS represented the transformation between heart’s mechanical action and BCG signal obtained from the scale in upright posture and in slouched standing postures. The system was trained on extracted heartbeats from postures Pi and Pk. In the analysis part, the individual beats were transformed using , obtained from design step, followed by ensemble averaging and parameter estimation.
The heartbeats in the first 20 seconds of the BCG data matrices and were randomly partitioned into two folds in each iteration of 5×2-fold cross-validation. Let u1 and u2 be ensemble averages of two folds from and v1 and v1 from .
Let u1 and v1 be the input and output data vectors for the training phase and u2 and v2 for the validation phase in one iteration of 5×2-fold cross-validation. The transformation functions were obtained by training and validation on ensemble averages.
The length of the FIR filter was determined using a sweep of filter lengths from 1 to 600 samples and number of samples before the R-peak in ECG and the values of these two parameters corresponding to the minimum error from cross validation were found.
The coefficients for the FIR filter impulse response were then determined by least-squares regression.
In general, if an input signal x is transformed in a linear system by a transfer function A, then the output signal y is given by
| (3) |
The Covariance Method [34] was used in this project for estimating the FIR filter coefficients. In the Covariance Method the matrix for linear system’s function A was composed of samples from the input data. The variable x then took the form of 1-D FIR filter coefficients. For the data variables defined earlier, the output signal y was made up of samples v1[l] and matrix A was composed of samples of the input data vector u1[l] while x had the filter coefficients , where l indicated the sample index. For a filter of order t, the explicit forms of y, x and A are given by
| (4) |
| (5) |
| (6) |
The least-squares solution x̂ to (3) that minimizes the l2-norm of error in (7) is given by the expression in (8).
| (7) |
| (8) |
In order to avoid overfitting and inaccurate components in the solution provided by (8) due to mild noise, Tikhonov regularization [35] was used to improve accuracy. This involved penalizing the residual error by a regularization term δ in (7). The least-squares solution with Tikhonov regularization is given by (9) and (10).
| (9) |
| (10) |
The least-squares solution x̂, thus formed the FIR filter coefficients and the impulse response of the transformation function . Once these subject specific transformation functions were generated in the training phase, the remaining portion of the BCG data for each subject in P2 and P3, not processed in training phase, was filtered with . The R-J intervals were then estimated from 5 second filtered sub-ensembles and correlated with PEP.
2) Modified R-J Estimation using Polynomial Fitting
The J-wave amplitude and morphology for the seated BCG signals was significantly different from the standing measurements from the same subjects. Specifically, as found in previous studies, the seated BCG amplitudes overall were much lower than for the corresponding standing measurements from the same subjects. Accordingly, to improve the noise reduction performance of the ensemble averaging, we employed weighted averaging techniques as described in [36]. Additionally, we found that the J-wave could split into two smaller peaks, and thereby lead to peak detection errors. To mitigate this problem – which was only found in the seated BCG measurements for our dataset – we devised a simple algorithm for consistent J-wave peak detection based on low order polynomial fitting. The global peak p′ in the weighted ensemble averaged BCG waveform was detected as the highest peak between 150ms and 400ms portion of the waveform. The zero-crossings before and after p′ were determined and a polynomial of order 2 was fitted across the waveform between these zero-crossings containing p′. The highest peak in the fitted waveform was then detected as the J-peak and the R-J interval was estimated as the time period between the newly detected J-peak and the ECG R-peak.
3) Statistical Analysis
In order to analyze the improvement with the above two methods, a paired t-test was conducted on absolute values of residuals of PEP from the regression line before and after the application of system identification or the polynomial fitting method. To remove the outliers in the linear model fitting the R-J interval to PEP from all subjects in the i-th posture, the data points for which either the PEP values or the R-J intervals were beyond μPEP ± 2σPEP or μR–J ± 2σR–J were removed from the analysis. This was followed by the removal of the data points for which the squared Mahalanobis distance [37] was greater than . The reason for implementing this 2-step outlier detection was that Mahalanobis distance, which finds outliers in multivariate regression, depended on the joint mean of the multivariate data and was affected by one or two erroneous points occurring at the extremes. Since the paired t-test required equal number of data points, the union set of outliers were removed from the R-J intervals and PEP data points before and after the application of improvement methods.
III. Results & Discussion
A. Time & Frequency Domain Distortion Analysis
It was observed that the mean (μεk) and the standard deviation (σεk) of the normalized error εk exhibited an increasing trend across postures indicating more shape distortion in the measured BCG for slouched standing and seated postures. The slouched postures P2 and P3 showed μεk of 0.85 and 1.1 with σεk of 0.25 and 0.5 respectively. The seated postures P4 indicated more shape distortion than standing postures (με4 = 1.7 and σε4 = 1.1) while P5 showed the most distortion (με5 = 2.5 and σε5 = 1.8). Fig. 4 shows the average PSDs and standard deviations for P1, P2 and P3 for all subjects. The plots indicated the appearance of an additional peak after the global peak in the power spectra of P2 and P3 beyond 6 Hz. The peak became more prominent in P3 indicating more distortion was present in BCG signal at higher frequencies for non-upright standing postures. These additional peaks indicated the appearance of other modes of vibration as the standing posture became more slouched. A similar effect had been observed in seated body vibrations in prior literature [38], [39].
Fig. 4.
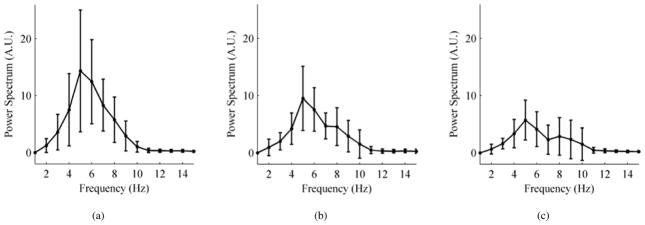
Average power spectrum with standard deviations for all subjects. (a) Upright standing posture P1. (b) Slightly slouched standing posture P2. (c) Heavily slouched standing posture P3.
B. PEP & R-J Interval Correlation
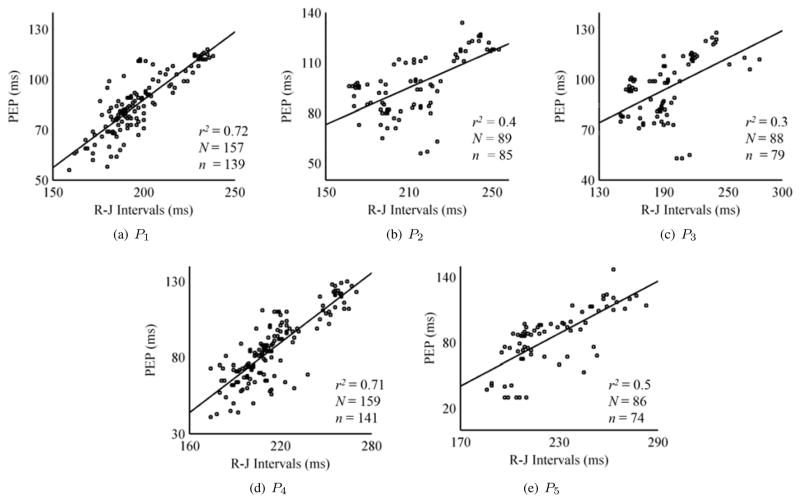
Correlation coefficients and linear regression were calculated between the R-J intervals and PEP for all subjects in each posture. Fig. 5 shows five correlation plots for all the standing and seated postures. The results corroborated the findings in [19] that standing upright posture (P1) gave the best correlation and best linear fit between PEP and the R-J intervals with a value of r2 = 0.72. The slightly slouched position P2 showed a correlation of 0.4 while the heavily slouched position indicated a degraded performance. The seated position (P4) showed the second best results (r2 = 0.71) with modified R-J estimation. The method also provided good estimation for P5. The outliers, detected by the method explained earlier, were not shown in the correlation plots.
Fig. 5.
Correlation linear regression plots for standing and seated positions. The plots for the seated BCG postures P4 and P5 involve R-J intervals estimation using polynomial fitting method.’N’ is the total number of data points obtained from all subjects in a posture in the study and ‘n’ represents the number of data points used in the correlation and regression analysis after outlier removal. The outliers were not included in analysis.
C. Improvement in Estimation of BCG Parameters
Two methods have been discussed to assess the improvement in estimation of BCG parameters. The system identification approach was used for slouched standing postures P2 and P3. The system identification method improved correlation between the R-J intervals and PEP for P2 from 0.5 to 0.74 and this increase was statistically significant (p < 0.05). However, for P3, there was no statistically significant increase in correlation as r2 went from 0.5 to 0.49 after system identification.
The polynomial fitting method was used for improved estimation of BCG parameters in the two seated postures. Since no training or testing was done in this method, all the beats of BCG and ICG data matrices in the seated postures were available for analysis. The method increased r2 for P4 from 0.5 to 0.71 (p < 0.05) but did not yield any statistically significant improvement for P5 (r2 changed from 0.43 to 0.49).
IV. Conclusion & Future Work
We have shown in several ways that posture has a significant impact on the BCG signal and on the R-J interval’s correlation with the PEP (a known clinically significant marker for heart failure). These ways include showing posture-induced differences in the BCG signals in both the time and frequency domains. The PSD of the BCG frames in slouched-standing postures indicates the existence of more than one mode of vibration of the body caused by ejection of blood. In future work, these changes in the PSD can be used to automatically differentiate changes in physiology from changes in user posture. We further demonstrated that when the posture is non-ideal, the estimation of the R-J intervals can be improved by system identification or polynomial fitting based approaches. An important limitation of this study that should be noted is the relatively small sample size of only 13 subjects. Nevertheless, the trends are observed in all subjects, and statistically significant differences are observed. Another limitation is the use of linear modeling for estimating the transfer function mapping one posture to another.
Because this paper found that postural changes affect the BCG signal morphology, future work can focus on training machine learning algorithms to automatically identify —from the measured distortion in the time or frequency domain for the BCG —that the user is standing in a non-ideal posture. This will require the collection of larger datasets, including serial measurements taken over the course of weeks or months. Furthermore, once a non-ideal posture is detected, the mapping function trained on the first day can be employed to correct for the non-ideal posture and preserve the signal quality of the measured BCG. This can potentially lead to improved long-term monitoring accuracy for BCG signals in unsupervised settings. Future work should also focus on employing non-linear modeling techniques, such as Hammerstein-Wiener models, for obtaining the transfer functions. The simple methods for improvement presented in this paper could readily be implemented in an inexpensive embedded systems platform in real-time on the scale itself, thus potentially accelerating the transition of the technology to patients’ homes.
Acknowledgments
A. D. Wiens and O. T. Inan were funded in part by the National Institute of Biomedical Imaging and Bioengineering, National Institutes of Health, through Grant Number U01 EB018818.
Biographies
Abdul Qadir Javaid received the B.S. and M.S. degrees from University of Engineering and Technology (Lahore, Pakistan) and Newcastle University (United Kingdom) in 2007 and 2008. He worked briefly in Electrical Engineering Department of National University of Computer and Emerging Sciences (Lahore, Pakistan) from 2010 to 2011. He joined Georgia Institute of Technology (Atlanta, Georgia USA) in 2011 and have been working in Smart Antenna Research Laboratory under Dr. Mary Ann Weitnauer’s supervision since Fall 2012. Mr. Javaid has been collaborating with Dr. Omer T. Inan on various projects since Summer 2014. His current research interests include biomedical devices, signal processing algorithms for bio-signals and machine learning.

Andrew Wiens (S10) received B.S. degrees in electrical engineering and computer engineering with honors from Washington University in St. Louis in 2013. He came to the Department of Electrical and Computer Engineering at Georgia Institute of Technology as a teaching assistant in digital signal processing the same year, and in 2014 he became a teaching assistant in electromagnetics. He is currently a research assistant in Dr. Omer Inan’s lab and working toward the Ph.D degree. He has been a student member of IEEE since 2010, and his current research interests include bioengineering, signal processing, machine learning, and techniques for noninvasive physiological measurements. Mr. Wiens received the Presidents Scholarship in 2013 from the Georgia Institute of Technology.
Forrest Fesmire is a 4th year electrical engineering student from Chattanooga, TN. After graduating in May 2015 he will remain at Georgia Institute of Technology and continue his education in pursuit of a Masters degree in electrical engineering.

Mary Ann Weitnauer (formerly Mary Ann Ingram) received the B.E.E. and Ph.D. degrees from the Georgia Institute of Technology (Georgia Tech), Atlanta, in 1983 and 1989, respectively. In 1989, she joined the faculty of the School of Electrical and Computer Engineering at Georgia Tech, where she is currently Professor. Her early research areas were optical communications and radar systems. In 1997, she established the Smart Antenna Research Laboratory (SARL) at Georgia Tech, which applies real and virtual array antennas to wireless networks and radar systems. She held the Georgia Tech ADVANCE Professorship for the College of Engineering from 2006–2012. She was a Visiting Professor at Aalborg University, Aalborg, Denmark in the summers of 2006–2008 and at Idaho National Labs in 2010. The SARL performs system analysis and design, channel measurement, and prototyping relating primarily to wireless local area, ad hoc and sensor networks, with focus on the lower three layers of the protocol stack. SARL has also recently developed signal processing algorithms for impulse radio ultrawideband (IR-UWB) for non-contact vital signs measurement. Dr. Weitnauer has authored or co-authored over 170 refered journal and conference papers, including four conference papers that have won Best Paper awards. Dr. Weitnauer is a Senior Member of the IEEE.
Omer T. Inan (S06, M09) received the B.S., M.S., and Ph.D. degrees in electrical engineering from Stanford University, Stanford, CA, in 2004, 2005, and 2009, respectively.
He joined ALZA Corporation (A Johnson and Johnson Company) in 2006 as an Engineering Intern in the Drug Device Research and Development Group, where he designed micropower, high efficiency circuits for iontophoretic drug delivery, and researched options for closed-loop drug delivery systems. In 2007, he joined Countryman Associates, Inc., Menlo Park, CA where he was Chief Engineer, involved in designing and developing high-end professional audio circuits and systems. From 2009–2013, he was also a Visiting Scholar in the Department of Electrical Engineering, Stanford University. Since 2013, Dr. Inan is an Assistant Professor of Electrical and Computer Engineering, and Program Faculty in the Interdisciplinary Bioengineering Graduate Program, at the Georgia Institute of Technology. His research interests focus on non-invasive physiologic monitoring for human health and performance, and applying novel sensing systems to chronic disease management and pediatric care.
Dr. Inan is an Associate Editor of the IEEE Journal of Biomedical and Health Informatics, Associate Editor for the IEEE Engineering in Medicine and Biology Conference, Member of the IEEE Technical Committee on Translational Engineering for Healthcare Innovation, and Technical Program Committee Member or Track Chair for several other major international biomedical engineering conferences. He has published 40 technical articles in peer-reviewed international journals and conferences, and has two issued and three pending patents. Dr. Inan received the Gerald J. Lieberman Fellowship (Stanford University) in 2008-’09 for outstanding scholarship, teaching and service. He is a Three-Time National Collegiate Athletic Association All-American in the discus throw, and a former co-captain of the Stanford University Track and Field Team.
Contributor Information
Abdul Q. Javaid, Email: aqjavaid@gatech.edu, School of Electrical and Computer Engineering, Georgia Institute of Technology, Atlanta, GA, 30332 USA.
Andrew D. Wiens, Email: andrew.wiens@gatech.edu, School of Electrical and Computer Engineering, Georgia Institute of Technology, Atlanta, GA, 30332 USA.
N. Forrest Fesmire, Email: forrest.fesmire@gmail.com, School of Electrical and Computer Engineering, Georgia Institute of Technology, Atlanta, GA, 30332 USA.
Mary A. Weitnauer, Email: maweit@gatech.edu, School of Electrical and Computer Engineering, Georgia Institute of Technology, Atlanta, GA, 30332 USA.
Omer T. Inan, Email: inan@gatech.edu, School of Electrical and Computer Engineering, Georgia Institute of Technology, Atlanta, GA, 30332 USA.
References
- 1.Heidenreich PA, Trogdon JG, Khavjou OA, Butler J, Dracup K, Ezekowitz MD, Finkelstein EA, Hong Y, Johnston SC, Khera A, et al. Forecasting the future of cardiovascular disease in the united states a policy statement from the american heart association. Circulation. 2011;123(8):933–944. doi: 10.1161/CIR.0b013e31820a55f5. [DOI] [PubMed] [Google Scholar]
- 2.Davis JO. The physiology of congestive heart failure. Handbook of physiology. 1965;3:2071–122. [Google Scholar]
- 3.Berne RM, Levy MN. Cardiovascular Physiology. 7. Mosby-Year Book; 1997. [Google Scholar]
- 4.Hall JE, Granger JP, Carmo JM, Silva AA, Dubinion J, George E, Hamza S, Speed J, Hall ME. Hypertension: physiology and pathophysiology. Comprehensive Physiology. 2012 doi: 10.1002/cphy.c110058. [DOI] [PubMed] [Google Scholar]
- 5.Kim J-M, Hong J-H, Cho M-C, Cha E-J, Lee T-S. Wireless biomedical signal monitoring device on wheelchair using noncontact electro-mechanical film sensor. Engineering in Medicine and Biology Society, 2007. EMBS 2007. 29th Annual International Conference of the IEEE; Aug 2007; pp. 574–577. [DOI] [PubMed] [Google Scholar]
- 6.Starr I, Schroeder HA. Ballistocardiogram. ii. normal standards, abnormalities commonly found in diseases of the heart and circulation, and their significance. Journal of Clinical Investigation. 1940;19(3):437. doi: 10.1172/JCI101145. [DOI] [PMC free article] [PubMed] [Google Scholar]
- 7.Inan OT, Migeotte PF, Park KS, Etemadi M, Tavakolian K, Casanella R, Zanetti J, Tank J, Funtova I, Prisk GK, Di Rienzo M. Ballistocardiography and seismocardiography: A review of recent advances. Biomedical and Health Informatics, IEEE Journal of. 2014;PP(99):1–1. doi: 10.1109/JBHI.2014.2361732. [DOI] [PubMed] [Google Scholar]
- 8.Koivistoinen T, Junnila S, Varri A, Koobi T. A new method for measuring the ballistocardiogram using emfi sensors in a normal chair. Engineering in Medicine and Biology Society, 2004. IEMBS‘04. 26th Annual International Conference of the IEEE; Sept 2004; pp. 2026–2029. [DOI] [PubMed] [Google Scholar]
- 9.Baek HJ, Chung GS, Kim KK, Park KS. A smart health monitoring chair for nonintrusive measurement of biological signals. Information Technology in Biomedicine, IEEE Transactions on. 2012 Jan;16(1):150–158. doi: 10.1109/TITB.2011.2175742. [DOI] [PubMed] [Google Scholar]
- 10.Dziuda L, Skibniewski F, Krej M, Lewandowski J. Monitoring respiration and cardiac activity using fiber bragg grating-based sensor. Biomedical Engineering, IEEE Transactions on. 2012 Jul;59(7):1934–1942. doi: 10.1109/TBME.2012.2194145. [DOI] [PubMed] [Google Scholar]
- 11.Inan OT, Etemadi M, Wiard RM, Giovangrandi L, Kovacs GTA. Robust ballistocardiogram acquisition for home monitoring. Physiological measurement. 2009;30(2):169. doi: 10.1088/0967-3334/30/2/005. [DOI] [PubMed] [Google Scholar]
- 12.Inan OT, Etemadi M, Paloma A, Giovangrandi L, Kovacs GTA. Non-invasive cardiac output trending during exercise recovery on a bathroom-scale-based ballistocardiograph. Physiological measurement. 2009;30(3):261. doi: 10.1088/0967-3334/30/3/003. [DOI] [PubMed] [Google Scholar]
- 13.Gonzlez-Landaeta R, Casas O, Palls-Areny R. Heart rate detection from an electronic weighing scale. Physiological Measurement. 2008;29(8):979. doi: 10.1088/0967-3334/29/8/009. [DOI] [PubMed] [Google Scholar]
- 14.Bruser C, Stadlthanner K, de Waele S, Leonhardt S. Adaptive beat-to-beat heart rate estimation in ballistocardiograms. Information Technology in Biomedicine, IEEE Transactions on. 2011 Sep;15(5):778–786. doi: 10.1109/TITB.2011.2128337. [DOI] [PubMed] [Google Scholar]
- 15.Shin JH, Chee YJ, Jeong DU, Park KS. Nonconstrained sleep monitoring system and algorithms using air-mattress with balancing tube method. Information Technology in Biomedicine, IEEE Transactions on. 2010 Jan;14(1):147–156. doi: 10.1109/TITB.2009.2034011. [DOI] [PubMed] [Google Scholar]
- 16.Mack D, Mack D, Patrie J, Suratt P, Felder R, Alwan M. Development and preliminary validation of heart rate and breathing rate detection using a passive, ballistocardiography-based sleep monitoring system. Information Technology in Biomedicine, IEEE Transactions on. 2009 Jan;13(1):111–120. doi: 10.1109/TITB.2008.2007194. [DOI] [PubMed] [Google Scholar]
- 17.Yamakoshi K, Kuroda M, Tanaka S, Yamaguchi I, Kawarada A. Non-conscious and automatic acquisition of body and excreta weight together with ballistocardiogram in a lavatory. Engineering in Medicine and Biology Society, 1996. Bridging Disciplines for Biomedicine. Proceedings of the 18th Annual International Conference of the IEEE; Oct 1996; pp. 67–68. [Google Scholar]
- 18.Tavakolian K, Ngai B, Blaber A, Kaminska B. Infrasonic cardiac signals: Complementary windows to cardiovascular dynamics. Engineering in Medicine and Biology Society, EMBC, 2011 Annual International Conference of the IEEE; Aug 2011; pp. 4275–4278. [DOI] [PubMed] [Google Scholar]
- 19.Etemadi M, Inan OT, Giovangrandi L, Kovacs GT. Rapid assessment of cardiac contractility on a home bathroom scale. Information Technology in Biomedicine, IEEE Transactions on. 2011;15(6):864–869. doi: 10.1109/TITB.2011.2161998. [DOI] [PubMed] [Google Scholar]
- 20.Lindqvist A, Pihlajamäki K, Jalonen J, Laaksonen V, Alihanka J. Static-charge-sensitive bed ballistocardiography in cardiovascular monitoring. Clinical Physiology. 1996;16(1):23–30. doi: 10.1111/j.1475-097x.1996.tb00553.x. [DOI] [PubMed] [Google Scholar]
- 21.Dziuda Ł, Skibniewski FW. A new approach to ballistocardiographic measurements using fibre bragg grating-based sensors. Biocybernetics and Biomedical Engineering. 2014;34(2):101–116. [Google Scholar]
- 22.Krej M, Dziuda L, Skibniewski F. A method of detecting heartbeat locations in the ballistocardiographic signal from the fiber-optic vital signs sensor. Biomedical and Health Informatics, IEEE Journal of. 2015;PP(99):1–1. doi: 10.1109/JBHI.2015.2392796. [DOI] [PubMed] [Google Scholar]
- 23.Wiens AD, Inan OT. A novel system identification technique for improved wearable hemodynamics assessment. Biomedical Engineering, IEEE Transactions on. doi: 10.1109/TBME.2014.2387354. in Press. [DOI] [PMC free article] [PubMed] [Google Scholar]
- 24.Wiens A, Etemadi M, Roy S, Klein L, Inan O. Towards continuous, non-invasive assessment of ventricular function and hemodynamics: Wearable ballistocardiography. Biomedical and Health Informatics, IEEE Journal of. doi: 10.1109/JBHI.2014.2359937. in Press. [DOI] [PMC free article] [PubMed] [Google Scholar]
- 25.Allen MT, Fahrenberg J, Kelsey RM, Lovallo WR, Doornen LJ, et al. Methodological guidelines for impedance cardiography. Psychophysiology. 1990;27(1):1–23. doi: 10.1111/j.1469-8986.1990.tb02171.x. [DOI] [PubMed] [Google Scholar]
- 26.Critchley L. Impedance cardiography: The impact of new technology. Anaesthesia. 1998;53(7):677–684. doi: 10.1046/j.1365-2044.1998.437-az0550.x. [DOI] [PubMed] [Google Scholar]
- 27.Sherwood A, Chair, Allen MT, Fahrenberg J, Kelsey RM, Lovallo WR, van Doornen LJ. Methodological guidelines for impedance cardiography. Psychophysiology. 1990;27(1):1–23. doi: 10.1111/j.1469-8986.1990.tb02171.x. [DOI] [PubMed] [Google Scholar]
- 28.Inan OT, Etemadi M, Wiard RM, Kovacs GT, Giovangrandi L. Novel methods for estimating the ballistocardiogram signal using a simultaneously acquired electrocardiogram. Engineering in Medicine and Biology Society, 2009. EMBC 2009. Annual International Conference of the IEEE; IEEE; 2009. pp. 5334–5347. [DOI] [PubMed] [Google Scholar]
- 29.Inan OT, Etemadi M, Wiard RM, Kovacs GTA, Giovangrandi L. Non-invasive measurement of valsalva-induced hemodynamic changes on a bathroom scale ballistocardiograph. Engineering in Medicine and Biology Society, 2008. EMBS 2008. 30th Annual International Conference of the IEEE; Aug 2008; pp. 674–677. [DOI] [PubMed] [Google Scholar]
- 30.Pinheiro E, Postolache O, Girão P. Study on ballistocardiogram acquisition in a moving wheelchair with embedded sensors. Metrology and Measurement Systems. 2012;19(4):739–750. [Google Scholar]
- 31.Ermishkin V, Lukoshkova E, Bersenev E-Y, Saidova M, Shitov V, Vinogradova O, Khayutin V. Beat-by-beat changes in pre-ejection period during functional tests evaluated by impedance aortography: a step to a left ventricular contractility monitoring. 13th International Conference on Electrical Bioimpedance and the 8th Conference on Electrical Impedance Tomography; Springer; 2007. pp. 655–658. [Google Scholar]
- 32.Greenfield JC, Cox RL, Hernandez RR, Thomas C, Schoonmaker FW. Pressure-flow studies in man during the valsalva maneuver with observations on the mechanical properties of the ascending aorta. Circulation. 1967;35(4):653–661. doi: 10.1161/01.cir.35.4.653. [DOI] [PubMed] [Google Scholar]
- 33.Stone M. Cross-validatory choice and assessment of statistical predictions. Journal of the Royal Statistical Society. Series B (Methodological) 1974:111–147. [Google Scholar]
- 34.Moon TK, Stirling WC. Mathematical methods and algorithms for signal processing. Vol. 1 Prentice hall; New York: 2000. [Google Scholar]
- 35.Tihonov AN. Solution of incorrectly formulated problems and the regularization method. Sov Math Dokl. 1963;4:1035–1038. [Google Scholar]
- 36.Sörnmo L, Laguna P. Bioelectrical signal processing in cardiac and neurological applications. Academic Press; 2005. [Google Scholar]
- 37.Hodge VJ, Austin J. A survey of outlier detection methodologies. Artificial Intelligence Review. 2004;22(2):85–126. [Google Scholar]
- 38.Kitazaki S, Griffin MJ. Resonance behaviour of the seated human body and effects of posture. Journal of Biomechanics. 1997;31(2):143–149. doi: 10.1016/s0021-9290(97)00126-7. [DOI] [PubMed] [Google Scholar]
- 39.Matsumoto Y, Griffin M. Dynamic response of the standing human body exposed to vertical vibration: influence of posture and vibration magnitude. Journal of Sound and Vibration. 1998;212(1):85–107. [Google Scholar]


