

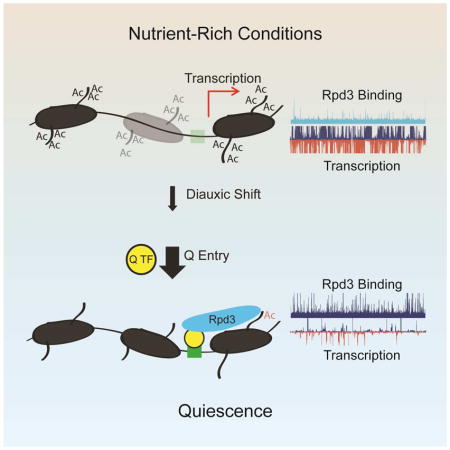
Summary
Quiescence is a conserved cell-cycle state characterized by cell cycle arrest, increased stress resistance, enhanced longevity, and decreased transcriptional, translational, and metabolic output. Although quiescence plays essential roles in cell survival and normal differentiation, the molecular mechanisms leading to this state are not well understood. Here, we determined changes in the transcriptome and chromatin structure of S. cerevisiae upon quiescence entry. Our analyses revealed transcriptional shutoff that is far more robust than previously believed and an unprecedented global chromatin transition, which are tightly correlated. These changes require Rpd3 lysine deacetylase targeting to at least half of gene promoters via quiescence-specific transcription factors including Xbp1 and Stb3. Deletion of RPD3 prevents cells from establishing transcriptional quiescence, leading to defects in quiescence entry and shortening of chronological lifespan. Our results define a molecular mechanism for global reprogramming of transcriptome and chromatin structure for quiescence driven by a highly conserved chromatin regulator.
Graphical Abstract
Introduction
The quiescent state is a ubiquitous cell cycle stage among eukaryotes, which is generally characterized by reversible cell cycle arrest with G1 DNA content, reduced cell size, increased stress tolerance, reduced translational and transcriptional output, induction of autophagy, and increased longevity (Valcourt et al., 2012). Quiescent yeast cells (Q cells) exhibit all of these characteristics and serve as a model for chronological aging (Li et al., 2009). The existence of a true quiescent state in yeast has been debated, since it has been argued that few clear characteristics distinguish slowly-growing cells in G1 from those in the quiescent state (Brauer et al., 2008; Coller, 2011; Klosinska et al., 2011). For this reason, slowly growing yeast, starved non-dividing yeast, stationary phase cultures, yeast undergoing diauxic shift, and purified Q cells are often described as highly similar or synonymous entities (Galdieri et al., 2010). Until recently, quiescence studies in S. cerevisiae were confounded by the presence of a mixed population of cells with distinct morphologies and characteristics in stationary phase yeast cultures. A density-based technique to separate the stress-tolerant, long-lived, homogenous quiescent population (Q cells) from their nonquiescent counterparts has been established (Allen et al., 2006) and has provided a powerful tool for characterizing quiescent yeast cells (Aragon et al., 2008; Li et al., 2013; Miles et al., 2013). However, the molecular basis for transcriptional shutoff accompanying quiescence entry has remained largely unknown.
In eukaryotic organisms, DNA is tightly packaged into chromatin, which is comprised of repeating units of DNA-wrapped histone octamers known as nucleosomes (Kornberg and Thomas, 1974). These structures are intrinsically inhibitory, as their presence occludes the underlying DNA sequence from DNA-dependent processes such as transcription factor binding, replication, transcription, and DNA repair. Therefore, regulation of the location and occupancy of nucleosomes in the context of DNA is critical to the faithful execution of any DNA-dependent process. Chromatin is highly dynamic, with conserved regulators controlling the position, occupancy, and chemical modification state of the nucleosome units (Hughes and Rando, 2014; Rando, 2012). Because the chromatin state profoundly affects the accessibility of trans-acting factors to the genome, chromatin regulators have been hypothesized to play integral roles in transcriptional reprogramming upon entry into quiescence, and have recently been computationally implicated in the regulation of yeast quiescence (Reimand et al., 2012).
Here, we provide a comprehensive genome-wide characterization of major chromatin transitions and transcriptional reprogramming associated with quiescence entry in S. cerevisiae. Using normalized, strand-specific, high throughput RNA sequencing, we find that global transcriptional shutoff occurs only after entry into quiescence to a degree much more wide-spread and robust than previously believed. These transcriptional changes are associated with global nucleosome repositioning, increased histone occupancy, and deacetylation at promoters, reflecting a chromatin state in Q cells that is highly distinct from cells undergoing logarithmic growth in nutrient rich conditions or at the diauxic shift. Furthermore, we identify Rpd3, a conserved lysine deacetylase, as a key regulator of quiescence entry and maintenance, and demonstrate that it targets at least half of all genes via transcriptional repressors. We propose Rpd3 targeting causes the global chromatin changes and transcriptional shutoff that are necessary for quiescence entry.
Results
Transcription is Globally Repressed in Quiescent Yeast
To elucidate the mechanisms of quiescence entry, we first sought to determine the extent of transcriptional repression associated with the transition from logarithmic growth through the diauxic shift and into the quiescent state in S. cerevisiae. To this end, we performed strand-specific RNA sequencing. RNA was harvested from cells in nutrient-rich media (log cells), 2 hours after glucose was no longer detectable in the media (diauxic shift, or DS cells), or from quiescent cells isolated from 7-day stationary phase cultures (Allen et al., 2006) (Q cells) (Figure 1A). Because we anticipated large-scale changes in transcription during the process of quiescence entry, we incorporated external spike-in controls to account for global changes in transcript abundance at distinct cell cycle stages. Similar to previous experiments with microarrays (Radonjic et al., 2005), transcript abundance was scaled to reflect the RNA content per cell. As we anticipated, the use of spike-in controls was essential to accurately capture the magnitude of changes in transcriptional program (Figure S1A, B). Our analyses revealed that distinct transcriptional reprogramming occurs during both the switch from log to DS and from DS to Q, with an initial up-regulation of stress response genes and suppression of genes involved in translation and metabolite biogenesis at the DS as previously observed (DeRisi et al., 1997), followed by extensive global repression of transcripts not associated with the stress response (Figure 1A–E, Table S1). Mean transcript abundance was reduced roughly 2-fold in DS cells, including a precipitous 30-fold drop in ribosomal protein mRNA, consistent with inactivation of the TOR pathway (DeRisi et al., 1997; Schmelzle and Hall, 2000) (Figure 1A–C). Purified Q cells have a much more extensive transcriptional shutoff, with mean global mRNA levels repressed roughly 30-fold compared to log cells and 15-fold compared to DS cells (Figure 1A, B, D, E). This means that, aside from ribosomal protein genes, a much more robust global transcriptional shutoff takes place between the DS and Q than between log and DS. Global transcriptional repression in Q cells is likely due to prevention of transcriptional initiation, as both RNA polymerase II (Pol II) binding and preinitiation complex (PIC) formation are significantly reduced in Q cells relative to log and DS (Figure S1C), and Pol II binding and PIC formation correlate with changes in transcription (Figure S1D–F). These results suggest critical genome-scale transcriptional reprogramming events occur downstream of nutrient limitation, and provide supporting evidence that the DS and Q states are very distinct cell-cycle states.
Figure 1. Global Transcriptional Shutoff Accompanies Quiescence Entry.

(A) Boxplot of transcript abundance for all genes (left) or ribosomal protein genes (right) during logarithmic growth in rich media (log), 2 hours after glucose exhaustion (DS), or purified quiescent cells from a 7 day culture (Q).
(B) Browser shot of strand-specific, normalized transcript abundance across chromosome III. Blue indicates Watson strand and red indicates Crick strand.
(C–E). Scatter plots comparing normalized transcript abundance between indicated cell cycle stages. Yellow dots indicate ribosomal protein transcripts. Red diagonal line indicates y=x axis to represent where expected transcript distribution should occur in absence of global transcription changes. Normalized FPKM denotes fragments per kilobase of exon per million fragments mapped determined by Cufflinks and scaled to normalize for standard-corrected RNA per cell.
Chromatin in Quiescent Yeast is Repressive
To understand how global transcriptional repression could be achieved, we first defined the general chromatin structure in log and Q cells using paired-end sequencing of micrococcal nuclease (MNase)-digested chromatin. Strikingly, we observed globally increased nucleosome dyad signal in the nucleosome depleted region (NDR) upstream of transcription start sites (TSSs) in Q cells (Figure 2A). This difference was not due to differences in MNase digestion, as the extents of digestion were identical for both log and Q cells (Figure S2A). Nucleosomes hyper-sensitive to MNase around NDRs in log cells can be identified using lightly digested chromatin (Weiner et al., 2010). Comparison of nucleosome signals obtained from light and extensive MNase digests demonstrates that NDRs are much more resistant to MNase digestion in Q cells, suggesting that genome-wide stabilization of promoter nucleosomes accompanies Q entry (Figure 2B, C). Consistent with repressive chromatin, we observed significant shifting of the −1 and +1 nucleosomes toward TSSs (Figure 2D and Figure S2B). Histone acetylation is generally thought to reflect transcriptional status, with high acetylation associated with transcribed regions and hypoacetylation corresponding to more repressed regions (Grunstein, 1997). We find that a global reduction in histone acetylation occurs after Q entry, when maximum transcriptional repression is observed (Figure 2E), as reported for mixed populations of stationary phase yeast (Mews et al., 2014). Together, the global changes in chromatin structure are consistent with the genome-wide transcriptional shutdown we observe above (Figure 1).
Figure 2. Global Changes in Chromatin Reflect Transciptional Repression in Q Cells.

(A) Nucleosome dyad signal aligned at 4550 transcription start sites (TSS) (Nagalakshmi et al., 2008) for matched MNase digests from Q and log cells.
(B, C) Nucleosome dyad signal for two different digestion levels in log cells (B) or Q cells (C) at TSS. Corresponding MNase digestion ladders are shown in Figure S2A.
(D) Individual nucleosome dyad signal aligned at TSS, and sorted by increase and decrease in dyad signal at nucleosome depleted regions (NDR) as cells transition from log growth (left) to quiescence (right).
(E) Western Blot using antibodies against acetylated histone tails as indicated in log, DS, or Q cells. Total H3 was used as a loading control.
See also Figure S2
Transcriptional Repression and Repressive Chromatin Structure are Strongly Correlated
To further examine the link between chromatin structure and transcriptional repression, we analyzed nucleosome signals, histone density, and histone acetylation levels at genes that are most differentially expressed between log and Q cells (Figure 3A–C). Genes that were most repressed from log-to-Q have promoters that are highly insensitive to MNase digestion with a large increase in H3 density and significant hypoacetylation, particularly into the coding region, in Q cells. These same genes exhibit extreme MNase sensitivity, low H3 occupancy, and hyperacetylation in log cells (Figure 3A and S3A). Conversely, genes that are induced or largely unaffected from log-to-Q, enriched for stress-response genes, are hyperacetylated with lower H3 density in Q cells but have low MNase sensitivity, higher histone occupancy, and low acetylation levels in log cells (Figure 3B and S3B). The difference in chromatin structure between the most and least repressed transcripts in Q cells thus has opposite trends in log cells and Q cells (Figure 3C), showing a strong link between transcriptional repression and repressive chromatin structure. The genome-wide correlations for H3 density change with log-to-Q transcription change and promoter acetylation change with log-to-Q transcription change are very strong (r=0.6 and r=0.7, respectively), further suggesting that chromatin structural changes and transcriptional shutoff in Q cells are intimately linked (Figure 3D, E). Furthermore, distinct changes in transcription start site (TSS) acetylation accompany the transitions from log to DS and from DS to Q (Figure S3C, D), supporting the existence of critical molecular events occurring after the DS.
Figure 3. Tight Correlations Between Chromatin Transition and Transcriptional Shutoff.

(A) Nucleosome dyad signal (left), histone H3 density (center), and hyperacetylated H4 signals (right) in log or Q cells at TSSs for top 500 genes most repressed in Q cells. Dyad signal is from 80% mononucleosome data set, H3 signal is first Z-score normalized, and H4 hyperacetylation signal is corrected for histone density. H3K23 acetylation profiles are show in Figure S3A and S3B.
(B) Same as (A) but for the 500 least repressed (or induced) transcripts in Q cells.
(C) The changes in signals between most and least repressed genes upon Q entry.
(D) Correlation between changes in H3 occupancy (from ChIP-Seq) and changes in transcription between Q and log cells (left). Heat map of changed H3 signals (Q/log, normalized to input), sorted by changes in transcription between Q and log cells (right).
(E) Same as (D) but for changes in H3-normalized, hyperacetylated H4ac levels.
(F–H) Changes in MNase dyad signals (F, from 50% mononucleosome digest), H3 occupancy (G), or H4 hyperacetylation (H) at 166 transcription factor motifs from the JASPAR database (Mathelier et al., 2014) (see Supplemental Experimental Procedures) sorted by difference in signals. Green bars indicate motifs within indicated cluster corresponding to transcription factor with known interactions with Rpd3 (from BioGRID database: http://thebiogrid.org). Transcription factor identity and expanded Rpd3 interaction motifs are shown in Figure S3E–G.
See also Figure S3
We next sought to identify transcription factors (TFs) that play key roles in the reprograming of transcription and chromatin structure upon Q entry. We hypothesized that if a TF plays a key role in transcriptional regulation upon Q entry, chromatin structure around its binding sites would exhibit significantly more robust changes upon Q entry compared to loci where transcription is changed as a consequence of indirect effects. To test this, we characterized chromatin structure at predicted TF binding motifs in intergenic regions (Figure 3F–H, Figure S3E–G). While this computational strategy is limited because it is based solely on the presence of a motif and not TF binding data, which is lacking in Q cells, we were able to identify many candidate TF motifs with large changes in local chromatin structure. Motifs associated with TFs involved in transcriptional repression, such as Stb3, Dot6, Tod6, and Xbp1 (Huber et al., 2011; Miles et al., 2013), as well as motifs associated with TFs inactivated by nutrient exhaustion, such as Sfp1 (Marion et al., 2004) have more repressive chromatin structure (nucleosomes positioned over TF motif, higher H3 density, and low levels of acetylation) in Q cells. Similarly, motifs for transcriptional activators that function in stress conditions, such as Msn2/Msn4, Gis1 and Snt2 (Baker et al., 2013; Galdieri et al., 2010), are surrounded by more open chromatin structure in Q cells.
Importantly, a large fraction of TFs whose binding motifs are surrounded by the most dramatic changes in chromatin structure are implicated to function, at least partially, through recruitment of the Rpd3 lysine deacetylase (Figure 3F–H green bars, Figure S3E–G). Rpd3 represses transcription through histone deacetylation (Kadosh and Struhl, 1998), can stabilize promoter nucleosomes (Chen et al., 2012) and has been implicated in stress response (Alejandro-Osorio et al., 2009; Weiner et al., 2012), and repression of ribosome biogenesis genes upon inactivation of TOR signaling (Huber et al., 2011; Humphrey et al., 2004; Rohde and Cardenas, 2003). In addition, Rpd3 is predicted to play roles in quiescence through genetic and computational analyses (Reimand et al., 2012). Because these properties are consistent with chromatin changes in Q cells, we next sought to elucidate the role of Rpd3 in quiescence.
Rpd3 is Required for Quiescence Entry and Survival
To determine the contribution of Rpd3 to yeast quiescence, we first created Δrpd3 mutants in the prototrophic background and cultured for 7 days. No dramatic difference in cell growth was observed over a two day time course, suggesting that deletion of Rpd3 does not severely affect yeast in log phase or early stages after the DS, and Δrpd3 cells arrested with a G1 DNA content after glucose exhaustion similarly to wild type (WT) cells (Figure S4A and S4B). After 7 days, while WT cells produce roughly 60% Q cells in stationary cultures, deletion of Rpd3 resulted in significantly fewer cells (~10%) with Q morphology and a substantial fraction of large, amorphous cells with irregular or lysed cell walls and cell debris (Figure 4A). Viability of both WT and Δrpd3 remained high through log, DS, and after 48 hours of growth into early stationary phase (Figure 4B). However, there was a significant decrease in Δrpd3 cell viability after 7 days in culture, suggesting that the low Q cell yield after 7 days is likely due to cell death during and/or after Q entry. These results show that Rpd3 has a pivotal role in entry into quiescence and/or maintaining viability, a critical property of Q cells.
Figure 4. Rpd3 is Required for Quiescence Entry and Survival.

(A) Representative image of WT (left) and Δrpd3 (right) stationary phase cultures after 7 days of growth prior to Q cell isolation, depicting distinct culture morphologies.
(B) Growth analysis of WT and Δrpd3 cells through 48 hours in YPD. Arrows indicate time of glucose exhaustion.
(C) Viability assay showing cell survival as cells enter the Q state in WT and Δrpd3 cells.
(D) Representative image of Q cells purified from 7-day stationary phase cultures indicating similar gross morphology.
(E) Western Blot of indicated acetylated histones in WT and Δrpd3 cells. H3 serves as a loading control.
(F) Survival curve for purified Q cells, measured by colony forming units, after incubation in pure water for indicated time at 30 degrees C. Data are presented as mean +/− SEM.
See also Figure S4
Although the yield of Q cells was significantly reduced from 7-day Δrpd3 stationary cultures, we were still able to purify a homogeneous population of unbudded Q-like cells (Figure 4C). This subset of cells arrests in G1 and has accumulated enough trehalose and glycogen to confer increased cell density. These Δrpd3 cells are also resistant to zymolyase treatment, consistent with a cell wall fortification expected for Q cells (Li et al., 2013) (Figure S4C). However, Q cells purified from Δrpd3 cultures retain acetylated histones, reflecting a critical role of Rpd3 in global deacetylation (Figure 4D). Although Q cells isolated from Δrpd3 cultures were stress-tolerant and morphologically similar to WT Q cells, deletion of Rpd3 greatly diminished chronological lifespan (Figure 4E). The dramatic Δrpd3 Q phenotype appears to be largely attributable to action of the promoter-associated Rpd3L repressor complex (Kadosh and Struhl, 1998), since deletion of the Rpd3L-specific SDS3 results in identical morphology, yield, and longevity defects as the Δrpd3 mutation (Figure S4D, E). Deletion of the Rpd3S-specific RCO1 impairs longevity but not yield or morphology, while deletion of SIN3, which disrupts both Rpd3L and Rpd3S, has an identical phenotypic effect (short lifespan, low yield, and aberrant morphology) as deletion of RPD3 or SDS3 (Figure S4D, E). Histone hyperacetylation was observed only when both Rpd3L and Rpd3S were impaired through deletion of SIN3, suggesting that Rpd3 sub-complexes have non-overlapping functions in Q cells (Figure S4F). In addition, deletion of HDA1, which encodes a histone deacetylase that affects overlapping histone targets with Rpd3 (Rundlett et al., 1996), did not display significant phenotypic defects or histone hyperacetylation in the Q state (Figure S4E, F). This analysis suggests that a promoter-specific repressor function of the Rpd3L complex is critical to the proper establishment of quiescence and longevity in yeast, and that maintenance of quiescence and global histone acetylation require both Rpd3L and Rpd3S.
Rpd3 is Essential to Achieve Q-Specific Chromatin and Transcriptional Quiescence
In order to determine the mechanism leading to viability and lifespan defects in Δrpd3 Q cells, we compared chromatin features between WT and Δrpd3 strains (Figure 5A). As outlined above, WT Q cells have increased H3 density and hypoacetylation at genes that are most repressed between log and Q cells. Conversely, least repressed (or induced) genes are associated with decreased H3 density and significant hyperacetylation in WT Q cells. Surprisingly, the H3 density and H4 acetylation profiles in Δrpd3 Q cells are not only distinct from WT Q cells but are nearly identical to those in WT DS cells. In addition, for the Δrpd3 strain, there was no difference in H3 density between the most and least repressed genes and no significant hypoacetylation at genes most repressed in WT Q cells. This is in stark contrast to Δrpd3 log cells, which show nearly identical H3 density and H4 acetylation profiles as WT log cells at TSSs, thus revealing that Rpd3 has a unique function in the Q state. Furthermore, there is a stronger correlation in H4 acetylation profiles at all TSSs between Δrpd3 Q cells and WT DS cells (r=0.7) than between Δrpd3 Q cells and WT Q (r=0.5) (Figure 5B). This striking result shows that Rpd3 plays the major role in the establishment of Q-specific chromatin at promoters genome-wide. Consistent with the loss in repressive chromatin in Q cells, we also see global derepression of virtually all transcripts in Δrpd3 Q cells compared to WT Q cells, with Δrpd3 Q cells only achieving repression comparable to WT DS levels (Figure 5C–F, Figure S5). Both the number of genes and the degree of transcriptional derepression in Δrpd3 is much greater in Q cells (Figure 5E) than in Δrpd3 log cells (Figure S5), again establishing that Rpd3 has much more significant global roles in Q cells than in log cells. The transcript profiles are strikingly similar between Δrpd3 Q and WT DS, and importantly, many fewer genes are repressed to a much smaller degree between Δrpd3 DS and Δrpd3 Q (Figure 5C, D, F, and S5), further supporting a role of Rpd3 in promoting progression from the DS to the Q state and establishing global transcriptional shutoff. This post-DS requirement for Rpd3 to establish global transcriptional repression in Q cells strongly supports the view that the Q and DS states are distinct.
Figure 5. Rpd3 Plays the Key Role for Transcriptional Quiescence.

(A) Histone H3 density (top) or hyperacetylated H4ac signal (bottom) for 500 most- and 500 least-repressed genes in Q state for indicated strains. Orange lines highlight the points of similarity between WT DS shift cells and Δrpd3 Q cells.
(B) Scatterplot showing correlation of H4ac signal at TSSs between indicated strains.
(C) Boxplot showing normalized transcript abundance globally (left) or for ribosomal protein transcripts (right). Orange lines highlight similarities between WT DS shift and Δrpd3 Q.
(D) Browser shot comparing normalized transcription levels in WT DS, WT Q, and Δrpd3 Q cells.
(E, F) Scatterplots showing correlation and global differences between the transcriptomes of the indicated strains. Red diagonal line indicates y=x axis, and yellow dots correspond to ribosomal protein genes.
See also Figure S5.
Global Promoter Targeting of Rpd3 Deacetylase Takes Place For Transcriptional Shutoff in Q Cells
Since the above results clearly demonstrate that Rpd3 plays the major role in promoting Q-specific chromatin and transcriptional quiescence, we sought to determine the mechanism by which Rpd3 could play such a global role in Q cells. To this end, we searched for direct targets of Rpd3 by determining the genomic distribution of Rpd3-Myc in WT cells using ChIP-Seq (Figure 6A, B). Distribution of Rpd3-Myc in log cells was similar to previous reports (Kurdistani et al., 2002), with a small number of Rpd3 binding peaks corresponding to known Rpd3 targets including Ume6-repressed genes (Kadosh and Struhl, 1997). The global distribution of Rpd3 at TSSs in log cells tracks nucleosomal positions, consistent with the action of the Rpd3S complex on nucleosomes within coding regions (Keogh et al., 2005), with clear enrichment at a subset of promoters (Figure 6B). Rpd3 ChIP signals in Q cells, on the other hand, exhibited sharply distinct distribution profiles, with peaks in the promoter region corresponding to more than 50% of all genes (Figure 6A, B). This unprecedented redistribution of Rpd3 is not due to increased Rpd3 abundance (Figure S6A). Consistent with the transcriptional profiles, the global changes in Rpd3 targeting were not observed at the DS, again highlighting the difference between the Q and DS states (Figure S6B). Global Rpd3 promoter targeting does not take place in log cells treated with rapamycin, which inhibits TOR signaling and mimics starvation (Heitman et al., 1991), or thiolutin, which inhibits RNA polymerase and causes global transcriptional shutoff (Grigull et al., 2004) (Figure S6B). These experiments strongly suggest that global Rpd3 targeting is not an indirect result of altered transcriptional output, but an active quiescence-specific phenomenon that confers Q-specific chromatin changes.
Figure 6. Global Relocalization of Rpd3 Upon Quiescent Entry.

(A) Browser shot of Rpd3 binding in log cells (light blue) and Q cells (dark blue) along the length of chromosome IX (top) or a zoomed in (translucent red rectangle) segment of chromosome IX (bottom).
(B) Global distribution of Rpd3 localization at TSSs in aggregate (left) or individual genes ranked by Rpd3-Myc signal (right).
(C) Browser shot of Rpd3-Myc ChIP-seq signals in WT (black), Δstb3 (blue), and Δxbp1 (orange) strains showing TF-dependence of Rpd3 binding. Gene names indicate promoters where Rpd3 binding is dictated by the associated TF.
(D) Global comparison of Rpd3 promoter binding in Δstb3 and Δxbp1 strains. Rpd3 ChIP-seq signal ratio was calculated at 4550 TSSs. Blue indicates promoters where deletion of STB3 reduces Rpd3 binding while orange indicates promoters where XBP1 deletion reduces Rpd3 binding.
(E) Scatterplot showing mutual exclusivity of Rpd3 binding and H4 hyperacetylation in Q cells at gene promoters.
(F) Histone acetylation levels, relative transcriptional repression, and change in Pol II binding during the log-to-Q transition at annotated TSS ranked by Rpd3 binding in Q cells. Transcriptional repression is represented as log2 transcription ratio centered at median repression value. Acetylation difference is the log2 ratio normalized to H3, Pol II change is log2 ratio of Rpb3 (Pol II subunit) binding between log and Q cells.
(G) Difference in acetylation and transcription between WT Q and Δrpd3 Q cells ranked by Rpd3 binding in Q cells.
See also Figure S6
We next sought to determine the basis for Rpd3 redistribution upon Q entry. Previous work has shown that rapamycin treatment or deletion of the TOR-responsive Sch9 kinase leads to a modestly increased repertoire of Rpd3 binding sites (Huber et al., 2011; Humphrey et al., 2004). Indeed, we see a small increase in Rpd3 targets after the DS or after rapamycin treatment (Figure S6B), but the widespread increase in Q-specific targets cannot be explained by previously characterized Rpd3 recruitment factors associated with TOR inactivation. We were particularly interested in two repressors, Stb3 and Xbp1. Stb3 is excluded from the nucleus by the TOR pathway in nutrient-rich media and plays a role in ribosomal protein repression (Huber et al., 2011). Xbp1 is specifically induced during the transition to quiescence, was recently shown to repress nearly 15% of yeast genes upon Q entry, and has a physical interaction with Rpd3 (Mai and Breeden, 1997; Miles et al., 2013; Tao et al., 2011). Stb3 and Xbp1 binding motifs are associated with no detectable Rpd3 ChIP signals in log cells but substantial signals in Q cells (Figure S6C). In contrast, Rpd3 binding at the previously characterized Ume6 motifs associated with repression of meiotic genes is detectable to similar degrees in both log and Q states. To determine if Stb3 and Xbp1 are directly involved in Q cell-specific Rpd3 distribution, we performed Rpd3-Myc ChIP-seq in Δstb3 and Δxbp1 strains (Figure 6C, D). Strikingly, both Δstb3 and Δxbp1 mutations specifically abolished Rpd3 ChIP signals at Stb3 and Xbp1 binding motifs, respectively (Figure 6C and S6D). Stb3-dependent Rpd3 peaks are found at promoters highly enriched for translational machinery and macromolecule metabolism while Xbp1-dependent peaks are located at promoters enriched for cell wall organization, sterol transport, and polysaccharide catabolism. Together, Xbp1 and Stb3 can explain up to 500 Rpd3 peaks in Q cells, thus supporting a role of Q-specific TFs in Rpd3 recruitment in the Q state (Figure 6D). Given that there are many repressors expressed in Q cells that are implicated to function through Rpd3, our results strongly suggest that a significant fraction of Rpd3 targeting occurs via transcriptional repressors that function in Q cells.
While we cannot exclude nonhistone substrates for Rpd3 in Q cells, the major targets of Rpd3 are likely histones at enriched sites, as Rpd3 binding and histone acetylation are mutually exclusive at TSSs (Figure 6E). Rpd3-bound loci are markedly hypoacetylated in Q cells, particularly into the coding region of target genes, and Rpd3 binding levels correlate with the extent of transcriptional repression and Pol II binding decrease between log and Q cells (Figure 6F). In addition, the binding of Rpd3 corresponds to acetylation and transcription differences observed between WT and Δrpd3 Q cells (Figure 6G). Based on these results, we propose that global promoter targeting of Rpd3 through Q cell specific transcriptional repressors leads to a massive histone deacetylation at promoters, which drives the transcriptional shutoff necessary for Q entry.
Discussion
Model for Global Transcriptional Shutoff
We propose a model for transcriptional quiescence that is reliant on the Rpd3 lysine deacetylase (Figure 7). During logarithmic growth, Rpd3 action is restricted to a few loci since there is no requirement for global chromatin deacetylation and transcriptional repression in the presence of abundant resources. As cells undergo DS, Rpd3 is recruited to a handful of new targets to repress ribosome biogenesis genes and ribosomal protein genes, which are sensitive to growth conditions (Huber et al., 2011). Upon Q entry, Rpd3 is targeted to the promoters of roughly half of the known S. cerevisiae genes to induce global transcriptional quiescence. Localization to new promoters occurs via recruitment by Q-specific transcription factors, including Xbp1 and Stb3, leading to deacetylation and increased occupancy of nearby nucleosomes and ultimately transcriptional repression (Figure 7A). This model is exemplified by the OPY2-TKL1 locus, where Xbp1 recruits Rpd3 to the promoter of TKL1, a transketolase gene, only after quiescence entry resulting in deacetylation of adjacent nucleosomes, reorganization of local chromatin, and strong repression of TKL1 transcription (Figure 7B). In the absence of Rpd3, cells are unable to shift from the chromatin state observed at the DS to the stably repressed state characteristic of Q cells. This failure to achieve global transcriptional quiescence leads to significantly shortened chronological lifespan, which may be the result of over-utilization of limited resources or pervasive ectopic expression of genes that disrupt the Q state. Through the global but precise recruitment of a chromatin-based transcriptional repressor, budding yeast are able to achieve the unique and reproducible reprogramming of transcription as dictated by specific environmental cues.
Figure 7. Model for Rpd3-Mediated Quiescence.
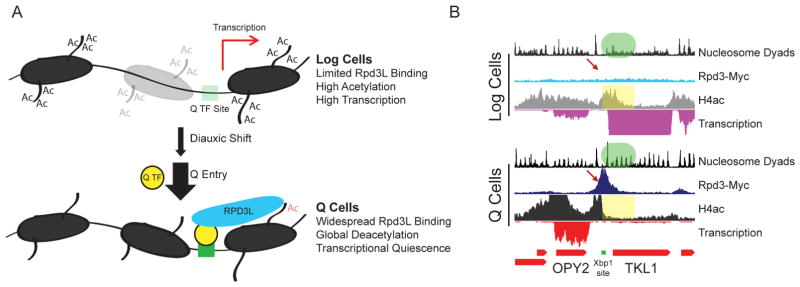
(A) Cartoon representation of chromatin state in log and Q cells. See text for details.
(B) Characteristic locus demonstrating Rpd3-mediated repression. The TKL1 gene is actively transcribed in log cells, where Rpd3 is absent (top). In Q cells, Xbp1 binds to a specific motif (green rectangle) and recruits Rpd3 upstream of the TKL1 promoter (red arrow), histones are deacetylated into the coding region (yellow shaded region), nucleosomes are stabilized (green shaded region), and transcription is extensively repressed.
Implications for Quiescence in S. cerevisiae
It has previously been suggested that quiescence in budding yeast can be described as an extrapolation of slow growth (Klosinska et al., 2011). Our characterization of the molecular events leading to transcriptional quiescence clearly distinguishes the post-DS, slow-growing state from the Q state. Although distinct initial nutrient-dependent transcriptional reprogramming events may occur, such responses, including the DS response, are not sufficient for the global reprogramming of chromatin and stable induction of transcriptional quiescence. While transcription profiles are indeed correlated between DS cells and Q cells (particularly at stress response genes), there are at least two discrete transitions in transcriptome profiles after full glucose consumption. During DS, stress response and shutdown of translational machinery are elicited. This is followed by a dramatic increase in global transcriptional repression upon Q entry. Further, significant chromatin changes, including global histone deacetylation and higher promoter nucleosome occupancy, accompany the transition to the Q state, but are not seen shortly after DS. Finally, global promoter targeting of Rpd3 takes place only after DS, clearly demonstrating the presence of a distinct mechanism to drive cells from a DS chromatin state to Q. Interestingly, previous work has shown that histone acetylation upon nutrient repletion is required for cell cycle reentry and transcriptional induction, and that addition of acetyl-CoA is sufficient to promote reentry into the cell cycle (Cai et al., 2011; Shi and Tu, 2013). We speculate that the introduction of glucose metabolites such as acetyl-CoA may trigger a metabolic switch to release Rpd3 from promoters, allowing cells to escape transcriptional quiescence.
Rpd3 as a Global Repressor in the Quiescent State
Previous studies have not defined a strong phenotype associated with deletion of Rpd3 in budding yeast. Rpd3 deletion in mitotically growing cells has been associated with defective heterochromatin assembly at telomeres, increased transcription from cryptic promoters, derepression of meiotic genes, replication defects at late origins, and, interestingly, increased replicative lifespan (Carrozza et al., 2005; Kadosh and Struhl, 1997; Kim et al., 1999; Rundlett et al., 1996; Yoshida et al., 2014), without causing significant growth defects. A modest difference in transcription profiles upon the deletion of single histone deacetylases was recently recapitulated in flies where it was proposed that histone acetylation balance is maintained by overlapping functions of histone deacetylases (Feller et al., 2015). Our results provide evidence that widespread activity of a single lysine deacetylase, Rpd3, is essential for the global chromatin transition and transcriptional repression during yeast quiescence, and no such compensation leading to acetylation balance is observed. In fact, Hda1, a lysine deacetylase with overlapping histone targets (Rundlett et al., 1996), is specifically repressed by Xbp1 and Rpd3 as cells become quiescent (Miles et al., 2013) (and this work). This indicates that a programmed restriction of lysine deacetylase activity is associated with Q cells. This downregulation of redundant deacetylases and/or the limited supply of transcriptional machinery in Q cells may contribute to the increased potency of Rpd3 repression compared to Rpd3 activity in different states, although we cannot rule out the possibility that Rpd3 may function through currently unknown mechanisms in Q cells. We propose that Rpd3 serves its primary function during the Q state, a cell cycle stage that, until recently, has been largely unexplored.
Potential Implications for Metazoans
Although our mechanistic investigation was performed on quiescent S. cerevisiae cultures, transcriptional quiescence and reprogramming is a conserved feature of all eukaryotic systems (Valcourt et al., 2012). Similar to S. cerevisiae, transcription output in fission yeast is significantly reduced on a global scale (Marguerat et al., 2012), while quiescent human fibroblasts and hematopoietic stem cells maintain their own unique Q-specific transcription programs (Coller et al., 2006; Pietras et al., 2011). Rpd3 is highly conserved from yeast to humans (Yang and Seto, 2008). Therefore, the strategy of redistributing lysine deacetylase activity through unique expression of program-specific recruitment factors we have discovered has the potential to contribute as a model system for quiescence programs observed in other organisms. Indeed, HES1, a component of a complex that recruits Rpd3, is critical for ensuring the reversibility of quiescence in Drosophila and suppressing senescence in human fibroblasts (Chen et al., 1999; Sang et al., 2008). Additionally, the combined use of lysine deacetylase inhibitors with antimitotic or antiretroviral therapy is emerging as an effective strategy for depleting resistant reservoirs of leukemic stem cells or reactivating and eliminating latent HIV infections through unknown mechanisms (Grant, 2014; Savarino et al., 2009; Shirakawa et al., 2013; Zhang et al., 2010). This success of lysine deacetylase inhibitors in disrupting what are thought to be quiescent disease states (Margolis, 2011; Sharma et al., 2010; Trumpp et al., 2010) supports a potential role for Rpd3 orthologs in establishing or maintaining Q states in humans. While the mechanisms underlying these observations in metazoans are likely more complex than in S. cerevisiae, it is possible that S. cerevisiae Q cells will provide a powerful model system to investigate the molecular mechanisms underlying Q entry, maintenance and exit in all eukaryotic cells.
Experimental Procedures
Strains and Growth Conditions
Two independent RAD5+ WT strains were made from the prototrophic W303 parent BY6500 (Miles et al., 2013). Strains were constructed using standard procedures. Log cells were harvested at OD600 = 0.4–0.6; DS cells were harvested exactly 2 hours after glucose was no longer detected in the media using glucose detection strips (Precision Labs, Inc); Q cells were harvested from 7-day stationary phase cultures using Percoll gradient as described previously (Allen et al., 2006; Li et al., 2009). For growth curve analysis, YPD cultures from indicated strains were initiated (t=0) at OD600 = 0.02. Chronological lifespan (%CFU) was calculated as the number of colonies formed from isolated Q cells after the indicated time in water at 30 °C relative to the initial number of colonies formed from the isolated Q cells. Yeast viability was determined using Funga Light Yeast Viability Kit (Molecular Probes) according to the manufacturer’s protocol.
RNA Isolation
RNA was isolated using the crushed glass beads/acid phenol method (Uppuluri et al., 2007), then further purified and treated with DNaseI using the RNeasy kit (Qiagen). ERCC Spike-in control mix 1 (1.5 uL of 1:10 dilution) (Life Technologies) was added to 3 ug of total DNase-treated RNA prior to rRNA depletion (Ribo-Zero, Epicentre). Strand-specific sequencing libraries were constructed using the dUTP protocol combined with TruSeq (Illumina) (Parkhomchuk et al., 2009; Sultan et al., 2012). Paired end sequencing (50 cycles) was performed on Illumina HiSeq 2500 on high-output mode (Fred Hutchinson Cancer Research Center shared resources). See Supplemental Experimental Procedures for data analysis details.
Micrococcal Nuclease (MNase) Digestion and Chromatin Immunoprecipitation
MNase digestion and ChIP were performed as previously described (Rodriguez et al., 2014) with the following modifications: Purified Q cells (300 OD600 units) required 60 minute incubation with 15 mg of zymolyase prior to MNase digestion. Q cells (200 OD600 units) required two rounds of bead beating (5 min each) to disrupt cell walls for ChIP. Thiolutin (3 ug/mL) or rapamycin (100 nM) was added to log cells at OD600=0.6 for 60 minutes prior to crosslinking and ChIP. Antibodies used were anti-H3 (Active Motif, cat# 39163), anti-H2B (Active Motif, cat# 39125), anti-H3K23ac (Millipore, cat# 07-355), anti-Hyperacetylated H4 (“Penta”, Millipore, cat# 06-946), anti-H3K9ac (Millipore, cat# 06-942), anti-H4K12ac (Millipore, cat# 07-595), anti-H3 pan-acetyl (abcam, cat# ab47915), anti-myc (9E10 ascites; Covance), anti-RPB3 (BioLegend, cat#665003), anti-TFIIB (gift from Steve Hahn). DNA from MNase digests was treated with 10 units Alkaline Phosphatase (NEB) and mononucleosomal DNA was size-selected from low-melt agarose prior to library preparation using the TruSeq (Illumina) protocol. Libraries for ChIP and input DNA were constructed using the Ovation Ultralow sample protocol (NuGEN). Paired end sequencing (MNase-Seq) or single end sequencing (ChIP-Seq) was performed on Illumina HiSeq 2500 on high output mode or rapid run mode (Fred Hutchinson Cancer Research Center shared resources) See Supplemental Experimental Procedures for data analysis details.
Supplementary Material
Acknowledgments
We thank members of the Tsukiyama, Breeden, and Biggins labs for helpful discussions and suggestions, Steve Hahn for TFIIB antibody, and the genomics core for sequencing. Research was supported by Leukemia and Lymphoma Society Career Development Program grant CDP-5078-14 for J.N.M., R01GM111428 for T.T., NCI P30-CA015704-38 for L.L.B. and T.T., R21-AG048595 for L.L.B. Sequencing data can be accessed with GEO accession number GSE67151.
Footnotes
Author Contributions
J.N.M., L.L.B., and T.T. designed the experiments, interpreted the results, and prepared the manuscript. J.N.M. performed the experiments and analyzed all data. J.W.B. performed ChIP-PCR and prepared chromatin for ChIP-seq experiments. All authors read and edited the manuscript.
Publisher's Disclaimer: This is a PDF file of an unedited manuscript that has been accepted for publication. As a service to our customers we are providing this early version of the manuscript. The manuscript will undergo copyediting, typesetting, and review of the resulting proof before it is published in its final citable form. Please note that during the production process errors may be discovered which could affect the content, and all legal disclaimers that apply to the journal pertain.
References
- Alejandro-Osorio AL, Huebert DJ, Porcaro DT, Sonntag ME, Nillasithanukroh S, Will JL, Gasch AP. The histone deacetylase Rpd3p is required for transient changes in genomic expression in response to stress. Genome biology. 2009;10:R57. doi: 10.1186/gb-2009-10-5-r57. [DOI] [PMC free article] [PubMed] [Google Scholar]
- Allen C, Buttner S, Aragon AD, Thomas JA, Meirelles O, Jaetao JE, Benn D, Ruby SW, Veenhuis M, Madeo F, et al. Isolation of quiescent and nonquiescent cells from yeast stationary-phase cultures. The Journal of cell biology. 2006;174:89–100. doi: 10.1083/jcb.200604072. [DOI] [PMC free article] [PubMed] [Google Scholar]
- Aragon AD, Rodriguez AL, Meirelles O, Roy S, Davidson GS, Tapia PH, Allen C, Joe R, Benn D, Werner-Washburne M. Characterization of differentiated quiescent and nonquiescent cells in yeast stationary-phase cultures. Molecular biology of the cell. 2008;19:1271–1280. doi: 10.1091/mbc.E07-07-0666. [DOI] [PMC free article] [PubMed] [Google Scholar]
- Baker LA, Ueberheide BM, Dewell S, Chait BT, Zheng D, Allis CD. The yeast Snt2 protein coordinates the transcriptional response to hydrogen peroxide-mediated oxidative stress. Molecular and cellular biology. 2013;33:3735–3748. doi: 10.1128/MCB.00025-13. [DOI] [PMC free article] [PubMed] [Google Scholar]
- Brauer MJ, Huttenhower C, Airoldi EM, Rosenstein R, Matese JC, Gresham D, Boer VM, Troyanskaya OG, Botstein D. Coordination of growth rate, cell cycle, stress response, and metabolic activity in yeast. Molecular biology of the cell. 2008;19:352–367. doi: 10.1091/mbc.E07-08-0779. [DOI] [PMC free article] [PubMed] [Google Scholar]
- Cai L, Sutter BM, Li B, Tu BP. Acetyl-CoA induces cell growth and proliferation by promoting the acetylation of histones at growth genes. Molecular cell. 2011;42:426–437. doi: 10.1016/j.molcel.2011.05.004. [DOI] [PMC free article] [PubMed] [Google Scholar]
- Carrozza MJ, Li B, Florens L, Suganuma T, Swanson SK, Lee KK, Shia WJ, Anderson S, Yates J, Washburn MP, et al. Histone H3 methylation by Set2 directs deacetylation of coding regions by Rpd3S to suppress spurious intragenic transcription. Cell. 2005;123:581–592. doi: 10.1016/j.cell.2005.10.023. [DOI] [PubMed] [Google Scholar]
- Chen G, Fernandez J, Mische S, Courey AJ. A functional interaction between the histone deacetylase Rpd3 and the corepressor groucho in Drosophila development. Genes & development. 1999;13:2218–2230. doi: 10.1101/gad.13.17.2218. [DOI] [PMC free article] [PubMed] [Google Scholar]
- Chen XF, Kuryan B, Kitada T, Tran N, Li JY, Kurdistani S, Grunstein M, Li B, Carey M. The Rpd3 core complex is a chromatin stabilization module. Current biology: CB. 2012;22:56–63. doi: 10.1016/j.cub.2011.11.042. [DOI] [PMC free article] [PubMed] [Google Scholar]
- Coller HA. Cell biology. The essence of quiescence. Science. 2011;334:1074–1075. doi: 10.1126/science.1216242. [DOI] [PMC free article] [PubMed] [Google Scholar]
- Coller HA, Sang L, Roberts JM. A new description of cellular quiescence. PLoS biology. 2006;4:e83. doi: 10.1371/journal.pbio.0040083. [DOI] [PMC free article] [PubMed] [Google Scholar]
- DeRisi JL, Iyer VR, Brown PO. Exploring the metabolic and genetic control of gene expression on a genomic scale. Science. 1997;278:680–686. doi: 10.1126/science.278.5338.680. [DOI] [PubMed] [Google Scholar]
- Feller C, Forne I, Imhof A, Becker PB. Global and specific responses of the histone acetylome to systematic perturbation. Molecular cell. 2015;57:559–571. doi: 10.1016/j.molcel.2014.12.008. [DOI] [PubMed] [Google Scholar]
- Galdieri L, Mehrotra S, Yu S, Vancura A. Transcriptional regulation in yeast during diauxic shift and stationary phase. Omics: a journal of integrative biology. 2010;14:629–638. doi: 10.1089/omi.2010.0069. [DOI] [PMC free article] [PubMed] [Google Scholar]
- Grant S. Targeting leukemia stem cells with HDAC inhibitors and modulators of the DNA damage response. Leukemia Supplements. 2014;3:S14–S15. doi: 10.1038/leusup.2014.8. [DOI] [PMC free article] [PubMed] [Google Scholar]
- Grigull J, Mnaimneh S, Pootoolal J, Robinson MD, Hughes TR. Genome-wide analysis of mRNA stability using transcription inhibitors and microarrays reveals posttranscriptional control of ribosome biogenesis factors. Molecular and cellular biology. 2004;24:5534–5547. doi: 10.1128/MCB.24.12.5534-5547.2004. [DOI] [PMC free article] [PubMed] [Google Scholar]
- Grunstein M. Histone acetylation in chromatin structure and transcription. Nature. 1997;389:349–352. doi: 10.1038/38664. [DOI] [PubMed] [Google Scholar]
- Heitman J, Movva NR, Hall MN. Targets for cell cycle arrest by the immunosuppressant rapamycin in yeast. Science. 1991;253:905–909. doi: 10.1126/science.1715094. [DOI] [PubMed] [Google Scholar]
- Huber A, French SL, Tekotte H, Yerlikaya S, Stahl M, Perepelkina MP, Tyers M, Rougemont J, Beyer AL, Loewith R. Sch9 regulates ribosome biogenesis via Stb3, Dot6 and Tod6 and the histone deacetylase complex RPD3L. The EMBO journal. 2011;30:3052–3064. doi: 10.1038/emboj.2011.221. [DOI] [PMC free article] [PubMed] [Google Scholar]
- Hughes AL, Rando OJ. Mechanisms underlying nucleosome positioning in vivo. Annual review of biophysics. 2014;43:41–63. doi: 10.1146/annurev-biophys-051013-023114. [DOI] [PubMed] [Google Scholar]
- Humphrey EL, Shamji AF, Bernstein BE, Schreiber SL. Rpd3p relocation mediates a transcriptional response to rapamycin in yeast. Chemistry & biology. 2004;11:295–299. doi: 10.1016/j.chembiol.2004.03.001. [DOI] [PubMed] [Google Scholar]
- Kadosh D, Struhl K. Repression by Ume6 involves recruitment of a complex containing Sin3 corepressor and Rpd3 histone deacetylase to target promoters. Cell. 1997;89:365–371. doi: 10.1016/s0092-8674(00)80217-2. [DOI] [PubMed] [Google Scholar]
- Kadosh D, Struhl K. Histone deacetylase activity of Rpd3 is important for transcriptional repression in vivo. Genes & development. 1998;12:797–805. doi: 10.1101/gad.12.6.797. [DOI] [PMC free article] [PubMed] [Google Scholar]
- Keogh MC, Kurdistani SK, Morris SA, Ahn SH, Podolny V, Collins SR, Schuldiner M, Chin K, Punna T, Thompson NJ, et al. Cotranscriptional set2 methylation of histone H3 lysine 36 recruits a repressive Rpd3 complex. Cell. 2005;123:593–605. doi: 10.1016/j.cell.2005.10.025. [DOI] [PubMed] [Google Scholar]
- Kim S, Benguria A, Lai CY, Jazwinski SM. Modulation of life-span by histone deacetylase genes in Saccharomyces cerevisiae. Molecular biology of the cell. 1999;10:3125–3136. doi: 10.1091/mbc.10.10.3125. [DOI] [PMC free article] [PubMed] [Google Scholar]
- Klosinska MM, Crutchfield CA, Bradley PH, Rabinowitz JD, Broach JR. Yeast cells can access distinct quiescent states. Genes & development. 2011;25:336–349. doi: 10.1101/gad.2011311. [DOI] [PMC free article] [PubMed] [Google Scholar]
- Kornberg RD, Thomas JO. Chromatin structure; oligomers of the histones. Science. 1974;184:865–868. doi: 10.1126/science.184.4139.865. [DOI] [PubMed] [Google Scholar]
- Kurdistani SK, Robyr D, Tavazoie S, Grunstein M. Genome-wide binding map of the histone deacetylase Rpd3 in yeast. Nature genetics. 2002;31:248–254. doi: 10.1038/ng907. [DOI] [PubMed] [Google Scholar]
- Li L, Lu Y, Qin LX, Bar-Joseph Z, Werner-Washburne M, Breeden LL. Budding yeast SSD1-V regulates transcript levels of many longevity genes and extends chronological life span in purified quiescent cells. Molecular biology of the cell. 2009;20:3851–3864. doi: 10.1091/mbc.E09-04-0347. [DOI] [PMC free article] [PubMed] [Google Scholar]
- Li L, Miles S, Melville Z, Prasad A, Bradley G, Breeden LL. Key events during the transition from rapid growth to quiescence in budding yeast require posttranscriptional regulators. Molecular biology of the cell. 2013;24:3697–3709. doi: 10.1091/mbc.E13-05-0241. [DOI] [PMC free article] [PubMed] [Google Scholar]
- Mai B, Breeden L. Xbp1, a stress-induced transcriptional repressor of the Saccharomyces cerevisiae Swi4/Mbp1 family. Molecular and cellular biology. 1997;17:6491–6501. doi: 10.1128/mcb.17.11.6491. [DOI] [PMC free article] [PubMed] [Google Scholar]
- Margolis DM. Histone deacetylase inhibitors and HIV latency. Current opinion in HIV and AIDS. 2011;6:25–29. doi: 10.1097/COH.0b013e328341242d. [DOI] [PMC free article] [PubMed] [Google Scholar]
- Marguerat S, Schmidt A, Codlin S, Chen W, Aebersold R, Bahler J. Quantitative analysis of fission yeast transcriptomes and proteomes in proliferating and quiescent cells. Cell. 2012;151:671–683. doi: 10.1016/j.cell.2012.09.019. [DOI] [PMC free article] [PubMed] [Google Scholar]
- Marion RM, Regev A, Segal E, Barash Y, Koller D, Friedman N, O’Shea EK. Sfp1 is a stress- and nutrient-sensitive regulator of ribosomal protein gene expression. Proceedings of the National Academy of Sciences of the United States of America. 2004;101:14315–14322. doi: 10.1073/pnas.0405353101. [DOI] [PMC free article] [PubMed] [Google Scholar]
- Mathelier A, Zhao X, Zhang AW, Parcy F, Worsley-Hunt R, Arenillas DJ, Buchman S, Chen CY, Chou A, Ienasescu H, et al. JASPAR 2014: an extensively expanded and updated open-access database of transcription factor binding profiles. Nucleic acids research. 2014;42:D142–147. doi: 10.1093/nar/gkt997. [DOI] [PMC free article] [PubMed] [Google Scholar]
- Mews P, Zee BM, Liu S, Donahue G, Garcia BA, Berger SL. Histone methylation has dynamics distinct from those of histone acetylation in cell cycle reentry from quiescence. Molecular and cellular biology. 2014;34:3968–3980. doi: 10.1128/MCB.00763-14. [DOI] [PMC free article] [PubMed] [Google Scholar]
- Miles S, Li L, Davison J, Breeden LL. Xbp1 directs global repression of budding yeast transcription during the transition to quiescence and is important for the longevity and reversibility of the quiescent state. PLoS genetics. 2013;9:e1003854. doi: 10.1371/journal.pgen.1003854. [DOI] [PMC free article] [PubMed] [Google Scholar]
- Nagalakshmi U, Wang Z, Waern K, Shou C, Raha D, Gerstein M, Snyder M. The transcriptional landscape of the yeast genome defined by RNA sequencing. Science. 2008;320:1344–1349. doi: 10.1126/science.1158441. [DOI] [PMC free article] [PubMed] [Google Scholar]
- Parkhomchuk D, Borodina T, Amstislavskiy V, Banaru M, Hallen L, Krobitsch S, Lehrach H, Soldatov A. Transcriptome analysis by strand-specific sequencing of complementary DNA. Nucleic acids research. 2009;37:e123. doi: 10.1093/nar/gkp596. [DOI] [PMC free article] [PubMed] [Google Scholar]
- Pietras EM, Warr MR, Passegue E. Cell cycle regulation in hematopoietic stem cells. The Journal of cell biology. 2011;195:709–720. doi: 10.1083/jcb.201102131. [DOI] [PMC free article] [PubMed] [Google Scholar]
- Radonjic M, Andrau JC, Lijnzaad P, Kemmeren P, Kockelkorn TT, van Leenen D, van Berkum NL, Holstege FC. Genome-wide analyses reveal RNA polymerase II located upstream of genes poised for rapid response upon S. cerevisiae stationary phase exit. Molecular cell. 2005;18:171–183. doi: 10.1016/j.molcel.2005.03.010. [DOI] [PubMed] [Google Scholar]
- Rando OJ. Combinatorial complexity in chromatin structure and function: revisiting the histone code. Current opinion in genetics & development. 2012;22:148–155. doi: 10.1016/j.gde.2012.02.013. [DOI] [PMC free article] [PubMed] [Google Scholar]
- Reimand J, Aun A, Vilo J, Vaquerizas JM, Sedman J, Luscombe NM. m:Explorer: multinomial regression models reveal positive and negative regulators of longevity in yeast quiescence. Genome biology. 2012;13:R55. doi: 10.1186/gb-2012-13-6-r55. [DOI] [PMC free article] [PubMed] [Google Scholar]
- Rodriguez J, McKnight JN, Tsukiyama T. Genome-Wide Analysis of Nucleosome Positions, Occupancy, and Accessibility in Yeast: Nucleosome Mapping, High-Resolution Histone ChIP, and NCAM. In: Ausubel Frederick M, et al., editors. Current protocols in molecular biology. Vol. 108. 2014. pp. 21 28 21–21 28 16. [DOI] [PMC free article] [PubMed] [Google Scholar]
- Rohde JR, Cardenas ME. The tor pathway regulates gene expression by linking nutrient sensing to histone acetylation. Molecular and cellular biology. 2003;23:629–635. doi: 10.1128/MCB.23.2.629-635.2003. [DOI] [PMC free article] [PubMed] [Google Scholar]
- Rundlett SE, Carmen AA, Kobayashi R, Bavykin S, Turner BM, Grunstein M. HDA1 and RPD3 are members of distinct yeast histone deacetylase complexes that regulate silencing and transcription. Proceedings of the National Academy of Sciences of the United States of America. 1996;93:14503–14508. doi: 10.1073/pnas.93.25.14503. [DOI] [PMC free article] [PubMed] [Google Scholar]
- Sang L, Coller HA, Roberts JM. Control of the reversibility of cellular quiescence by the transcriptional repressor HES1. Science. 2008;321:1095–1100. doi: 10.1126/science.1155998. [DOI] [PMC free article] [PubMed] [Google Scholar]
- Savarino A, Mai A, Norelli S, El Daker S, Valente S, Rotili D, Altucci L, Palamara AT, Garaci E. “Shock and kill” effects of class I-selective histone deacetylase inhibitors in combination with the glutathione synthesis inhibitor buthionine sulfoximine in cell line models for HIV-1 quiescence. Retrovirology. 2009;6:52. doi: 10.1186/1742-4690-6-52. [DOI] [PMC free article] [PubMed] [Google Scholar]
- Schmelzle T, Hall MN. TOR, a central controller of cell growth. Cell. 2000;103:253–262. doi: 10.1016/s0092-8674(00)00117-3. [DOI] [PubMed] [Google Scholar]
- Sharma SV, Lee DY, Li B, Quinlan MP, Takahashi F, Maheswaran S, McDermott U, Azizian N, Zou L, Fischbach MA, et al. A chromatin-mediated reversible drug-tolerant state in cancer cell subpopulations. Cell. 2010;141:69–80. doi: 10.1016/j.cell.2010.02.027. [DOI] [PMC free article] [PubMed] [Google Scholar]
- Shi L, Tu BP. Acetyl-CoA induces transcription of the key G1 cyclin CLN3 to promote entry into the cell division cycle in Saccharomyces cerevisiae. Proceedings of the National Academy of Sciences of the United States of America. 2013;110:7318–7323. doi: 10.1073/pnas.1302490110. [DOI] [PMC free article] [PubMed] [Google Scholar]
- Shirakawa K, Chavez L, Hakre S, Calvanese V, Verdin E. Reactivation of latent HIV by histone deacetylase inhibitors. Trends in microbiology. 2013;21:277–285. doi: 10.1016/j.tim.2013.02.005. [DOI] [PMC free article] [PubMed] [Google Scholar]
- Sultan M, Dokel S, Amstislavskiy V, Wuttig D, Sultmann H, Lehrach H, Yaspo ML. A simple strand-specific RNA-Seq library preparation protocol combining the Illumina TruSeq RNA and the dUTP methods. Biochemical and biophysical research communications. 2012;422:643–646. doi: 10.1016/j.bbrc.2012.05.043. [DOI] [PubMed] [Google Scholar]
- Tao R, Chen H, Gao C, Xue P, Yang F, Han JD, Zhou B, Chen YG. Xbp1-mediated histone H4 deacetylation contributes to DNA double-strand break repair in yeast. Cell research. 2011;21:1619–1633. doi: 10.1038/cr.2011.58. [DOI] [PMC free article] [PubMed] [Google Scholar]
- Trumpp A, Essers M, Wilson A. Awakening dormant haematopoietic stem cells. Nature reviews Immunology. 2010;10:201–209. doi: 10.1038/nri2726. [DOI] [PubMed] [Google Scholar]
- Uppuluri P, Perumal P, Chaffin WL. Analysis of RNA species of various sizes from stationary-phase planktonic yeast cells of Candida albicans. FEMS yeast research. 2007;7:110–117. doi: 10.1111/j.1567-1364.2006.00143.x. [DOI] [PubMed] [Google Scholar]
- Valcourt JR, Lemons JM, Haley EM, Kojima M, Demuren OO, Coller HA. Staying alive: metabolic adaptations to quiescence. Cell cycle. 2012;11:1680–1696. doi: 10.4161/cc.19879. [DOI] [PMC free article] [PubMed] [Google Scholar]
- Weiner A, Chen HV, Liu CL, Rahat A, Klien A, Soares L, Gudipati M, Pfeffner J, Regev A, Buratowski S, et al. Systematic dissection of roles for chromatin regulators in a yeast stress response. PLoS biology. 2012;10:e1001369. doi: 10.1371/journal.pbio.1001369. [DOI] [PMC free article] [PubMed] [Google Scholar]
- Weiner A, Hughes A, Yassour M, Rando OJ, Friedman N. High-resolution nucleosome mapping reveals transcription-dependent promoter packaging. Genome research. 2010;20:90–100. doi: 10.1101/gr.098509.109. [DOI] [PMC free article] [PubMed] [Google Scholar]
- Yang XJ, Seto E. The Rpd3/Hda1 family of lysine deacetylases: from bacteria and yeast to mice and men. Nature reviews Molecular cell biology. 2008;9:206–218. doi: 10.1038/nrm2346. [DOI] [PMC free article] [PubMed] [Google Scholar]
- Yoshida K, Bacal J, Desmarais D, Padioleau I, Tsaponina O, Chabes A, Pantesco V, Dubois E, Parrinello H, Skrzypczak M, et al. The histone deacetylases sir2 and rpd3 act on ribosomal DNA to control the replication program in budding yeast. Molecular cell. 2014;54:691–697. doi: 10.1016/j.molcel.2014.04.032. [DOI] [PubMed] [Google Scholar]
- Zhang B, Strauss AC, Chu S, Li M, Ho Y, Shiang KD, Snyder DS, Huettner CS, Shultz L, Holyoake T, et al. Effective targeting of quiescent chronic myelogenous leukemia stem cells by histone deacetylase inhibitors in combination with imatinib mesylate. Cancer cell. 2010;17:427–442. doi: 10.1016/j.ccr.2010.03.011. [DOI] [PMC free article] [PubMed] [Google Scholar]
Associated Data
This section collects any data citations, data availability statements, or supplementary materials included in this article.