

Summary
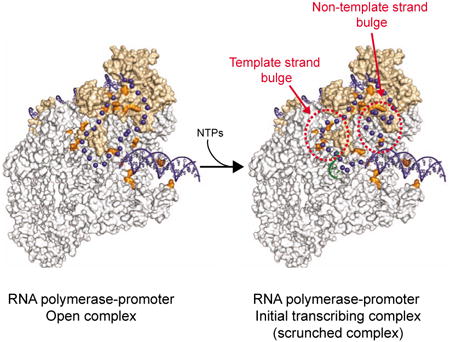
RNA polymerase binds tightly to DNA to recognize promoters with high specificity but then releases these contacts during the initial stage of transcription. We report a site-specific crosslinking approach to map the DNA path in bacterial transcription intermediates at amino acid and nucleotide resolution. After validating the approach by showing that the DNA path in open complexes (RPO) is the same as in high resolution X-ray structures, we define the path following substrate addition in ‘scrunched’ complexes (RPITC). The DNA bulges that form within the transcription bubble in RPITC are positioned differently on the two strands. Our data suggest that the non-template strand bulge is extruded into solvent in complexes containing a 5-mer RNA, whereas the template strand bulge remains within the template strand tunnel, exerting stress on the β flap-β′ clamp-σ3.2 interaction. We propose that this stress contributes to σ3.2 displacement from the RNA exit channel, facilitating promoter escape.
Graphical abstract
Introduction
Organisms in all 3 domains of life utilize multisubunit RNA polymerases with similar overall structures that recognize promoters and initiate transcription. In bacteria, the catalytic subunits of the RNA polymerase (RNAP) associate with initiation proteins called σ factors. The E. coli holoenzyme containing the major s, Eσ70, binds to promoter DNA as a closed complex (RPC) which then undergoes a series of conformational changes that ultimately result in melting of ∼13 bp of DNA to form an open complex (RPO). RNAP begins synthesis of RNA as an initial transcribing complex (RPITC) that usually undergoes multiple rounds of synthesis and release of short abortive RNA products without releasing its contacts to promoter DNA. RNAP is able to move away from the promoter to form a mature transcription elongation complex (TEC) only after RNAP-promoter contacts are released (Murakami et al., 2002a; Kapanidis et al., 2006; Revyakin et al., 2006; Werner and Grohmann, 2011).
RPO has been characterized structurally in bacteria, using constraints generated by crosslinks from specific positions in DNA to large segments of RNAP (Naryshkin et al., 2000), by fluorescence resonance energy transfer (FRET) (Mekler et al., 2002), as well as by x-ray crystallography of promoter complexes (e.g. Campbell et al., 2002; Murakami et al., 2002b; Hudson et al., 2009; Zhang et al., 2012; Feklistov and Darst, 2011; Basu et al., 2014; Zuo and Steitz, 2015). Together, these studies have provided us with a detailed model of RPO that has been immensely useful for interpreting the large set of genetic and biochemical information that has accumulated in the last 30 years. However, such a detailed picture does not exist for any of the other intermediates in the transcription initiation pathway.
RNA synthesis begins after RPO formation, but the complex proceeds through additional intermediate states preceding promoter escape. The intermediates following RPO formation but preceding TEC formation are referred to here as initial transcribing complexes, RPITC. Early footprinting studies attempted to address the structures of promoter-RNAP complexes following nucleotide addition (Krummel and Chamberlin, 1989; Spassky, 1986). However, only relatively recently has a general picture emerged of the intermediates that occur following nucleotide addition. Kapanidis and colleagues demonstrated using a single molecule fluorescence resonance energy transfer (smFRET) approach that the distance between the RNAP leading edge and downstream DNA and the distance between upstream DNA and downstream DNA change, whereas the distance between the RNAP trailing edge and upstream DNA does not change (Kapanidis et al., 2006). Revyakin and colleagues demonstrated using a magnetic tweezers approach that the number of DNA bp unwound by RNAP increases during productive initiation as well as during abortive initiation (Revyakin et al., 2006).
The picture that emerged indicates that RNAP pulls downstream DNA into itself one bp per phosphodiester bond formed after formation of the first dinucleotide; therefore, the length of DNA pulled into the enzyme during initial transcription is 2 nt fewer than the length of the transcribed RNA (the “n-2 rule”; Revyakin et al., 2006). A subset of contacts between RNAP and promoter DNA is maintained as DNA is pulled into RNAP, resulting in expansion of the single-stranded bubble. The accumulated DNA on each strand in these “scrunched” intermediate states is proposed to be accommodated as single-stranded bulges within the unwound region (Kapanidis et al. 2006).
The template strand DNA was pictured as being extruded from RNAP into bulk solvent at or near template strand positions -9 to -10 at the entrance to the template strand tunnel (Kapanidis et al., 2006) or alternatively as being accommodated within the template strand tunnel (Zuo and Steitz, 2015). On the non-template strand it was suggested that the bulged DNA might be extruded near -5 to -6 (Kapanidis et al., 2006). However, the previous studies did not unambiguously identify the locations of the bulges; we do not know which nucleotides in RPITC deviate from the path followed by single-strand DNA in RPO and whether these nucleotides remain in the main channel or alternatively are extruded onto the surface of RNAP during scrunching. The promoter escape mechanism is much less understood in eukaryotes, although a scrunching-like mechanism has been proposed (reviewed by Jonkers and Lis, 2015).
Here we use a solution-based crosslinking approach to monitor the interface between RNAP and promoter DNA in an open complex and in an initial transcribing complex that has synthesized a 5-mer RNA (RPITC5). By incorporating a crosslinkable amino acid at specific positions in RNAP and mapping the crosslinks to promoter DNA at nucleotide resolution, we first show that the path of DNA in RPO obtained from our crosslinking approach agrees with and extends the information about protein-nucleic acid interactions from crystal structures. We then use this approach to identify the path of the DNA in a scrunched intermediate, defining the bulged out nucleotides in RPITC5 whose path deviates from that in RPO in order to accommodate the extra DNA within the enzyme.
We further show that the scrunched template strand DNA in RPITC5 remains within the channel; i.e. it is not extruded but rather approaches the entrance to the RNA exit channel. We predict that an effect of the template strand bulge on a tripartite complex consisting of the β flap, β′ clamp, and σ3.2 facilitates the removal of σ3.2 from the RNA exit channel thereby contributing to promoter escape. Thus, our work introduces a method for identifying the path of DNA or RNA in protein-nucleic acid complexes, provides a snapshot of a critical step in transcription initiation, and suggests that the template strand bulge may promote a conformational rearranagement that contributes to the mechanism of promoter escape.
Results
Bpa Incorporated at Specific Positions in RNAP Crosslinks to DNA in RNAP-Promoter Complexes
To characterize the surface of RNAP in proximity to DNA in transcription initiation intermediates, we used a crosslinking-based method to identify promoter positions near specific amino acids. The non-natural, UV-crosslinkable amino acid Bpa was incorporated site-specifically at amber stop codons introduced into the plasmid-encoded β, β′, or σ subunits of RNAP in strains expressing an evolved tRNA and tRNA synthetase pair (Ryu and Schultz, 2006) (Figures 1A and 1B). 152 RNAP variants were constructed containing single Bpa substitutions at solvent-accessible positions on the enzyme faces of RNAP that bind to the -35 hexamer, the -10 hexamer, and the -10/-35 spacer in RPO, as well as on the surfaces of RNAP that line the main DNA channel. These substitutions included 45 positions in β, 51 in β′, and 56 in σ70 (Figure 1C, Table S1). Each of these 152 proteins was purified as core enzyme (α2 ββ′ω) or σ70, and holoenzymes (α2ββ′ωs70) were assembled by combining purified core RNAP-Bpa variants with σ70 or core RNAP with σ70-Bpa variants.
Figure 1. Identification of Bpa positions that crosslink to DNA.

(A) Structure of p-benzoyl-L-phenylalanine (Bpa). (B) SDS-PAGE of protein lysates from cells with TAG mutations at codons 201 or 203 of rpoB. Full-length β was only observed when core RNAP was overexpressed in cells grown in medium containing Bpa. (C) The 152 positions where Bpa substitutions were constructed in RNAP are shown as yellow spheres on a structure of E. coli RNAP holoenzymes (Zuo et al., 2013; PDB 4JKR; see also Table S1). Note that the wild-type amino acids are illustrated, not Bpa. (D) Sequences of rrnB P1 and the two promoters utilized here because they form more stable complexes with RNAP. The -10 and -35 hexamers are in red, differences from rrnB P1 are in bold, and predicted start sites are indicated by bent arrows. (E) Representative SDS-PAGE gel showing a 32P-labeled DNA fragment containing the rrnB C-7G promoter crosslinked to RNAP. Lane 1: no RNAP+UV. Lane 2: β′T48Bpa-RNAP no UV. Lane 3: WT RNAP +UV. Lane 4: β′T48Bpa-RNAP + UV. (F) 50 positions in E. coli RNAP where Bpa crosslinked to DNA are shown as red spheres. Related to Table S1.
Complexes of Bpa-containing holoenzymes and a radiolabeled DNA fragment were irradiated with 365 nm UV light under solution conditions that generated RPO or RPITC on two variants of the rrnB P1 promoter, rrnB con and rrnB C-7G (Fig. 1D), that form more stable open complexes than the wild-type promoter, and the reactions were analyzed by SDS-PAGE (Figure 1E). RNAP-Bpa variants that covalently crosslinked to promoter-containing DNA were detected as a band with retarded mobility. 50 of the 152 variants formed crosslinks (Figure 1F and Table S1). Crosslinking required UV treatment and an RNAP that contained Bpa (Figure 1E and data not shown). The 37 variants that crosslinked most efficiently in RPO or RPITC were chosen for further analysis (Table S2).
The Path of DNA in the RPO Model Defined by Bpa Crosslinking Matches that in RPO Models from Crystal Structures
To validate our approach for identifying the path of DNA in a promoter complex, we compared the path determined by Bpa crosslinking with that in published crystal structures of RPO. We analyzed results from 33 of the 37 Bpa-substituted RNAPs that crosslinked most efficiently to DNA (see above). The RPO complexes used for crosslinking contained E. coli RNAP holoenzyme and the near-consensus promoter, rrnB con (Figures 1D, S1A). KMnO4 footprints with the Bpa-containing RNAPs indicated that all formed normal open complexes (Figures S1, S2A).
To identify promoter residues crosslinked by the Bpa residue in RNAP, the crosslinked complex was heat-denatured, a radiolabeled strand-specific primer was annealed to the DNA, and the primer was extended with Taq DNA polymerase (Figure 2A). Comparison of the length of the extension product to sequence markers on a high resolution polyacrylamide gel identified the promoter position where a crosslink impeded the DNA polymerase (Figure 2B). The representative gel shown in Figure 2B identified crosslinks by 7 different Bpa-substituted RNAPs to promoter positions from -21 to +13 on the template strand of rrnB con. Results from the other 26 Bpa-RNAPs are provided in Figure S2C and Table S2.
Figure 2. DNA Path in RPO Determined by Bpa Crosslinking and Computational Modeling Agrees with RNAP-DNA X-ray Structures.

(A) Schematic diagram of primer extension mapping of crosslinks to DNA. (B) Representative gel showing primer extension analysis using a primer annealing to the template strand. Lanes 1-4, sequencing ladder; lanes 5-11, extension products generated from crosslinks to the indicated Bpa-RNAP. (C-F) Surface representations of E. coli RNAP holoenzyme (Bae et al., 2013; PDB 4LJZ) with downstream fork-junction DNA (Zhang et al., 2012; PDB 4G7Z) in red ribbon (non-template strand DNA from -12 to +12 and template strand DNA from -4 to +12). The double-stranded DNA regions (blue ribbon) and single-stranded DNA regions (blue spheres) were positioned computationally using the crosslinks as constraints (see Experimental procedures). The E. coli RNAP and T. thermophilus RNAP coordinates from the PDB database were aligned, and the T. thermophilus RNAP was hidden from view. Residues in RNAP where Bpa substitutions crosslinked to promoter DNA are shown in orange and labeled. Labels of the Bpa residues used in the experiment in panel B are boxed. σ is tan, α, β, β′, and ω are gray. The wild-type amino acids are illustrated, not Bpa. (C-D) Overall views of RPO model rotated by ∼90°. Box in (D) indicates area sh own in close-ups in (E-F). Expanded view of single-stranded DNA and downstream duplex DNA. (E) β′ and σ70 are shown, but most of β is eliminated for clarity. (F) β is shown, but β′ and σ are eliminated for clarity. The complex is rotated 180° from the view in (E). T emplate strand positions -12 to -5 were not present in this crystal structure. Model was generated from footprinting and crosslinking data provided in Figure S2 and Table S2. Table S3 compares the DNA-RNAP interactions in our RPO model derived from Bpa crosslinking to those from the X-ray structure (Zhang et al., 2012). A few DNA positions are numbered for orientation purposes. Related to Figures S1, S2, and S5, and Tables S2 and S3.
A single primer extension band was observed for RNAPs containing Bpa substitutions at some positions, e.g. βR175 (Figure S2C panel 14), βR151 (S2C, 6), βQ148 (S2C, 5), or β′T212 (S2C, 34). However, there were often several primer extension products that differed by one or a few nucleotides (Figure 2B, lanes 5-11). The different length extension products could indicate that crosslinks to the same nucleotide can stop Taq DNA polymerase extension at multiple positions on the DNA, that one Bpa is able to sample and crosslink to multiple adjacent DNA positions, or that there are multiple slightly different conformations of the complex. As shown below, even when crosslinks mapped to several positions on the DNA, the resolution was sufficient to identify the path of DNA relative to the enzyme.
Identification of the residues in RNAP (shown in orange in Figures 2C-2F) and the promoter nucleotides to which they crosslinked (Figures 2A, 2B, S2) provided a set of distance constraints that reduced the number of possible paths of the DNA in the complex. The path was then optimized computationally to produce a model of RPO (see Experimental Procedures and Supplementary Methods; see Figure 2 legend for color coding). Figures 2C and 2D display the overall path of the double-stranded DNA in the complex (blue ribbon), and Figures 2E and 2F provide close-ups of the single-stranded regions (shown as blue spheres since we had little information about the orientation of different atoms within each nucleotide). The path of the DNA from the downstream fork-junction x-ray structure (Zhang et al., 2012) (red ribbon) is shown for comparison.
The trajectory, orientation, and rotational phasing of the double-stranded DNA downstream from the transcription bubble in the crosslinking-based model are essentially the same as in the downstream fork-junction crystal structure. However, the information from the crystal structures ends at +12 (Zhang et al., 2012; Zuo and Steitz, 2015), whereas data for our crosslinking-based model extends to +18. Our model is consistent with previous suggestions that positions in the β′ jaw (e.g. β′K1170 and β′M1189) come into very close proximity to double-stranded DNA downstream of +12 (Ederth et al., 2002; Drennan et al., 2012).
The path of the single-stranded portion of non-template strand DNA in our model is constrained by crosslinks from Bpa substitutions in the β2 domain (at βQ148, βR151, βR175, βR201, βR180, and βR394) and in σ2 (σT395, σK392, and σW434). Together, these crosslinks position the non-template strand in a very similar place to that observed in the crystal structure (Zhang et al., 2012) (Figures 2E and 2F).
The trajectory of the single stranded portion of the template strand in our crosslinking-based model is also in good agreement with existing crystal structures. The crosslinks from Bpa substitutions at βG1261, βA1263, βQ1264, or β′K334 to singlestranded template strand DNA from -4 to +2 of rrnB con constrain the path of the template DNA in our model, matching the path in the structure (Zhang et al., 2012) (Figures 2E-2F). The crosslinks from Bpa substitutions at σR436, σR465, σN461, σR397, σR448, βG1261, βA1263, β′D256, and βQ1264 to promoter positions -11 to -5 define the path of the upstream section of the template strand bubble and are consistent with models and a crystal structure that position the template strand in a protein tunnel formed primarily by β and σ (Hudson et al., 2009; Murakami et al., 2002b; Naryshkin et al., 2000; Zuo and Steitz, 2015).
Crosslinks from RNAPs to double-stranded DNA upstream of the transcription bubble (e.g. from σT552-Bpa to -38 and β′T48-Bpa to -17 and -18 on the non-template strand and from σT572-Bpa to -29 and β′T48-Bpa to -20 and -21 on the template strand) are consistent with the crystal structure of the open complex (Zuo and Steitz. 2015) and the structure of s4 bound to the -35 element DNA (Campbell et al., 2002). Our crosslinking–constrained computational model showed the expected close approach of the -35 hexamer to σ region 4.2. However, our model of this part of the complex did not replicate the precise path in the crystal structure, presumably because our program did not have the ability to deform double-stranded DNA.
We also built a crosslinking-based model of RPO containing rrnB C-7G, another rrnB P1 variant, and we generated data from RPO complexes containing two other promoters, λPR and lacUV5. The latter crosslinking datasets were not as extensive as that for rrnB C-7G, but the data for all 3 were consistent with the data for rrnB con and the crystal structure (Figures S4, S5 and data not shown).
We conclude that our Bpa-crosslinking approach is able to identify sites of promoter-RNAP interaction at individual amino acid and nucleotide resolution in solution and that the Bpa-crosslinking approach provides a means of determining the path of DNA in transcription initiation complexes. Below we report a Bpa crosslinking-based model of the path of DNA in an intermediate for which there is limited structural information, a scrunched” complex that forms during the process of promoter escape.
A Stable Scrunched Intermediate Complex Forms on rrnB C-7G
In order to determine the precise locations of the DNA bulges in a scrunched intermediate (RPITC), we added limiting combinations of substrate NTPs to a series of promoters (rrnB con, rrnB C-7G, λPR, lacUV5). Only rrnB C-7G formed a stable-enough RPITC upon addition of the initial substrates, ATP and CTP, to be useful for tracking the path of the DNA (Figure 3, S1, and data not shown).
Figure 3. Formation of open and initial transcribing complexes at the rrnB C-7G promoter.

(A) Sequence and footprinting summary of complexes formed by the rrnB C-7G promoter. rrnB C-7G differs from wild-type rrnB P1 at only one position, a C to G change 2 bp downstream from the -10 hexamer (Haugen et al., 2006). Transcription start site (arrow). The -35 and -10 hexamers are in red. ACCAC (green): expected transcript formed with ATP and CTP. Thymines reactive with KMnO4 in the absence (black asterisk) or presence (green asterisk) of ATP and CTP. Template strand region protected from DNase I in complexes formed with no ATP, CTP (RPo; black line) or with ATP, CTP (RPITC; green line). DNase I (B) or KMnO4 (C,D) footprints of complexes formed with or without ATP and CTP. Lanes 1, A+G sequence ladder. The DNA fragment was 3′ end-radiolabeled on the template strand (TS) or the non-template strand (NTS). (E) DNase I footprints of RPo formed with wild-type RNAP (lane 3) or RPITC5 formed with wild-type or BPA-containing RNAPs in the presence of ATP, CTP (lanes 4-11). Downstream edge of DNaseI footprints is at +16 for RPo (lane 3), or at +19 for RPITC5 (lanes 4-11). Footprinting data for the other 26 RNAPs analyzed are in Figure S3.
The rrnB C-7G complex with ATP and CTP had the properties of an initial transcribing complex (RPITC). The DNaseI protection boundary of the RP ITC extended further downstream than in RPO (to +19 instead of +16; promoter numbering in RPITC is relative to the transcription start site in RPO), consistent with the prediction that it should synthesize a 5-mer RNA with the sequence 5′-ACCAC-3′ under these conditions (Figure 3A; Chandrangsu, 2012; see also Borukhov et al., 1993). Therefore, we refer to this complex as RPITC5. The upstream DNaseI boundary of this complex was the same as in RPO (data not shown). Although the reactivities of template strand thymines to KMnO4 at -10, -8 and -7 were the same in RPITC5 and RPO, the non-template strand thymine at position +6 was reactive to KMnO4 in the presence of ATP and CTP but not in RPO (Figures 3C, D). Taken together, the DNase I and KMnO4 footprinting results suggest that 3 bp of DNA on both strands are pulled (scrunched) into the enzyme in RPITC5, thereby increasing the length of the unwound region. These results are fully consistent with the n-2 rule (see above and Revyakin et al., 2006).
Because the RNAPs used for the crosslinking studies are mutants (they contain a Bpa substitution), we confirmed that they made normal RPO and RPITC5 complexes on the rrnB C-7G promoter. Thirty-two of the 33 Bpa-substituted RNAPs tested exhibited RPITC5 footprints in the presence of ATP and CTP like WT RNAP (Figures 3E and S3). The remaining one, βG1261-Bpa, formed a mixture of RPO and RPITC5.
Mapping of Crosslinks Reveals the Positions of the DNA Bulges Formed During Scrunching
The set of Bpa-RNAPs used to characterize RPO were used to determine the path of DNA in the rrnB C-7G RPITC5 complex (with the exception of σT572-Bpa RNAP, which did not crosslink to rrnB C-7G). We also used 4 additional RNAPs with Bpa substitutions in the β2 domain (βE379, βA380, βS383, and βN387) in order to map the path of the non-template strand more precisely between -5 and -1, creating a library of 36 Bpa-RNAP crosslinks for DNA path modeling purposes (Figure S4).
For each RNAP, primer extension was used to monitor the positions of the crosslinked nucleotides on each strand, as described for RPO in Figure 2A. We expected three classes of primer extension patterns from comparison of the crosslinked positions in RPITC5 relative to those in RPO. (i) We predicted that formation of a 5-mer RNA should not change the promoter-RNAP interface upstream of the scrunched region so the crosslinks should be the same in RPO and RPITC5. (ii) We predicted that crosslinks downstream of the bulges in RPITC5 would involve the same RNAP residues as in RPO, but they would map ∼3 nt further downstream, reflecting the length of DNA pulled into the enzyme. (iii) We predicted that some DNA residues within the transcription bubble might form bulges that would crosslink to Bpa-RNAPs in RPITC5 but not in RPO.
Representative primer extension examples that displayed these predicted patterns are shown in Figures 4A and B. The crosslinking results for all 36 Bpa-substituted RNAPs are shown in Figure S4, summarized in Figure 5, and the crosslinks in RPO and RPITC5 are compared in Figures 4C and 4D. We inferred the precise locations of the bulges by determining which contacts are lost, maintained, or created in the scrunched complex.
Figure 4. Crosslink mapping localizes the scrunched DNA.

(A, B) Crosslinks on the non-template (A) or template (B) strands from representative Bpa-RNAPs to rrnB C-7G in the absence or presence of ATP and CTP (RPo or RPITC5) were mapped by primer extension. Crosslinks to DNA upstream of the scrunched region mapped to the same positions in RPo and RPITC5 (lanes 1 vs 2). Crosslinks to downstream duplex DNA were shifted by ∼3 positions in RPo vs RPITC5 (Lanes 5 vs 6, 7 vs 8). Novel crosslinks to portions of the transcription bubble in RPITC5 reflect DNA positions altered by scrunching (lanes 3 vs 4; 9 vs 10). Bulged regions are indicated by red bars along gel lanes in A, B. (C, D) Schematic diagrams of results from panels A, B, and Figure S4. (C) Crosslinks in RPO. Circles represent nucleotides, with crosslinked nucleotides colored-coded to match Bpa-RNAP positions (squares) to which they crosslink. Crosslinks are depicted by lines connecting nucleotides and RNAP residues. (D) Crosslinks in RPITC5. Lines represent crosslinks between nucleotides and RNAP residues in RPITC5, but nucleotides are colored as in RPO to illustrate that some of their positions with respect to RNAP have changed in RPITC5. Non-template strand nucleotides downstream of -3 and template strand nucleotides downstream of -7 move with respect to RNAP in the transition from RPO to RPITC5. Aqua nucleotides are within the non-template strand bulged region. Dark blue nucleotides are within the template strand bulged region. Green circles represent the 5 nt RNA made in the presence of ATP and CTP. Additional crosslinking data for the rrnB C-7G promoter are in Figure S4, and all crosslinking data are summarized in Table S2 and Figure 5.
Figure 5. Summary of rrnB C-7G RPO and RPITC crosslinking data.

Positions of crosslinks to the non-template strand (A) or the template strand (B) for each of 36 Bpa-RNAPs (listed to left of panels). β′T48-Bpa crosslinks to both strands. DNA sequences are shown above each panel. Crosslink positions in RPo (- A&C) and RPITC5 (+A&C) are illustrated by blue-shaded bars for each crosslinked nucleotide position. The fraction of crosslinking for each position is indicated by color shading intensity (key at bottom of figure). Crosslink patterns for RPO and RPITC5 are identical for positions upstream of the red dotted line (i.e. upstream of the scrunched bulges), become different between the red and blue dotted lines (the region containing the bulge), and are shifted by ∼3 nt downstream of the blue dotted lines (the region pulled into the enzyme after nucleotide addition). The data on which Figure 5 is based are shown in Figures 4, S4, and Table S2.
On the non-template strand, RNAP-DNA crosslinks whose positions remained unchanged in RPITC5 relative to RPO were observed for 5 Bpa-substituted RNAPs (σT552, β′T48, σW434, βE379, and βA380; Figures 4A, 5A), the most downstream of which were to DNA position -5 from βE379-Bpa and βA380-Bpa. Thus, the DNA bulge in the scrunched complex is downstream of -5 (indicated by the dotted red line in Figures 4D, 5A).
Crosslinks to the non-template strand in duplex DNA positions downstream of the transcription bubble were shifted downstream by ∼3 bp (e.g. from β′R1148 and β′M1189; Figure 4A, lanes 5-6 and 7-8). Other downstream positions that displayed this characteristic shifted pattern in RPITC5 vs RPO are shown in Figures 5A and S4B. These results are consistent with DNA being pulled into RNAP during synthesis of the 5 nt RNA. Since the last KMnO4-reactive nucleotide in RPITC5 is at +6 (corresponding to the second position after the end of the DNA-RNA hybrid, using the numbering for nucleotide positions in RPO), the single-stranded bulge must include or be upstream of position +6.
We next mapped the bulge in RPITC5 more precisely within the sequence between -4 to +6 on the non-template strand. Most importantly, βY62 did not crosslink to DNA in RPO, but it crosslinked to positions -2 to +1 in RPITC5, indicating that the locations of these DNA residues must have changed enough to come into the proximity of a new amino acid residue in RNAP (Figure 4D). Six other Bpa-substituted RNAPs (βR180, βS383, βN387, σT395, βR394, βR201) crosslinked to nucleotides within the interval -3 to +3 in both RPo and RPITC5, but these Bpa residues also crosslinked to additional nucleotides, 1 or 2 positions downstream (Figure 4A lanes 3-4; in Figure 5A). The gain of additional crosslinked DNA positions without loss of the crosslinks in RPO suggests that there is movement of these DNA positions relative to the enzyme. This pattern could reflect accessibility of multiple nucleotide residues in a single distorted scrunched state or alternative conformations of scrunched DNA in different molecules in the population. Taken together, these data suggest that the DNA region that bulges is from -3 to +3 on the non-template strand.
Four other Bpa-RNAPs crosslinked to positions -4 to +6 on the non-template strand in the rrnB C-7G promoter RPITC5 complex and not in the RPO complex (σK392, βQ148, βR175, βR151). These crosslinks could be bulge-specific on the rrnB C-7G promoter like those formed by βY62. However, we favor the interpretation that they reflect subtle differences in the open complexes formed by the rrnB C-7G and rrnB con promoters since, unlike βY62, these 4 Bpa residues crosslink to the RPO formed by rrnB con (Figure S2).
On the template strand, RNAP-DNA crosslinks from several Bpa-substituted RNAPs (e.g. β′T48, σR436, σR465, σN461, and σR448; Figures 4B, 5B) remained unchanged in RPITC5 relative to RPO, the most downstream of which was to DNA position -7 from σR448 (Figures 5, S4; boundary indicated by dotted red line in Figures 4D, 5B). Thus, the template strand bulge is most likely downstream of -7. Crosslinks were identified from Bpa residues at β′Q1326, β′K118, βK203, βH165, and β′T212 to residues on the template strand downstream of the bubble in RPO. These crosslinks were shifted downstream by ∼3 nt in RPITC5, as observed for Bpa-RNAPs that crosslinked to the non-template strand (see above). These results constrain the downstream boundary of the bulge to +6.
Template strand scrunched complex–specific crosslinks further localized the bulged residues. Since the bulge is single-stranded, it must be upstream of +1, the start of the RNA-DNA hybrid in RPITC5. βA837 crosslinked to nucleotides -6 to -3 only in RPITC5 (Figure 4B), consistent with the model that the bulge is bounded by residues -6 and the RNA-DNA hybrid starting at +1.
Four other Bpa-substituted RNAPs crosslinked to the region from -6 to -1 on the template strand (βQ1264, β′D256, βA1263, βG1261) and showed crosslinking patterns consistent with DNA bulging. First, 2 Bpa-substituted RNAPs showed single nucleotide shifts in crosslinking that indicated that the DNA was distorted nearby (βA1263 and β′D256, Figures 4B, 5). Second, RNAP containing a Bpa substitution for βQ1264 only crosslinked in RPO (predominantly to -6 to -4), indicating that template strand nucleotides -6 to -4 moved elsewhere in RPITC5 (Figure 5B). [The Bpa-containing enzyme that only produced crosslinks in RPO nevertheless formed RPITC5 footprints (Figure S3), indicating that the absence of crosslinking did not result from an enzyme unable to form the complex.] Taken together, these data indicate that the DNA bulge on the template strand in RPITC5 is somewhere between -6 and -1.
Model of RPITC5
We next computationally modeled the DNA path in RPITC5 by using all crosslinked amino acid-nucleotide pairs shown in Figure 5 as distance constraints (see Experimental Procedures and Supplementary Methods), and we compared the resulting RPITC5 model to the rrnB C-7G RPO model (Figure 6). The resulting model depicts the DNA-protein interfaces within the scrunched complex. The trajectory of upstream duplex DNA, the path of non-template single-stranded DNA from -10 to -3, and the path of the template single-stranded DNA from -10 to -7 are the same in the RPO and RPITC5 models (Figure 6). Furthermore, the trajectory of the downstream duplex DNA does not change, but the identities of the downstream nucleotides that interact with the enzyme are shifted by 3 positions in RPITC5 because the downstream DNA is pulled toward the enzyme (Figure 6A).
Figure 6. Computational Model of the DNA path in the scrunched complex RPITC5 based on crosslink data.

The model was constructed using an E. coli RNAP holoenzyme structure (Bae et al., 2013; PDB 4LJZ). (A) and (C) Two overviews of the RPO and RPITC5 models, rotated by ∼180 degrees. (B) and (D) Expanded views of regions with proposed locations of non-template strand (B) or template strand (D) bulges in the scrunched DNA. In (B), the small diagrams show that the view in (A) has been rotated to view the enzyme from the β′ side, and β′ and σ are hidden. In (D), the view from (C) is rotated 90 degrees and then β is sliced (grey areas) to reveal the main channel. RNAP subunits are white, except β1 is blue, β2 is purple, the β flap is cyan, the β′ clamp is pink, and the β′ lid is dark pink ribbon. σ70 is tan, with region 3.2 in dark tan. Amino acid positions where Bpa substitutions crosslinked to DNA are in orange. Upstream or downstream duplex DNA is shown in ribbon form, and single-stranded residues are shown as spheres (blue for RPO or red for RPITC5). The RNA 5-mer in RPITC5 is green (position aligned using X-ray structure (Basu et al., 2014).
The non-template strand bulge in RPITC5 is bounded by the crosslinks to position -5 from the Bpa substitutions at βE379 and βA380 on the upstream end in RPO and RPITC5 and to +7 from βR151 on the downstream end. The interaction of βY62-Bpa in β1 with the DNA bulge in our RPITC5 model accounts for the most obvious difference in the path of the non-template strand DNA in RPITC5 compared to RPO (Figure 6B). In summary, the model illustrates how 3 extra nucleotides of non-template strand DNA can be accommodated between the β1 and β2 domains in the scrunched intermediate (Figure 6B).
For the template strand in our RPITC5 model, the most obvious deviation from the path in RPO is the bulge that includes nucleotides -6 to -1, which brings the template strand closer to β-flap residue βA837 (Figure 6D). Switch region residue β′K334 approaches positions -1 to +3 in RPO but approaches positions +6 and +7 in the scrunched complex, whereas residues at the entrance to the template strand tunnel (σR436, σR465, σN461, and σR448) are near promoter positions -8 to -12 in both RPO and RPITC5. Thus, the template strand bulge occurs just upstream of +1, approaching the entrance to the RNA exit channel (junction of β′ lid, β flap, and σ3.2 in Figure 6D) rather than the entrance to the template strand tunnel.
In summary, our model localizes the DNA bulges within a scrunched complex containing a 5-mer RNA, indicates that they differ in their relative positions on the template vs non-template strands, shows that the non-template strand bulge projects into the space between the β1 and β2 domains, and suggests that the template strand bulge in RPITC5 is accommodated within the template strand tunnel rather than extruded at its entrance.
Discussion
We developed a crosslinking approach that defined the interfaces between RNAP and promoter DNA at amino acid and nucleotide resolution. Our crosslinking data for RPO were consistent with available structural information, validating the use of our library of Bpa-containing RNAPs to analyze RNAP-promoter transcription initiation intermediates for which there is little or no structural information. We then used this library to analyze the path of DNA during initial transcription, thereby mapping the location of the DNA bulges in scrunched complexes. We found that the template and non-template strand bulges within the transcription bubble in the scrunched complex are different numbers of nucleotides from the -10 hexamer. Furthermore, although the non-template strand bulge appears to be extruded to the enzyme surface, the template strand bulge is accommodated entirely within the template strand tunnel, at least in RPITC5. Its location may have implications for the mechanism of promoter escape.
The Non-template Strand Bulge
In the initial transcribing complex, our data indicate that a bulge on the non-template DNA strand, including but not limited to DNA positions -2 to +1, interacts with βY62 in RPITC5. The bulged region is downstream of the σ region 2.3, 2.4, and 1.2 interactions with the promoter and projects into the gap between the β1 and β2 domains. Because the space between β1 and β2 is accessible to solvent (Figure 6B), we suggest that the growing bulge in the non-template strand during early transcription can be accommodated without causing significant strain on the structure of the enzyme.
The location of the non-template strand bulge from positions -3 to +6 is consistent with a report that this region is deformable and becomes disordered when RNAP, in complex with a downstream fork-junction DNA, synthesizes a 6 nt RNA in crystallo (Basu et al., 2014). Our proposal that non-template DNA extrusion toward the enzyme surface would not create strain is consistent with the finding that introduction of a flexible linker into the non-template strand (thus potentially eliminating strain) does not affect promoter escape (Ko and Heyduk, 2014; Samanta and Martin, 2013). Furthermore, nicks in the non-template strand (thus reducing potential strain in promoter DNA) did not affect abortive synthesis, consistent with the model that non-template strand scrunching does not play a role in promoter escape (Samanta and Martin, 2013). Finally, we note that a relatively unstructured bulge extruded into bulk solvent could accommodate intramolecular base-pairing, pair with trans-acting regulatory RNAs, or interact with protein factors to increase or decrease the rate of promoter escape.
A Role for the Template Strand Bulge in Promoter Escape
The promoter specificity factor σ binds very tightly to core RNAP with region 3.2 (σ3.2) threading through the RNA exit channel, a channel formed by the β-flap and β′-clamp domains (Figure 7). The presence of σ3.2 in the exit channel was previously shown to be important for abortive transcription (Murakami et al., 2002a) and must be displaced at some point during productive transcription initiation. Structural studies suggest that the first 5 nt of RNA can be synthesized without clashing with the N-terminal portion of σ3.2, but each subsequent nucleotide addition would require movement of σ3.2 to prevent clash between the growing RNA and σ3.2 (Basu et al., 2014). It is still unclear how σ3.2 moves and is ultimately displaced from the RNA exit channel. Furthermore, it is unclear precisely how RNA synthesis and DNA scrunching contribute to the displacement of σ3.2.
Figure 7. Models for σ3.2 Displacement During Initial transcription.

Core RNAP (gray), σ regions 2 and 4 (tan), σ3.2 (brown), non-template DNA strand (light blue), template DNA strand (dark blue), RNA (green). The RNA exit channel is depicted as a tube composed of the β flap (cyan) and the β′ clamp (pink). (A) RPO. σ3.2 approaches the active site and is then threaded through the RNA exit channel. (B) The template strand impingement model for RPITC5. The 5′ end of the 5-mer RNA comes close to σ3.2. The template strand bulge approaches the entrance to the RNA exit channel and disrupts β flap-β′ clamp-σ3.2 interactions. (C) The template strand impingement model for longer initial transcripts (RPITC>5). The template strand (TS) bulge continues into the RNA exit channel as the bulge is pushed upstream by the growing RNA-DNA hybrid resulting in further disruption of β flap-β′ clamp-σ3.2 interactions. This impingement, along with growth of the RNA chain (green), could help displace σ3.2 from the RNA exit channel. (D) Template strand extrusion model for RPITC>5. As the RNA-DNA hybrid lengthens, the TS bulge is extruded out of the TS tunnel into bulk solvent, and the growing RNA chain (green arrow) continues σ3.2 displacement from the RNA exit channel (see Discussion). In C and D we do not mean to imply that σ is lost from the complex upon formation of a 5-mer, only that σ3.2 is displaced during promoter escape.
It has been proposed that the growing RNA provides the force to displace σ3.2 during initial transcription (Murakami et al., 2002a). We suggest here that the growing RNA may not supply the entire force. We show that the bulged DNA remains within the template strand tunnel upon formation of a 5-mer RNA and that the bulged DNA moves towards the base of the RNA exit channel. We suggest that impingement of the template strand bulge on the σ3.2-β flap-β′ clamp complex might alter interactions between them, thereby contributing to displacement of σ3.2. More specifically, this impingement could cause expansion of the RNA exit channel by favoring movement of the β′ clamp and/or the β flap. Alternatively, the bulge could destabilize the interaction of the β flap with the region of the β′ clamp domain termed the lid, which provides one of the major steric barriers to σ3.2 displacement. Disruption of the lid-flap interaction alone could be sufficient to allow σ3.2 displacement.
Thus, in contrast to the non-template strand bulge, we suggest that the template strand bulge plays a critical role in promoter escape. The concerted effects of the growing DNA bulge and the growing RNA on σ3.2 within the RNA exit channel together might provide the energy for promoter escape (Kapanidis et al., 2006; Straney and Crothers, 1987) (Figure 7B-D).
Our data are limited to an initial transcribing complex with a 5-mer RNA. When RNAs longer than 5 nucleotides are synthesized, the bulge has to move, since the RNA-DNA hybrid would occupy the space accommodating the bulged DNA in our model for RPITC5 (compare Figure 7B and 7C). As longer RNAs are synthesized, the bulge could continue to move towards, and into, the RNA exit channel where it could continue to play an active role in σ displacement (Figure 7C), or alternatively, as the length of RNA increases the bulge could be extruded out of the template strand tunnel into bulk solvent where it would no longer play an active role in σ displacement (Figure 7D). Distinguishing between these two models would require analysis of initial transcribing complexes with longer RNAs and thus larger bulges, but our attempts to identify stable complexes with RNAs longer than 5-mers have been unsuccessful thus far. We also note that the bulges likely are dynamic during the course of initial transcription, not at static locations corresponding to each single nucleotide addition. Our model of the positions of the bulges in RPITC5 represents a highly occupied state of this complex, but not necessarily the only state.
During initial transcription, many promoters go through rounds of synthesis and release of short RNA products (abortives) prior to escaping from the promoter. It is possible that formation of a 5-mer represents a critical juncture in the decision to make abortive vs productive transcripts. However, the exact length and distribution of abortive products likely depends on the network of DNA contacts and the energetic barriers to continued elongation of nascent transcripts at a particular promoter (Hsu et. al. 2003)
During initial transcription by Pol II in eukaryotes, similar intermediates may occur. The complex appears to have a similar architecture, with a promoter specificity factor, TFIIB, like σ in bacteria, occupying the RNA exit channel. As in initial transcribing complexes in bacteria, bubble expansion has been reported (Pal et al., 2005). By analogy to our model for E. coli transcription, we suggest that bubble expansion and impingement of the template strand bulge on TFIIB might help displace TFIIB from the RNA exit channel and facilitate promoter escape.
Prospect
The approach described here can be used to map the interface between many nucleic acid binding proteins and their DNA or RNA targets. This approach is especially useful for providing structural information about complexes that are recalcitrant to crystallographic analysis, as well as for confirming that structures formed in crystals are relevant to complexes in solution. We are currently using the library of Bpa-substituted RNAPs described here to map the interfaces between RNAP and promoters in other transcription initiation intermediates, namely the closed complex and the complex that forms in the presence of the transcriptional regulator DksA (Rutherford et al., 2009), the 6S RNA-RNAP interface (Cavanagh and Wassarman, 2014), and protein-protein interfaces formed by core RNAP and alternative σ factors.
Experimental Procedures
Materials
Table S1 contains strain and oligo information for creation of amber stop codon (TAG) mutations for Bpa incorporation, and Table S4 contains other E. coli strain, plasmid, and oligo information. Plasmids were constructed using standard procedures for cloning and mutagenesis and were verified by DNA sequencing.
Expression and Purification of Bpa-substituted Proteins
Bpa was incorporated into core RNAP and core RNAP was purified essentially as described in Lennon et al., 2012. (see Supplemental Experimental Procedures). To incorporate Bpa into σ70, DH10B cells were co-transformed with σ70 overexpression plasmid pRLG13105 (which codes for an N-terminal 10His-tag) or its derivatives and the plasmid coding for the amber suppressor tRNA and its evolved cognate tRNA synthetase. Cells were grown in LB with 1 mM Bpa at 30°, induced with 0.2% arabinose, and grown for 1.5 hr at 30°C before harvesting cells. σ70 and its derivatives were purified from cleared lysates using Ni-agarose affinity chromatography, followed by cleavage of the 10His-tag with PreScission protease (GE Healthcare), and Ni-agarose affinity chromatography. The flowthrough from the second Ni-agarose column was collected, concentrated, and exchanged into storage buffer (see Supplementary information).
Crosslinking
10 μl crosslinking reactions were performed by incubating a Bpa-RNAP (40 nM) with promoter DNA (either 2 nM negatively-supercoiled plasmid, 2 nM linear PCR-produced DNA, or ∼0.5 nM radiolabeled DNA fragment) in transcription buffer (10 mM Tris-Cl pH 8.0, 30 mM KCl, 10 mM MgCl2, 0.2 mg/ml BSA, 1 mM DTT) for 5 min at 37°. Sample tubes were placed directly onto the surface of handheld UV lamp and irradiated with 15 W 365 nm UV light for 10 min total (10 cycles of 1 min UV-irradiation and 1 min of water bath incubation).
Primer Extension Mapping of Crosslinks
Crosslinked samples (2 μl), or enriched crosslinked samples (see supplemental experimental procedures), were used as template in 12.5 μl primer extension reactions that also contained 1.25 units of Taq DNA polymerase (NEB), 1X Taq buffer (NEB), 250 μM of each dNTP, 2 M betaine, 5% DMSO, and ∼1 pmol of radiolabeled primer (5910 to monitor crosslinks to non-template strand and 5853 to monitor crosslinks to the template strand). Reactions went through 18 cycles of 30 σ at 95°C, 30 σ at 53°, and 30 σ at 72°. An equal vol of primer extension reaction and loading solution (8 M urea, 0.5X TBE, 0.05% bromophenol blue, 0.05% xylene cyanol) were mixed, and 5 μl was loaded onto a 40 cm, 9.5% acrylamide, 0.5X TBE, 7M urea gel, and electrophoresed for ∼2.5 hr at 2000 V. Gels were dried and analyzed by phosphorimaging.
Structure Modeling
The structure modeling involved the minimization of a function that consisted of two parts: 1) the sum of the distances between each crosslinked amino-acid nucleotide pair and 2) the degree of overlap between DNA and RNAP atoms. Minimization of the objective function thus brought all crosslinked amino acid-nucleotide pairs as close as possible without generating clash between the DNA and RNAP. Details are provided in Supplemental Experimental Procedures.
Footprinting
DNaseI and KMnO4 footprints were performed as described (Bartlett et al., 1998; Newlands et al., 1991). See Supplemental Experimental Procedures for details.
Supplementary Material
Highlights.
We report a high resolution method to define the DNA path in protein-DNA complexes
The non-template strand bulge in scrunched promoter complexes is surface extruded
The template strand bulge in the initial scrunched complex remains in the tunnel
We propose that template strand bulge-RNAP clash aids σ ejection and promoter escape
Acknowledgments
We thank Peter Schultz for the pSupT/BpF plasmid, C. Lennon, M. Bartlett, A. Didychuk for advice for advice on Bpa incorporation, crosslink mapping, and structure modeling, respectively, and R. Ebright, R. Landick, K. Wassarman, and J.D. Winkelman for comments on the manuscript. J.T.W. was supported by a Molecular Biosciences Training Grant from the NIH and by a fellowship from the Department of Bacteriology. Work in the Gourse/Ross lab is supported by NIH R37 GM37048.
Footnotes
Supplmental Information: Supplemental Information includes 6 figures, 4 tables, and Supplemental Experimental Procedures and can be found with this article at…
Author Contributions: JTW, JB, MFM, and AYC performed experiments, BTW performed the computational modeling, all authors contributed to the design and interpretation of the data, and JTW, WR, BTW, and RLG prepared the manuscript.
Publisher's Disclaimer: This is a PDF file of an unedited manuscript that has been accepted for publication. As a service to our customers we are providing this early version of the manuscript. The manuscript will undergo copyediting, typesetting, and review of the resulting proof before it is published in its final citable form. Please note that during the production process errors may be discovered which could affect the content, and all legal disclaimers that apply to the journal pertain.
References
- Bae B, Davis E, Brown D, Campbell EA, Wigneshweraraj S, Darst SA. Phage T7 Gp2 inhibition of Escherichia coli RNA polymerase involves misappropriation of σ70 domain 1.1. Proc Natl Acad Sci USA. 2013;110:19772–19777. doi: 10.1073/pnas.1314576110. [DOI] [PMC free article] [PubMed] [Google Scholar]
- Bartlett MS, Gaal T, Ross W, Gourse RL. RNA polymerase mutants that destabilize RNA polymerase-promoter complexes alter NTP-sensing by rrn P1 promoters. J Mol Biol. 1998;279:331–345. doi: 10.1006/jmbi.1998.1779. [DOI] [PubMed] [Google Scholar]
- Basu RS, Warner BA, Molodtsov V, Pupov D, Esyunina D, Fernández-Tornero C, Kulbachinskiy A, Murakami K. Structural basis of transcription initiation by bacterial RNA polymerase holoenzyme. J Biol Chem. 2014;289:24549–24559. doi: 10.1074/jbc.M114.584037. [DOI] [PMC free article] [PubMed] [Google Scholar]
- Borukhov S, Sagitov V, Josaitis CA, Gourse RL, Goldfarb A. Two modes of transcription initiation in vitro at the rrnB P1 promoter of Escherichia coli. J Biol Chem. 1993;268:23477–23482. [PubMed] [Google Scholar]
- Campbell EA, Muzzin O, Chlenov M, Sun JL, Olson CA, Weinman O, Trester-Zedlitz ML, Darst SA. Structure of the bacterial RNA polymerase promoter specificity sigma subunit. Mol Cell. 2002;9:527–539. doi: 10.1016/s1097-2765(02)00470-7. [DOI] [PubMed] [Google Scholar]
- Cavanagh AT, Wassarman KM. 6S RNA, a global regulator of transcription in Escherichia coli, Bacillus subtilis, and beyond. Annu Rev Micro. 2014;68:45–60. doi: 10.1146/annurev-micro-092611-150135. [DOI] [PubMed] [Google Scholar]
- Chandrangsu P. Ph D dissertation. 2012. Feedback regulation of a bacterial transcription regulator and the mechanism of transcription start site selection in Escherichia coli. [Google Scholar]
- Drennan A, Kraemer M, Capp M, Gries T, Ruff E, Sheppard C, Wigneshweraraj S, Artsimovitch I, Record MT. Key roles of the downstream mobile jaw of Escherichia coli RNA polymerase in transcription initiation. Biochemistry. 2012;51:9447–9459. doi: 10.1021/bi301260u. [DOI] [PMC free article] [PubMed] [Google Scholar]
- Ederth J, Artsimovitch I, Isaksson LA, Landick R. The downstream DNA jaw of bacterial RNA polymerase facilitates both transcriptional initiation and pausing. J Biol Chem. 2002;277:37456–37463. doi: 10.1074/jbc.M207038200. [DOI] [PubMed] [Google Scholar]
- Feklistov A, Darst SA. Structural basis for promoter-10 element recognition by the bacterial RNA polymerase σ subunit. Cell. 2011;147:1257–1269. doi: 10.1016/j.cell.2011.10.041. [DOI] [PMC free article] [PubMed] [Google Scholar]
- Haugen SP, Berkmen MB, Ross W, Gaal T, Ward C, Gourse RL. rRNA promoter regulation by nonoptimal binding of sigma region 1.2: an additional recognition element for RNA polymerase. Cell. 2006;125:1069–1082. doi: 10.1016/j.cell.2006.04.034. [DOI] [PubMed] [Google Scholar]
- Hsu LM, Vo NV, Kane CM, Chamberlin MJ. In vitro studies of transcript initiation by Escherichia coli RNA polymerase. 1. RNA chain initiation, abortive initiation, and promoter escape at three bacteriophage promoters. Biochemistry. 2003;42:3777–3786. doi: 10.1021/bi026954e. [DOI] [PubMed] [Google Scholar]
- Hudson BP, Quispe J, Lara-González S, Kim Y, Berman HM, Arnold E, Ebright RH, Lawson CL. Three-dimensional EM structure of an intact activator-dependent transcription initiation complex. Proc Natl Acad Sci USA. 2009;106:19830–19835. doi: 10.1073/pnas.0908782106. [DOI] [PMC free article] [PubMed] [Google Scholar]
- Jonkers I, Lis JT. Getting up to speed with transcription elongation by RNA polymerase II. Nat Rev Mol Cell Biol. 2015;16:167–177. doi: 10.1038/nrm3953. [DOI] [PMC free article] [PubMed] [Google Scholar]
- Kapanidis AN, Margeat E, Ho SO, Kortkhonjia E, Weiss S, Ebright RH. Initial transcription by RNA polymerase proceeds through a DNA-scrunching mechanism. Science. 2006;314:1144–1147. doi: 10.1126/science.1131399. [DOI] [PMC free article] [PubMed] [Google Scholar]
- Ko J, Heyduk T. Kinetics of promoter escape by bacterial RNA polymerase: effects of promoter contacts and transcription bubble collapse. Biochem J. 2014;463:135–144. doi: 10.1042/BJ20140179. [DOI] [PubMed] [Google Scholar]
- Krummel B, Chamberlin MJ. RNA chain initiation by Escherichia coli RNA polymerase. Structural transitions of the enzyme in early ternary complexes. Biochemistry. 1989;28:7829–7842. doi: 10.1021/bi00445a045. [DOI] [PubMed] [Google Scholar]
- Lennon CW, Ross W, Martin-Tumasz S, Toulokhonov I, Vrentas CE, Rutherford ST, Lee JH, Butcher SE, Gourse RL. Direct interactions between the coiled-coil tip of DksA and the trigger loop of RNA polymerase mediate transcriptional regulation. Genes Dev. 2012;26:2634–2646. doi: 10.1101/gad.204693.112. [DOI] [PMC free article] [PubMed] [Google Scholar]
- Mekler V, Kortkhonjia E, Mukhopadhyay J, Knight J, Revyakin A, Kapanidis AN, Niu W, Ebright YW, Levy R, Ebright RH. Structural organization of bacterial RNA polymerase holoenzyme and the RNA polymerase-promoter open complex. Cell. 2002;108:599–614. doi: 10.1016/s0092-8674(02)00667-0. [DOI] [PubMed] [Google Scholar]
- Murakami K, Masuda S, Darst SA. Structural basis of transcription initiation: RNA polymerase holoenzyme at 4 A resolution. Science. 2002a;296:1280–1284. doi: 10.1126/science.1069594. [DOI] [PubMed] [Google Scholar]
- Murakami K, Masuda S, Campbell EA, Muzzin O, Darst SA. Structural basis of transcription initiation: an RNA polymerase holoenzyme-DNA complex. Science. 2002b;296:1285–1290. doi: 10.1126/science.1069595. [DOI] [PubMed] [Google Scholar]
- Naryshkin N, Revyakin A, Kim Y, Mekler V, Ebright RH. Structural organization of the RNA polymerase-promoter open complex. Cell. 2000;101:601–611. doi: 10.1016/s0092-8674(00)80872-7. [DOI] [PubMed] [Google Scholar]
- Newlands JT, Ross W, Gosink KK, Gourse RL. Factor-independent activation of Escherichia coli rRNA transcription. II. Characterization of complexes of rrnB P1 promoters containing or lacking the upstream activator region with Escherichia coli RNA polymerase. J Mol Biol. 1991;220:569–583. doi: 10.1016/0022-2836(91)90101-b. [DOI] [PubMed] [Google Scholar]
- Pal M, Ponticelli AS, Luse DS. The role of the transcription bubble and TFIIB in promoter clearance by RNA polymerase II. Mol Cell. 2005;19:101–110. doi: 10.1016/j.molcel.2005.05.024. [DOI] [PubMed] [Google Scholar]
- Revyakin A, Liu C, Ebright RH, Strick TR. Abortive initiation and productive initiation by RNA polymerase involve DNA scrunching. Science. 2006;314:1139–1143. doi: 10.1126/science.1131398. [DOI] [PMC free article] [PubMed] [Google Scholar]
- Rutherford ST, Villers CL, Lee JH, Ross W, Gourse RL. Allosteric control of Escherichia coli rRNA promoter complexes by DksA. Genes Dev. 2009;23:236–248. doi: 10.1101/gad.1745409. [DOI] [PMC free article] [PubMed] [Google Scholar]
- Ryu Y, Schultz PG. Efficient incorporation of unnatural amino acids into proteins in Escherichia coli. Nat Methods. 2006;3:263–265. doi: 10.1038/nmeth864. [DOI] [PubMed] [Google Scholar]
- Samanta S, Martin CT. Insights into the mechanism of initial transcription in Escherichia coli RNA polymerase. J Biol Chem. 2013;288:31993–32003. doi: 10.1074/jbc.M113.497669. [DOI] [PMC free article] [PubMed] [Google Scholar]
- Spassky A. Visualization of the movement of the Escherichia coli RNA polymerase along the lacUV5 promoter during the initiation of the transcription. J Mol Biol. 1986;188:99–103. doi: 10.1016/0022-2836(86)90484-5. [DOI] [PubMed] [Google Scholar]
- Straney DC, Crothers DM. A stressed intermediate in the formation of stably initiated RNA chains at the Escherichia coli lacUV5 promoter. J Mol Biol. 1987;193:267–278. doi: 10.1016/0022-2836(87)90218-x. [DOI] [PubMed] [Google Scholar]
- Werner F, Grohmann D. Evolution of multisubunit RNA polymerases in the three domains of life. Nat Rev Microbiol. 2011;9:85–98. doi: 10.1038/nrmicro2507. [DOI] [PubMed] [Google Scholar]
- Zhang Y, Feng Y, Chatterjee S, Tuske S, Ho MX, Arnold E, Ebright RH. Structural basis of transcription initiation. Science. 2012;338:1076–1080. doi: 10.1126/science.1227786. [DOI] [PMC free article] [PubMed] [Google Scholar]
- Zuo Y, Steitz TA. Crystal structures of the E. coli transcription initiation complexes with a complete bubble. Mol Cell. 2015;58:534–540. doi: 10.1016/j.molcel.2015.03.010. [DOI] [PMC free article] [PubMed] [Google Scholar]
- Zuo Y, Wang Y, Steitz TA. The mechanism of E. coli RNA polymerase regulation by ppGpp is suggested by the structure of their complex. Mol Cell. 2013;50:430–436. doi: 10.1016/j.molcel.2013.03.020. [DOI] [PMC free article] [PubMed] [Google Scholar]
Associated Data
This section collects any data citations, data availability statements, or supplementary materials included in this article.