

Abstract
B-lymphopoiesis declines with age, and this decline not only correlates with increased adipose tissue in the bone marrow (BM), but also adipocyte-derived factors are known to inhibit B-lymphopoiesis. Using co-cultures of mouse BM cells with OP9 stromal cells, we found that adipocyte-conditioned medium (ACM) induces the generation of CD11b+Gr1+ myeloid cells which inhibit B-cell development in vitro. ACM-induced CD11b+Gr1+ cells express Arg1 (arginase) and Nos2 (iNos), and suppress CD4+ T-cell proliferation, indicating that these cells are myeloid-derived suppressor cells (MDSCs). Blocking arginase and iNos did not restore B-lymphopoiesis, indicating that inhibition is not mediated by these molecules. Transwell and conditioned-medium experiments showed that MDSCs inhibit B-lymphopoiesis via soluble factors, and by cytokine array we identified IL-1 as an important factor. Addition of anti-IL-1 antibodies restored B-lymphopoiesis in BM cultures containing MDSCs, showing that MDSC inhibition of B-lymphopoiesis is mediated by IL-1. By treating hematopoietic precursors with IL-1, we found that multipotent progenitors (MPP) are targets of IL-1. This study uncovers a novel function for MDSCs to inhibit B-lymphopoiesis through IL-1. We suggest that inflammaging contributes to a decline of B-lymphopoiesis in aged individuals, and further, that MDSCs and IL-1 provide therapeutic targets for restoration of B-lymphopoiesis in aged and obese individuals.
Introduction
B-cells and antibodies are essential for productive immune responses against infectious agents and vaccines. B-cell development initiates in the bone marrow (BM), where hematopoietic stem cells (HSC) differentiate to produce immature B-cells. HSC differentiation is dependent on the BM microenvironment where stromal cells provide B-lymphopoietic molecules IL-7, stem cell factor (SCF) and Flt3-L (1–5). In humans and mice B-lymphopoiesis continues throughout life, but declines in the mid and late stages of life (6, 7). In contrast, B-lymphopoiesis in rabbits arrests as early as two months of age (8, 9). By adoptively transferring hematopoietic progenitors from ~6-month-old rabbits into young rabbits, Kalis et al. (10) showed that the arrest of B-lymphopoiesis is likely due to changes in the BM microenvironment rather than to intrinsic changes in the progenitors. The loss of B-lymphopoiesis in rabbits correlates with an increase in adipose tissue in the BM, and we showed (11) that adipocytes generated from mesenchymal stem cells inhibit the development of B-cells in vitro. Similar inhibition of B-lymphopoiesis was observed with hematopoietic cells from human. The mechanism for this adipocyte-mediated inhibition of B-lymphopoiesis remains unknown.
Adipose tissue reportedly influences multiple aspects of the immune system (12–16), and in the context of aging, adipocytes accumulate in both the BM and thymus (17–22). Adipose tissue comprises up to 75% of the thymic microenvironment in healthy middle-aged individuals undergoing thymic decline (21), and the accumulation of adipocytes appears to contribute to thymic involution and the decline of T-lymphopoiesis (23). Adipose tissue is a source of “lipotoxic” danger signals that result in inflammation (23), and this sterile inflammation leads to decreased T-lymphopoiesis. Changes in hematopoiesis are also observed in obesity, as evidenced by increased myelopoiesis in obese mice (24), and increased myelopoiesis as well as decreased B-lymphopoiesis in mice fed a high fat diet (25).
The decline in B-lymphopoiesis as evidenced by decreased numbers of lymphoid progenitors and a concomitant increase in myelopoiesis in aging mice has been associated with both intrinsic defects in hematopoietic progenitors, and also in changes in the BM microenvironment (20, 26). Further, CD11b+Gr1+ myeloid cells, resembling MDSCs accumulate in BM of aged mice, and these cells have greater suppressive activity in T-cell proliferation assays than do CD11b+Gr1+ cells from young mice (27). Previously, we showed that by culturing human and rabbit BM cells on OP9 stromal cells in the presence of adipocyte-derived factors, the loss of B-lymphopoiesis was accompanied by an abundance of non-B-lineage cells (11). In the current study, we used mouse BM cells to investigate the nature of the non-B-lineage hematopoietic cells generated with adipocyte-derived factors. We show that these adipocyte-derived factors drive the development of MDSCs, and also that the MDSCs directly inhibit B-lymphopoiesis. Further, we report that MDSC-mediated inhibition of B-lymphopoiesis is not dependent on arginase and iNos, key mediators of T-cell suppression by MDSCs, but instead, is mediated by IL-1. Our study identifies a novel function for MDSCs in the regulation of hematopoiesis, and identifies MDSCs and IL-1 as therapeutic targets for restoring B-lymphopoiesis in aged and obese individuals.
Materials and Methods
Mice, reagents, and flow cytometry
C57BL/6 founder mice were from Jackson Laboratories (Bar Harbor, ME). Mice were used in accordance with protocols approved by the Loyola University Chicago Institutional Animal Care and Use Committee. All base media and supplements were from GIBCO (Grand Island, NY). Antibodies to murine B220 (RA3-6B2), CD19 (6D5), CD11b (M1/70), Gr1 (RB6-8C5), CD14 (Sa14-2), CD3ε (145-2C11), CD4 (GK1.5), CD8a (53–6.7), TER-119 (TER-119), CD49b (DX5), CD16/32 (93), CD28 (37.51), Ly6C (HK1.4), and Ly6G (1A8), Sca1(D7), CD117 (2B8), CD127 (SB/199), CD135(A2F10), IL-1α (BLa-89), and IL-1β (B122) were from Biolegend (San Diego, CA). Dead cells were excluded from flow cytometic analyses using BD Horizon fixable viability stain (BD Biosciences, San Jose, CA). Cells were analyzed on the Canto II or LSR Fortessa flow cytometers; cell sorting was performed on a FACSAria cell sorter (BD Biosciences San Jose, CA). Analyses were performed using FlowJo software (Tree Star Ashland, OR). Murine recombinant IL-7, stem cell factor (SCF), Flt3-Ligand (Flt3-L), IL-1α, IL-1β, IL-13, granulocyte-colony stimulating factor (G-CSF), KC, monocyte chemotactic protein-1 (MCP), macrophage inflammatory protein-1α (MIP-1α), macrophage inflammatory protein-1β (MIP-1β), and Regulation upon Activation Normal T-cell Express Sequence (RANTES) were purchased from Peprotech (Rocky Hill, NJ).
Generation of adipocyte-conditioned medium (ACM) and MDSC-conditioned medium (MDSC-CM)
Pre-adipocyte cells (3T3.L1), generously provided by Dr. Neil Clipstone (Loyola University Chicago), were differentiated into adipocytes with 1μM dexamethasone, 0.5mM isobutylmethylxanthine (Sigma Aldrich, St. Louis, MO), and insulin (10μg/ml) (GIBCO, Grand Island, NY) as described (28). After differentiation, adipocytes were washed 2 times and after 72 hr incubation in serum-free DMEM (with 1% penicillin/streptomycin [P/S]), conditioned medium (ACM) was harvested. MDSC-conditioned medium (MDSC-CM) was obtained from 72 hr cultures of flow cytometry-sorted ACM-generated CD11bhiGr1+ MDSCs (100,000 cells/well) in serum-free αMEM containing P/S, gentamycin, and fungizone in 48 well plates.
B-lymphopoiesis cultures
B-lymphopoiesis assays were performed in αMEM with 10% FCS, 0.5% P/S, 0.5μg/ml fungizone, 30μg/ml gentamycin, and 10 ng/ml murine IL7, SCF, and Flt3-L (Peprotech, Rocky Hill, NJ). OP9 BM stromal cells were plated in 96 well microtiter plates (1,000 cells per well) or 24 well plates (5,000 cells per well). After 24 hr, B220− BM cells (depleted with autoMACS Pro separator [Miltenyi, Auburn, CA]) were plated in 96 well microtiter plates (30,000–40,000 cells/well) or 24 well plates (120,000–500,000 cells/well) with or without ACM (1:6 dilution) or MDSC-CM (1:3 dilution) in the presence of IL-7, SCF, and Flt3-L. For transwell studies, ACM-derived MDSCs were plated above the B220+ BM cells in a transwell. Cultures were fed on day 4 with fresh medium and cytokines. On day 7, cells were counted and stained for flow cytometry. Nω-hydroxy-nor-Arginine (Nor-NOHA) (0.3 mM) and L-NG-monomethyl Arginine (L-NMMA) (0.3mM) were used to block arginase and iNos respectively. D-NG-monomethyl Arginine (D-NMMA) was used as a negative control compound to assess off target effects of L-NMMA. To neutralize IL-1, anti-IL-1α and anti-IL-1β (1μg/ml each) were added at the start of cultures. Similar results were seen using anti-IL-1α + anti-IL-1β (1μg/ml each) + human IL-1R antagonist (1μg/ml) to block IL-1. To identify progenitor targets of IL-1, 500–1000 HSCs, MPPs, or CLPs were plated on OP9 cells as described above. Lin− cells were defined as B220−CD3ε−CD8a−CD11b−TER−119−Gr−1−CD49b−. For experiments containing ACM or MDSC-CM, data are representative of at least three different conditioned media.
qRT-PCR
RNA was isolated from flow cytometry-sorted CD11b+Gr1+ cells using Trizol Reagent (Invitrogen, Carlsbad, CA), and cDNA was prepared. PCR reactions were performed on a C1000 thermal cycler with CFX96 real-time detection system (Biorad, Hercules, CA) using the following primers: Arg1: 5′-AGACCACAGTCTGGCAGTTG-3′ and 5′-CCACCCAAATGACACATAGG-3; Nos2: 5′-CAGCTGGGCTGTACAAACCTT-3′ and 5′-CATTGGAAGTGAAGCGTTTCG-3′. Actb (β-actin): 5′-GGCTGTATTCCCCTCCATCG -3 and 5′-CCAGTTGGTAACAATGCCATGT -3. Expression of Arg1 and Nos2 was normalized to β-actin expression and data are presented relative to CD11b+Gr1+ cells isolated from cultures without ACM.
T-cell Proliferation assay
C57BL/6 splenocytes were stained with carboxyfluorescin diacetate succinimidyl ester (CSFE) (5μM) or cell trace violet (CTV) (5μM) and cultured in modified RPMI1640 with 10% FCS. CFSE-labeled splenocytes (250,000 or 300,000 cells/well) were plated in 96 well microtiter plates coated with anti-CD3 and anti-CD28 antibodies. ACM-generated CD11bhi Gr1+ effector or CD19+ negative control cells (12,500 to 100,000 cells/well) were added and cells were stained on day 4 with anti-CD4 antibody; dilution of CSFE was analyzed by flow cytometry. In cultures where arginase and iNos were inhibited, nor-NOHA (0.3 mM) and L-NMMA (0.3 mM) were added to block arginase and iNos activity respectively.
Cytokine Array
Bio-Plex Pro mouse cytokine 23-plex assay was performed to test for concentrations of 23 cytokines in MDSC-CM or Control-CM. Three MDSC-CM samples and two control-CM samples, generated in independent experiments, were assayed. The cytokines assessed in CM were: IL-1α, IL-1β, IL-2, IL-3, IL-4, IL-5, IL-6, IL-9, IL-10, IL-12(p40), IL-12(p70), IL-13, IL-17A, G-CSF, GM-CSF, IFN-γ, KC, MCP, MIP-1α, MIP-1β, RANTES, eotaxin, TNF-α. Cytokines not shown in Fig. 4 did not show differences between MDSC-CM and control-CM.
Figure 4. Inhibition of B-lymphopoiesis by MDSC soluble factor(s).

(A) Number or B220+ cells resulting from B-lymphopoiesis cultures containing ACM-generated MDSCs (CD11bhi Gr1+) or control CD11b+Gr1+ cells, with or without 0.3mM L-NMMA, D-NMMA, and/or Nor-NOHA. (B&C) Percentage of proliferating (B) CD4+ or (C) CD8+ splenocytes after in vitro activation with anti-CD3 and anti-CD28 cultured with (or without) ACM-generated MDSCs in the presence (or absence) of L-NMMA & Nor-NOHA (0.3mM). (D) Number of B220+ cells in B-lymphopoiesis cultures without MDSCs (■); with MDSCs (□); or with MDSCs in transwell (
 ). (E–J) B-lymphopoiesis assays performed in the presence (or absence [untreated]) of MDSC-conditioned medium. Flow cytometric analysis (E – H) of cells stained with (E and G) anti-B220 and anti-CD19, or (F and H) with anti-Gr1 and anti-CD11b; Number of (I) B220+ cells or (J) CD11b+Gr1+ cells resulting from these cultures. Error bars show average of triplicate wells ± SD. Data are representative of three independent experiments, except for D which is representative of two experiments. Statistical significance for data in panel A were analyzed by ANOVA in combination with Dunnet’s multiple comparison test; p<0.0001. Data in B–D were analyzed by ANOVA in combination with Bonferroni’s multiple comparison test; p=0.001, p=0.003; p<0.0001, respectively. Similar statistical significance was found in each of two or three independent experiments.
Statistical Analysis
Data were obtained in triplicate and are presented as the means ± SD. Statistical significance was determined as indicated in figure legends by either unpaired two-tailed Student’s t test or analysis of variance (ANOVA) in combination with Dunnet’s or Bonferroni’s test for multiple comparisons using Prism software (GraphPad Software; La Jolla, Ca). * P≤0.05, ** P≤0.01, *** P≤0.001, **** P≤0.0001
Results
In vitro generation of MDSCs by adipocyte-derived soluble factors
In vitro development of B-lineage cells from human and rabbit BM is inhibited by ACM (11). We tested whether ACM also inhibits B-lymphopoiesis of mouse BM cells in vitro, when cultured on OP9 stromal cells (29). As previously reported for human and rabbit BM cells (11), only a few B-lineage (B220+) cells developed from mouse BM cells cultured with ACM (Fig. 1B [compared to A] & E), indicating that mouse BM progenitors are also susceptible to ACM-mediated inhibition of B-lymphopoiesis. Most cells (~83%) generated in the ACM-treated cultures were CD11b+Gr1+ (Fig. 1D, F), whereas less than 10% (26% of B220− cells) of these were present in untreated cultures (Fig. 1B). The CD11b+Gr1+ cells from the ACM-treated cultures were CD11bhi, and were larger and more granular (Fig. 1G) than CD11b+Gr1+ cells from untreated cultures. We conclude that adipocytes promote the accumulation of CD11bhiGr1+ cells.
Figure 1. Effect of adipocyte-conditioned medium (ACM) on murine B-lymphopoiesis in vitro.

Flow cytometric analysis of mouse BM cells after 7 days in culture on OP9 cells with or without (untreated) ACM. (A&C) B220 and CD14; (B&D) Gr1 and CD11b staining of B220− cells. (E&F) Number of cells: (E) B220+ cells; (F) CD11b+Gr1+ cells; (G) Expression of CD11b, FSC, and SSC of CD11b+Gr1+ cells from cultures with (ACM) or without (NT) ACM. Data are representative of three independent experiments. In E&F, significance was determined using Student’s T test. Error bars show the average of triplicate wells ± SD. Similar statistical significance was achieved in of the three additional experiments.
CD11b and Gr1 are markers for myeloid progenitor cells, typically found in the BM. In pathology and aging, some CD11b+Gr1+ cells known as myeloid-derived suppressor cells are found (30). We hypothesized that the CD11bhiGr1+ cells found in cultures containing adipocyte factors were MDSCs. We FACS-sorted these cells and used qRT-PCR to test for expression of Arg1 (arginase) and Nos2 (iNos), genes expressed by MDSCs29. We found that Arg1 and Nos2 were expressed at levels 150 to 200 fold higher than in CD11b+Gr1+ cells from untreated (-ACM) cultures (Fig. 2A); as a negative control, essentially no expression of Arg1 or Nos2 was detected in purified CD19+ B-lineage cells (negative control). We also tested if the CD11bhiGr1+ cells obtained from ACM cultures suppressed T-cell proliferation, as expected for MDSCs (30), by culturing them with CFSE-labeled splenocytes in a T-cell proliferation assay. The percent of proliferating CD4+ T-cells was significantly decreased compared to control cultures (46.2% vs. 90%) (Fig. 2B), indicating that ACM-derived CD11b+Gr1+ cells functionally suppress T-cell proliferation in vitro. These data together with the high expression of arginase and iNos lead us to conclude that adipocyte factors generate CD11bhiGr1+ MDSCs.
Figure 2. Functional characteristics of ACM-derived CD11b+Gr1+ cells.
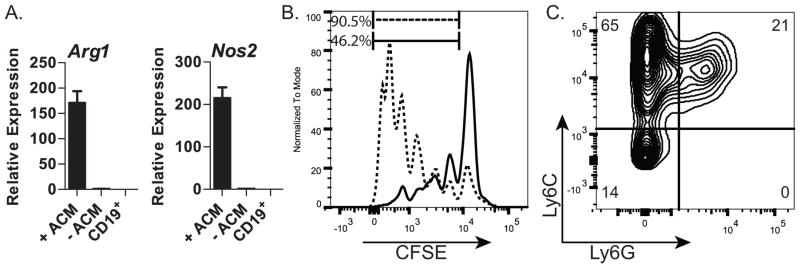
(A) qRT-PCR analysis of Arg1 and Nos2 in sorted CD11b+Gr1+ cells from cultures treated with (+ACM) or untreated (-ACM). CD19+ cells were used as a negative control; (B) Flow cytometric profile of activated, CSFE-labeled CD4+ splenocytes cultured in the presence of ACM-generated CD11bhiGr1+ cells (—) or control cells (CD19+) (- - -); (C) Flow cytometric analysis of CD11b+ cells resulting from ACM-treated cultures for expression of Ly6C and Ly6G; Data in A are representative of two independent experiments. Data in B&C are representative of three independent experiments. Error bars show the average of triplicate wells ± SD.
MDSCs are classified as monocytic or granulocytic based on expression of Ly6C and Ly6G (31). By using flow cytometry we found that most (~65%) of the MDSCs generated by the adipocyte factor(s) were Ly6C+Ly6G− (Fig. 2C), characteristic of the monocytic subset; approximately 21% of these cells were Ly6C+Ly6G+ corresponding to the granulocytic subset (30, 31). We conclude that the MDSCs generated in vitro by adipocyte-derived factors are primarily monocytic.
Inhibition of B-lymphopoiesis by MDSCs
MDSCs are suppressive in nature, leading us to hypothesize that the MDSCs generated by ACM are responsible for the inhibition observed in ACM-treated BM cultures. We tested this possibility by isolating CD11bhiGr1+ MDSCs from ACM-treated BM cultures and adding them directly to B-lymphopoiesis cultures. Almost no B220+ B-lineage cells developed in these cultures, whereas the addition of CD11b+Gr1+ cells obtained from untreated BM cultures did not affect B-lymphopoiesis (Fig. 3). We conclude that MDSCs potently inhibit B-lymphopoiesis.
Figure 3. Inhibition of B-lymphopoiesis by MDSCs.
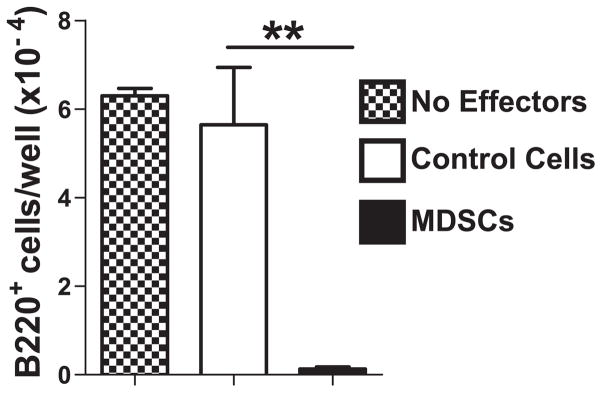
Number of B220+ cells in B-lymphopoiesis cultures to which CD11b+Gr1+ effector cells were added: no effectors (
); 5,000 control cells isolated from untreated cultures (□) or 5,000 MDSCs from ACM-treated (■) cultures. Data are representative of three independent experiments. Error bars show the average of triplicate wells ± SD. Similar statistical significance was achieved in each of the three experiments.
The best known effectors of MDSC-mediated suppression are arginase and iNos, both of which use L-arginine as a substrate and effectively deplete L-arginine from the environment (32). We tested if arginase and/or iNos are responsible for MDSC-mediated inhibition of B-lymphopoiesis by culturing BM cells with MDSCs in the presence or absence of the inhibitors L-NMMA, Nor-NOHA, or L-NMMA & Nor-NOHA to block iNos, arginase, or both respectively. Surprisingly, the inhibitors did not restore B-lymphopoiesis in the presence of MDSCs (Fig. 4A). To ensure that the inhibitors were functional, we showed that they could restore T-cell proliferation in cultures containing MDSCs (Fig. 4B–C). We conclude that while the suppression of T-cell proliferation by MDSCs is dependent on arginase and iNos, the inhibition of B-lymphopoiesis by MDSCs is not mediated by arginase and iNos.
We next tested if the inhibition of B-lymphopoiesis by MDSCs requires cell-cell contact using a transwell culture system. As we found when MDSCs were cultured directly with BM progenitors, we found very few B220+ B-lineage cells in the transwell cultures (Fig. 4D), indicating that MDSC-mediated inhibition of B-lymphopoiesis is not contact dependent. Further, conditioned medium from MDSC cultures (MDSC-CM) inhibited B-lymphopoiesis (Fig. 4E,G,I), revealing that an MDSC-derived soluble factor(s) is sufficient for inhibition. Most of the cells that developed in the MDSC-CM cultures were CD11b+Gr1+ myeloid lineage cells (Fig. 4J), showing that MDSCs not only secrete an inhibitory factor(s) for B-lymphopoiesis, but also a factor(s) that promotes the development/survival of myeloid lineage cells.
To identify the factor(s) produced by MDSCs that inhibits B-lymphopoiesis, we performed a cytokine array. We found a trend toward increased levels of nine inflammatory cytokines in MDSC-CM: IL-1α, IL-1β, IL-13, G-CSF, KC, MCP, MIP-1α, MIP-1β, RANTES (Fig. 5). The amount of IL-12(p40) and IL-9 appeared decreased in MDSC-CM, and no difference was observed for eotaxin (Fig. 5). Several cytokines were undetectable (IL-2, IL-3, IL-5, and GM-CSF) or at levels less than 10pg/ml (IL-2, IL-4, IL-6, IL-10, IL-12(p70), IL-17, TNFα, and IFNγ) and were not pursued further. We added each of the nine upregulated cytokines (recombinant) to bone marrow cultures and found that only IL-1α and IL-1β inhibited B-lymphopoiesis (Fig. 6A). The combination of all seven cytokines other than IL-1α and IL-1β did not inhibit B-lymphopoiesis (Fig. 6B) indicating that IL-1α and IL-1β are the major inhibitory factors in MDSC-CM. The inhibition assay was performed with 1 ng/ml recombinant cytokines, and because the level of natural IL-1 by the cytokine assay was only ~20 pg/ml, we titrated the amount of recombinant IL-1 needed for inhibition. We found ~30% inhibition by 10 pg/ml of recombinant IL-1 (data not shown), indicating to us that the inhibition by IL-1 is specific. We confirmed the inhibitory activity of IL-1 by adding anti-IL-1α and anti-IL-1β antibodies (or isotype control antibodies) to B-lymphopoiesis cultures containing MDSCs, and finding that B-lymphopoiesis was restored, as evidenced by the large number of B-lineage cells compared to isotype control cultures (Fig. 6C). We conclude that IL-1α and IL-1β are the major inhibitory factors produced by MDSCs leading to the loss of B-lymphopoiesis.
Figure 5. Cytokine array analysis of MDSC-derived soluble factors.

(A–L) Concentration of (A) IL-1α, (B) IL-1β, (C) IL-13, (D) G-CSF, (E) IL-12(p40), (F) IL-9, (G) eotaxin, (H) KC, (I) MCP, (J) Mip-1α, (K) Mip-1β, (L) RANTES, in MDSC-CM or control conditioned medium. Data were obtained from MDSC-CMs generated in three independent experiments and two control conditioned media generated in independent experiments. Error bars show the average of the two or three independent experiments ± SD. ND = not detected.
Figure 6. Identification of inhibitory factors produced by MDSCs.

(A&B) Number of B220+ cells in B-lymphopoiesis cultures treated with the 1ng/ml of the indicated cytokines. (C) Number or B220+ cells in B-lymphopoiesis cultures treated with MDSCs, in the presence of anti-IL-1α and anti-IL-1β (1μg/ml each) or isotype control. Data are representative of three independent experiments. Error bars show the average of triplicate wells ± SD. Statistical significance for data in panel A were analyzed by ANOVA in combination with Dunnet’s multiple comparison test; p<0.0001. Data in B–C were analyzed by ANOVA in combination with Bonferroni’s multiple comparison test; p<0.0001 and p=0.001, respectively. Similar statistical significance was found in each of the three independent experiments.
Hematopoietic progenitors targeted by IL-1
B220 is first expressed on pre-pro B-cells (1, 33), and because we find essentially no B220+ cells in BM cultures inhibited by IL-1, we thought that IL-1 inhibits B-lymphopoiesis at a stage prior to the pre-pro B-cell stage (Fig. 7A). To determine if IL-1 inhibits at the CLP→pre-pro B, the MPP→CLP, or the HSC→MPP stage, we FACS-sorted CLPs (Lin−CD127+CD117loSca1loFlt3+), multipotent progenitors MPP (Lin−Sca1+CD117+CD135+), and hematopoietic stem cells HSC (Lin−Sca1+CD117+CD135−), and cultured them on OP9 cells in the presence of IL-1β. By flow cytometry, no inhibition of B-lineage cells was observed in cultures of CLPs supplemented with IL-1β (Fig. 7B–C). These CLP cultures did however, have an increase in CD11b+Gr1+ myeloid cells (Fig. 7C), consistent with the finding that under appropriate conditions, CLPs have some myeloid potential (34). We conclude that differentiation of CLPs to B-lineage cells is unaffected by IL-1β. In contrast, differentiation of MPPs to B-lineage cells was significantly inhibited by IL-1 (Fig. 7D–E). These MPP cultures contained significantly more CD11b+Gr1+ myeloid cells than cultures without IL-1β (Fig. 7E), suggesting that MPPs are a target of IL-1β. Similarly, addition of IL-1β to cultures of purified HSCs contained significantly fewer B-lineage cells and more CD11b+Gr1+ myeloid cells than cultures without IL-1β (Fig. 7F–G). Consistent results were also seen when treating progenitor cultures with IL-1α or MDSC-CM. We conclude that IL-1 inhibits the differentiation of MPPs (and HSCs) to the B-lineage, and promotes their differentiation to the myeloid lineage.
Figure 7. Hematopoietic progenitor targets of IL-1.

B-lymphopoiesis cultures of BM-purified (B&C) CLPs, (D&E) MPPs, or (F&G) HSCs containing 1ng/ml IL-1β. (B, D, & F) Flow cytometry plots displaying B220 and CD19 staining. (C, E &G) Number of B220+ cells and CD11b+Gr1+ cells. Data are representative of three independent experiments. Error bars show the average of triplicate wells ± SD. Similar statistical significance was found in each of the three independent experiments.
Discussion
We previously showed that ACM inhibits the generation of human and rabbit B-lineage cells in BM cultures (11). Here, we showed that ACM also inhibits the generation of mouse B-lineage cells. Because numerous reagents are available for studying mouse, we used mouse BM cultures to explore the mechanism of the inhibition of B-lymphopoiesis. We report that ACM induces the development of MDSCs, and that these cells can directly inhibit B-lymphopoiesis (Fig. 8). The inhibition of B-lymphopoiesis by MDSCs is not due to arginase or iNos, but instead to IL-1, which inhibits B-lymphopoiesis prior to the CLP stage. IL-1 not only inhibited B-lymphopoiesis, but it also promoted myelopoiesis as evidenced by the increase in CD11b+Gr1+ cells in cultures of MPP cells treated with IL-1. Whereas MDSCs are well known for the capacity to suppress T-cell responses by using arginase and iNos (30), we show that MDSCs, at least those induced by adipocytes, not only have a previously unrecognized capacity to inhibit B-lymphopoiesis, but also to use IL-1 as the inhibitory molecule.
Figure 8. Model: Inhibition of B-lymphopoiesis by Adipocytes and MDSCs.
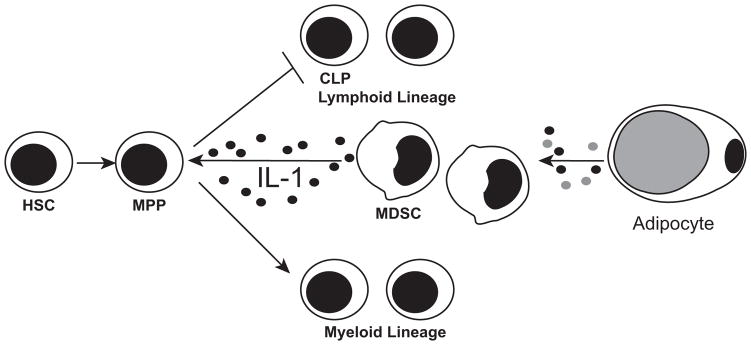
Adipocytes secrete a factor(s) that promotes the generation of MDSCs. MDSCs then produce IL-1, which results in the loss of B-lymphopoiesis prior to the CLP stage. Instead, IL-1 promotes MPPs to differentiate into myeloid lineage cells.
Extrinsic regulation of B-lymphopoiesis
Aged humans, mice, and rabbits display a decline in B-lymphopoiesis (7, 9, 10, 35–40), which results in lower output of naïve B-lymphocytes into the periphery. Whether the decline in B-lymphopoiesis is due to intrinsic defects in hematopoietic progenitors or to microenvironmental changes has been the subject of numerous investigations (26, 40–44). Stephan et al. (37) showed that pro-B-cells were affected by age, being less responsive to IL-7. Further, Rossi et al. (45) observed that aged HSCs exhibit down-regulated expression of lymphoid-specific genes, and up-regulated expression of myeloid lineage genes. Experiments to track the lineage potential of aged HSCs into young irradiated recipients yielded conflicting results. Sudo et al. (46) found the development of myeloid lineage cells, but no B-lineage cells, suggesting that hematopoietic progenitors in BM of young and old mice are intrinsically different. However, in other adoptive transfer studies using BM or HSCs from old mice into young irradiated hosts, development of B-lineage cells appeared normal (26, 47, 48). The intrinsic changes reported in aged progenitors could be due to age-related changes in the BM microenvironment. For example, Labrie et al. (44) showed that whereas pro-B-cells from aged BM have reduced V(D)J recombinase activity, after the transfer of aged BM cells into young recipients, V(D)J recombination was restored. Further evidence that the defect in V(D)J recombination was due to the environment was shown by the transfer of HSCs from young mice into aged recipients, after which V(D)J recombinase activity was lost. Because B-lymphopoiesis in rabbit declines by 2 months of age, and transfer of aged rabbit BM into young recipients leads to development of B-lineage cells (10), we think that, at least in rabbit, B-lymphopoiesis declines primarily as a result of changes in the BM microenvironment.
The decline of B-lymphopoiesis in rabbit is accompanied by an increase in adipose tissue (11), and ACM inhibits the generation of rabbit B-lineage cells in vitro. Here, using mice, we show that ACM induces MDSCs, which secrete IL-1 and inhibit B-lymphopoiesis in vitro. MDSCs are reportedly increased in the BM of aged mice (27), and we suggest MDSCs accumulate in rabbit BM by 2 months of age, and are in part responsible for the decline in B-lymphopoiesis in rabbits. The inhibition by MDSC-derived cytokine IL-1 is reminiscent of a study by Ratliff et al. (49) which showed that B-lymphopoiesis can be negatively impacted by aged B-cells, which produce the cytokine TNF. These studies combined with studies showing that IL-6 inhibits B-lymphopoiesis (50, 51), suggest that inflammatory cytokines characteristic of inflammaging (52, 53) may be a mechanism by which B-lymphopoiesis is regulated. It will be important to determine if, in vivo, increased fat in rabbit BM leads to increased numbers of MDSCs and decreased B-lymphopoiesis due to IL-1.
Hematopoietic Target of IL-1
Although IL-1 was known to inhibit B-lymphopoiesis in vitro (54, 55), the hematopoietic target of IL-1 was not previously identified. We found that CLPs are only modestly affected by IL-1, but that IL-1 drives MPPs and HSCs toward myelopoiesis. While IL-1 has been reported to directly expand HSCs (56), we do not know if the inhibition of B-lymphopoiesis by IL-1 treatment of HSCs is directly due to its effect on HSCs or on MPPs that differentiated from the HSCs. IL-1 not only acts on myeloid progenitors to promote myelopoiesis (24), but it is also known to act on stromal cells to produce G-CSF, M-CSF, and GM-CSF (54, 56, 57), all of which negatively regulate B-lymphopoiesis and promote myelopoiesis (58). We found a small increase in G-CSF in the MDSC-CM, and although a low concentration (1ng/ml) of recombinant G-CSF did not inhibit B-lymphopoiesis, higher concentrations (10ng/ml) did inhibit B-lymphopoiesis in vitro (data not shown). We conclude that IL-1 likely acts on hematopoietic progenitors (MPPs/HSCs), as well as on stromal cells to drive progenitors into the myeloid lineage. Consistent with this idea, in vivo injection of IL-1β drives mouse BM toward granulopoiesis (59), and in obese mice, adipose tissue-derived IL-1β promotes myelopoiesis (24).
Adipocyte-induced MDSCs as inhibitors of B-lymphopoiesis
Mouse MDSCs are a heterogeneous population of immature myeloid cells identified by the co-expression of CD11b and Gr1, as well as by the functional capacity to suppress T-cell proliferation. MDSCs are further categorized into monocytic (CD11b+Ly6C+Ly6G−) and granulocytic (CD11b+Ly6CloLy6G+) subsets (30). Based on Ly6C and Ly6G staining, the MDSCs generated in our system with adipocyte factors are mainly monocytic. As expected, these monocytic MDSCs, expressed high levels of arginase and iNos, major mediators of MDSC-mediated T-cell suppression. Because arginase and iNos are the best known inhibitors produced by MDSCs, and because arginine deficient mice have impaired B-cell development (60), we assumed the inhibition would likely be due to these enzymes, both of which deplete arginine from the environment (32). Consequently we were surprised that the inhibition of B-lymphopoiesis by adipocyte-induced MDSCs, was not due to arginase or iNos, but instead was due to IL-1. The identification of IL-1 as an MDSC-derived regulating cytokine opens up new avenues for investigating the contribution of MDSCs in tumors, infections, and other immune insults.
IL-1 has potent pro-inflammatory effects on many aspects of the immune system, and therefore its production is highly regulated (61). For example, various stimuli induce expression of full length IL-1β, but cleavage of this product is necessary for biological activity. Production of active IL-1β is typically generated downstream of inflammasome activation (61), after caspase-1 cleaves pro-IL-1β. In contrast, IL-1α does not require cleavage for biological activity, but its production still appears to be induced by inflammasome activators (62). Adipose tissue is a source of inflammatory cytokines and danger-associated molecular patterns, such as fatty acids, free cholesterol, ceramides, and lipid crystals (13, 63–65), which are known activators of the inflammasome (23). While we are investigating which adipocyte factors are responsible for generating the MDSCs, it is likely that one or more of these also activates the inflammasome in MDSCs, leading to IL-1 production. Indeed, MDSCs have been found to produce IL-1β in response to NLRP3 inflammasome activation (66).
Inflammaging, obesity and the decline of B- and T-lymphopoiesis
Chronic low grade inflammation and inflammasome activation are characteristic of inflammaging and obesity. Inflammasome activation and the production of IL-1 in obesity and aging have a global impact on many aspects of the immune system (67, 68). We suggest that inflammasome activation by adipocytes directly contributes to the decline of B-lymphopoiesis, as evidenced by the production of IL-1 from adipocyte-generated MDSCs which inhibited B-lymphopoiesis. In support of this idea, the IL-1β that promoted myelopoiesis in obese mice was derived from inflammasome-activated adipose tissue macrophages(24). Although this study focused mainly on visceral adipose tissue, we suggest that the adipose tissue that accumulates in BM with age, could act as a local source of IL-1 to promote increased myelopoiesis. Additionally, inflammasome activation which is common in aging and obesity (65, 69), promotes thymic involution, negatively impacting T-lymphopoiesis (23) and contributing to the aging of multiple organs (70). Aged mice lacking the Nod-like receptor, NLRP3 that leads to NLRP3 inflammasome activation, show delayed thymic involution compared to aged WT mice (23), suggesting that treatments that block inflammasome activation may prevent thymic decline. One such treatment is calorie restriction, which in combination with exercise, decreased adipose tissue NLRP3 expression in obese individuals (65). Thymic involution occurs prematurely in obese mice (71), and calorie restriction delays this involution in aged mice (72), suggesting that calorie restriction could be therapeutic. B-lymphopoiesis may also be regulated by caloric restriction. Similar to thymic atrophy, high fat diet results in increased adipose tissue in the BM and decreased B-lymphopoiesis in young adult mice (25). Further, obese mice have decreased BM lymphoid multipotent progenitors and CLPs (71). Additional studies are required to establish if the B-cell development process is also sensitive to inflammasome activation that is prevalent in aging and obesity, and if calorie restriction could be a treatment to prevent the decline in B-lymphopoiesis.
Multifaceted nature of MDSCs
Our study highlights the multifaceted nature of MDSCs in their capacity to regulate different immune processes, such as B-lymphopoiesis, tumor immunity, and resolution of infection. MDSCs regulate these processes by targeting different-cell-types using an array of effector molecules like arginase, iNos, and IL-1. The production of these different molecules is likely dependent on their environment, as evidenced by the finding that the function of MDSCs can be altered by different stimuli that induce pro-inflammatory or anti-inflammatory molecules (27). In the context of our study, MDSCs generated with adipocyte factors have an inflammatory profile and secrete numerous pro-inflammatory molecules.
Most prior studies focus on the capacity of MDSCs to suppress T-cell responses in the context of diseases such as cancer, infection, and obesity. Very few studies focus on the effect of MDSCs on other cell types. Green et al. (73) showed that MDSCs can suppress B-cell proliferation in the context of murine retrovirus-induced AIDS, and Zhu et al. (74) showed that MDSCs suppress NK cell activation via reactive oxygen species. Our study shows that MDSCs also have the capacity to impact hematopoiesis, specifically B-lymphopoiesis and myelopoiesis. Generally, MDSCs are generated in vitro by culturing BM cells with GM-CSF and IL-6 (75); in our system MDSCs are readily generated by the addition of ACM from an adipocyte cell line. In a typical experiment, we obtain ~3×10⁶ MDSCs from cultures of 40×106 BM cells, making this a simple and reproducible means of generating large numbers of MDSCs. This method as a means of generating MDSCs will be useful for mechanistic studies, as well as for testing their potential use as a therapeutic.
Conclusion
We showed that adipocytes produce factors that both induce MDSCs, and activate them to produce IL-1, which can have numerous biological effects, including the decline of B-lymphopoiesis. The decline in B-lymphopoiesis correlates with the accumulation of fat in the BM, and we suggest that adipocytes account for the decline of B-lymphopoiesis by inducing IL-1-producing MDSCs. Fat also accumulates in the thymus and is characteristic of age-related thymic involution and the decline in T-lymphopoiesis (23, 70). These data suggest that the decline in B-lymphopoiesis and T-lymphopoiesis may be regulated by common microenvironmental changes. Overall, our study, along with other studies (12–16) suggest that fat has a profound impact on the immune system.
Acknowledgments
We thank Dr. Pamela Witte (Loyola University Chicago) for valuable discussions throughout this study. We also thank Dr. James Sinacore (Loyola University Chicago) for discussions regarding statistical analysis.
Footnotes
Research reported in this publication was supported by the National Institute of Allergy and Infectious Diseases of the National Institutes of Health under award number AI068390, and by the National Institute On Aging of the National Institutes of Health under award number F31AG047817.
References
- 1.Hardy RR, Carmack CE, Shinton SA, Kemp JD, Hayakawa K. Resolution and characterization of pro-B and pre-pro-B cell stages in normal mouse bone marrow. J Exp Med. 1991;173:1213–1225. doi: 10.1084/jem.173.5.1213. [DOI] [PMC free article] [PubMed] [Google Scholar]
- 2.von Freeden-Jeffry U, Vieira P, Lucian LA, McNeil T, Burdach SE, Murray R. Lymphopenia in interleukin (IL)-7 gene-deleted mice identifies IL-7 as a nonredundant cytokine. J Exp Med. 1995;181:1519–1526. doi: 10.1084/jem.181.4.1519. [DOI] [PMC free article] [PubMed] [Google Scholar]
- 3.Broudy VC. Stem cell factor and hematopoiesis. Blood. 1997;90:1345–1364. [PubMed] [Google Scholar]
- 4.Vosshenrich CA, Cumano A, Muller W, Di Santo JP, Vieira P. Thymic stromal-derived lymphopoietin distinguishes fetal from adult B cell development. Nat Immunol. 2003;4:773–779. doi: 10.1038/ni956. [DOI] [PubMed] [Google Scholar]
- 5.Sitnicka E, Brakebusch C, Martensson IL, Svensson M, Agace WW, Sigvardsson M, Buza-Vidas N, Bryder D, Cilio CM, Ahlenius H, Maraskovsky E, Peschon JJ, Jacobsen SE. Complementary signaling through flt3 and interleukin-7 receptor alpha is indispensable for fetal and adult B cell genesis. J Exp Med. 2003;198:1495–1506. doi: 10.1084/jem.20031152. [DOI] [PMC free article] [PubMed] [Google Scholar]
- 6.Scholz JL, Diaz A, Riley RL, Cancro MP, Frasca D. A comparative review of aging and B cell function in mice and humans. Curr Opin Immunol. 2013;25:504–510. doi: 10.1016/j.coi.2013.07.006. [DOI] [PMC free article] [PubMed] [Google Scholar]
- 7.McKenna RW, Washington LT, Aquino DB, Picker LJ, Kroft SH. Immunophenotypic analysis of hematogones (B-lymphocyte precursors) in 662 consecutive bone marrow specimens by 4-color flow cytometry. Blood. 2001;98:2498–2507. doi: 10.1182/blood.v98.8.2498. [DOI] [PubMed] [Google Scholar]
- 8.Crane MA, Kingzette M, Knight KL. Evidence for limited B-lymphopoiesis in adult rabbits. J Exp Med. 1996;183:2119–2121. doi: 10.1084/jem.183.5.2119. [DOI] [PMC free article] [PubMed] [Google Scholar]
- 9.Jasper PJ, Zhai SK, Kalis SL, Kingzette M, Knight KL. B lymphocyte development in rabbit: progenitor B cells and waning of B lymphopoiesis. J Immunol. 2003;171:6372–6380. doi: 10.4049/jimmunol.171.12.6372. [DOI] [PubMed] [Google Scholar]
- 10.Kalis SL, Zhai SK, Yam PC, Witte PL, Knight KL. Suppression of B lymphopoiesis at a lymphoid progenitor stage in adult rabbits. Int Immunol. 2007;19:801–811. doi: 10.1093/intimm/dxm048. [DOI] [PubMed] [Google Scholar]
- 11.Bilwani FA, Knight KL. Adipocyte-derived soluble factor(s) inhibits early stages of B lymphopoiesis. J Immunol. 2012;189:4379–4386. doi: 10.4049/jimmunol.1201176. [DOI] [PMC free article] [PubMed] [Google Scholar]
- 12.Naveiras O, Nardi V, Wenzel PL, Hauschka PV, Fahey F, Daley GQ. Bone-marrow adipocytes as negative regulators of the haematopoietic microenvironment. Nature. 2009;460:259–263. doi: 10.1038/nature08099. [DOI] [PMC free article] [PubMed] [Google Scholar]
- 13.Lago F, Dieguez C, Gomez-Reino J, Gualillo O. Adipokines as emerging mediators of immune response and inflammation. Nat Clin Pract Rheumatol. 2007;3:716–724. doi: 10.1038/ncprheum0674. [DOI] [PubMed] [Google Scholar]
- 14.Exley MA, Hand L, O’Shea D, Lynch L. Interplay between the immune system and adipose tissue in obesity. J Endocrinol. 2014;223:R41–8. doi: 10.1530/JOE-13-0516. [DOI] [PubMed] [Google Scholar]
- 15.Pond CM. Adipose tissue and the immune system. Prostaglandins Leukot Essent Fatty Acids. 2005;73:17–30. doi: 10.1016/j.plefa.2005.04.005. [DOI] [PubMed] [Google Scholar]
- 16.Alexaki VI, Notas G, Pelekanou V, Kampa M, Valkanou M, Theodoropoulos P, Stathopoulos EN, Tsapis A, Castanas E. Adipocytes as immune cells: differential expression of TWEAK, BAFF, and APRIL and their receptors (Fn14, BAFF-R, TACI, and BCMA) at different stages of normal and pathological adipose tissue development. J Immunol. 2009;183:5948–5956. doi: 10.4049/jimmunol.0901186. [DOI] [PubMed] [Google Scholar]
- 17.Justesen J, Stenderup K, Ebbesen EN, Mosekilde L, Steiniche T, Kassem M. Adipocyte tissue volume in bone marrow is increased with aging and in patients with osteoporosis. Biogerontology. 2001;2:165–171. doi: 10.1023/a:1011513223894. [DOI] [PubMed] [Google Scholar]
- 18.Lecka-Czernik B, Rosen CJ, Kawai M. Skeletal aging and the adipocyte program: New insights from an “old” molecule. Cell Cycle. 2010;9:3648–3654. doi: 10.4161/cc.9.18.13046. [DOI] [PMC free article] [PubMed] [Google Scholar]
- 19.Tuljapurkar SR, McGuire TR, Brusnahan SK, Jackson JD, Garvin KL, Kessinger MA, Lane JT, O’Kane BJ, Sharp JG. Changes in human bone marrow fat content associated with changes in hematopoietic stem cell numbers and cytokine levels with aging. J Anat. 2011;219:574–581. doi: 10.1111/j.1469-7580.2011.01423.x. [DOI] [PMC free article] [PubMed] [Google Scholar]
- 20.Chinn IK, Blackburn CC, Manley NR, Sempowski GD. Changes in primary lymphoid organs with aging. Semin Immunol. 2012;24:309–320. doi: 10.1016/j.smim.2012.04.005. [DOI] [PMC free article] [PubMed] [Google Scholar]
- 21.Dixit VD. Thymic fatness and approaches to enhance thymopoietic fitness in aging. Curr Opin Immunol. 2010;22:521–528. doi: 10.1016/j.coi.2010.06.010. [DOI] [PMC free article] [PubMed] [Google Scholar]
- 22.Rosen CJ, Ackert-Bicknell C, Rodriguez JP, Pino AM. Marrow fat and the bone microenvironment: developmental, functional, and pathological implications. Crit Rev Eukaryot Gene Expr. 2009;19:109–124. doi: 10.1615/critreveukargeneexpr.v19.i2.20. [DOI] [PMC free article] [PubMed] [Google Scholar]
- 23.Youm YH, Kanneganti TD, Vandanmagsar B, Zhu X, Ravussin A, Adijiang A, Owen JS, Thomas MJ, Francis J, Parks JS, Dixit VD. The Nlrp3 inflammasome promotes age-related thymic demise and immunosenescence. Cell Rep. 2012;1:56–68. doi: 10.1016/j.celrep.2011.11.005. [DOI] [PMC free article] [PubMed] [Google Scholar]
- 24.Nagareddy PR, Kraakman M, Masters SL, Stirzaker RA, Gorman DJ, Grant RW, Dragoljevic D, Hong ES, Abdel-Latif A, Smyth SS, Choi SH, Korner J, Bornfeldt KE, Fisher EA, Dixit VD, Tall AR, Goldberg IJ, Murphy AJ. Adipose tissue macrophages promote myelopoiesis and monocytosis in obesity. Cell Metab. 2014;19:821–835. doi: 10.1016/j.cmet.2014.03.029. [DOI] [PMC free article] [PubMed] [Google Scholar]
- 25.Adler BJ, Green DE, Pagnotti GM, Chan ME, Rubin CT. High fat diet rapidly suppresses B lymphopoiesis by disrupting the supportive capacity of the bone marrow niche. PLoS One. 2014;9:e90639. doi: 10.1371/journal.pone.0090639. [DOI] [PMC free article] [PubMed] [Google Scholar]
- 26.Miller JP, Allman D. Linking age-related defects in B lymphopoiesis to the aging of hematopoietic stem cells. Semin Immunol. 2005;17:321–329. doi: 10.1016/j.smim.2005.05.003. [DOI] [PubMed] [Google Scholar]
- 27.Enioutina EY, Bareyan D, Daynes RA. A role for immature myeloid cells in immune senescence. J Immunol. 2011;186:697–707. doi: 10.4049/jimmunol.1002987. [DOI] [PubMed] [Google Scholar]
- 28.Neal JW, Clipstone NA. Calcineurin mediates the calcium-dependent inhibition of adipocyte differentiation in 3T3-L1 cells. J Biol Chem. 2002;277:49776–49781. doi: 10.1074/jbc.M207913200. [DOI] [PubMed] [Google Scholar]
- 29.Holmes R, Zuniga-Pflucker JC. The OP9-DL1 system: generation of T-lymphocytes from embryonic or hematopoietic stem cells in vitro. Cold Spring Harb Protoc. 2009;2009 doi: 10.1101/pdb.prot5156. pdb.prot5156. [DOI] [PubMed] [Google Scholar]
- 30.Gabrilovich DI, Nagaraj S. Myeloid-derived suppressor cells as regulators of the immune system. Nat Rev Immunol. 2009;9:162–174. doi: 10.1038/nri2506. [DOI] [PMC free article] [PubMed] [Google Scholar]
- 31.Youn JI, Nagaraj S, Collazo M, Gabrilovich DI. Subsets of myeloid-derived suppressor cells in tumor-bearing mice. J Immunol. 2008;181:5791–5802. doi: 10.4049/jimmunol.181.8.5791. [DOI] [PMC free article] [PubMed] [Google Scholar]
- 32.Rodriguez PC, Ochoa AC. Arginine regulation by myeloid derived suppressor cells and tolerance in cancer: mechanisms and therapeutic perspectives. Immunol Rev. 2008;222:180–191. doi: 10.1111/j.1600-065X.2008.00608.x. [DOI] [PMC free article] [PubMed] [Google Scholar]
- 33.Li YS, Wasserman R, Hayakawa K, Hardy RR. Identification of the earliest B lineage stage in mouse bone marrow. Immunity. 1996;5:527–535. doi: 10.1016/s1074-7613(00)80268-x. [DOI] [PubMed] [Google Scholar]
- 34.Rumfelt LL, Zhou Y, Rowley BM, Shinton SA, Hardy RR. Lineage specification and plasticity in CD19- early B cell precursors. J Exp Med. 2006;203:675–687. doi: 10.1084/jem.20052444. [DOI] [PMC free article] [PubMed] [Google Scholar]
- 35.Merchant MS, Garvy BA, Riley RL. B220- bone marrow progenitor cells from New Zealand black autoimmune mice exhibit an age-associated decline in Pre-B and B-cell generation. Blood. 1995;85:1850–1857. [PubMed] [Google Scholar]
- 36.Stephan RP, V, Sanders M, Witte PL. Stage-specific alterations in murine B lymphopoiesis with age. Int Immunol. 1996;8:509–518. doi: 10.1093/intimm/8.4.509. [DOI] [PubMed] [Google Scholar]
- 37.Stephan RP, Lill-Elghanian DA, Witte PL. Development of B cells in aged mice: decline in the ability of pro-B cells to respond to IL-7 but not to other growth factors. J Immunol. 1997;158:1598–1609. [PubMed] [Google Scholar]
- 38.Stephan RP, Reilly CR, Witte PL. Impaired ability of bone marrow stromal cells to support B-lymphopoiesis with age. Blood. 1998;91:75–88. [PubMed] [Google Scholar]
- 39.Sherwood EM, Xu W, King AM, Blomberg BB, Riley RL. The reduced expression of surrogate light chains in B cell precursors from senescent BALB/c mice is associated with decreased E2A proteins. Mech Ageing Dev. 2000;118:45–59. doi: 10.1016/s0047-6374(00)00157-3. [DOI] [PubMed] [Google Scholar]
- 40.Miller JP, Allman D. The decline in B lymphopoiesis in aged mice reflects loss of very early B-lineage precursors. J Immunol. 2003;171:2326–2330. doi: 10.4049/jimmunol.171.5.2326. [DOI] [PubMed] [Google Scholar]
- 41.Cho RH, Sieburg HB, Muller-Sieburg CE. A new mechanism for the aging of hematopoietic stem cells: aging changes the clonal composition of the stem cell compartment but not individual stem cells. Blood. 2008;111:5553–5561. doi: 10.1182/blood-2007-11-123547. [DOI] [PMC free article] [PubMed] [Google Scholar]
- 42.Kondo M, I, Weissman L, Akashi K. Identification of clonogenic common lymphoid progenitors in mouse bone marrow. Cell. 1997;91:661–672. doi: 10.1016/s0092-8674(00)80453-5. [DOI] [PubMed] [Google Scholar]
- 43.Montecino-Rodriguez E, Berent-Maoz B, Dorshkind K. Causes, consequences, and reversal of immune system aging. J Clin Invest. 2013;123:958–965. doi: 10.1172/JCI64096. [DOI] [PMC free article] [PubMed] [Google Scholar]
- 44.Labrie JE, 3rd, Sah AP, Allman DM, Cancro MP, Gerstein RM. Bone marrow microenvironmental changes underlie reduced RAG-mediated recombination and B cell generation in aged mice. J Exp Med. 2004;200:411–423. doi: 10.1084/jem.20040845. [DOI] [PMC free article] [PubMed] [Google Scholar]
- 45.Rossi DJ, Bryder D, Zahn JM, Ahlenius H, Sonu R, Wagers AJ, Weissman IL. Cell intrinsic alterations underlie hematopoietic stem cell aging. Proc Natl Acad Sci U S A. 2005;102:9194–9199. doi: 10.1073/pnas.0503280102. [DOI] [PMC free article] [PubMed] [Google Scholar]
- 46.Sudo K, Ema H, Morita Y, Nakauchi H. Age-associated characteristics of murine hematopoietic stem cells. J Exp Med. 2000;192:1273–1280. doi: 10.1084/jem.192.9.1273. [DOI] [PMC free article] [PubMed] [Google Scholar]
- 47.Morrison SJ, Wandycz AM, Akashi K, Globerson A, Weissman IL. The aging of hematopoietic stem cells. Nat Med. 1996;2:1011–1016. doi: 10.1038/nm0996-1011. [DOI] [PubMed] [Google Scholar]
- 48.Chen J, Astle CM, Harrison DE. Development and aging of primitive hematopoietic stem cells in BALB/cBy mice. Exp Hematol. 1999;27:928–935. doi: 10.1016/s0301-472x(99)00018-1. [DOI] [PubMed] [Google Scholar]
- 49.Ratliff M, Alter S, Frasca D, Blomberg BB, Riley RL. In senescence, age-associated B cells secrete TNFalpha and inhibit survival of B-cell precursors. Aging Cell. 2013;12:303–311. doi: 10.1111/acel.12055. [DOI] [PMC free article] [PubMed] [Google Scholar]
- 50.Maeda K, Baba Y, Nagai Y, Miyazaki K, Malykhin A, Nakamura K, Kincade PW, Sakaguchi N, Coggeshall KM. IL-6 blocks a discrete early step in lymphopoiesis. Blood. 2005;106:879–885. doi: 10.1182/blood-2005-02-0456. [DOI] [PMC free article] [PubMed] [Google Scholar]
- 51.Maeda K, Malykhin A, Teague-Weber BN, Sun XH, Farris AD, Coggeshall KM. Interleukin-6 aborts lymphopoiesis and elevates production of myeloid cells in systemic lupus erythematosus-prone B6.Sle1.Yaa animals. Blood. 2009;113:4534–4540. doi: 10.1182/blood-2008-12-192559. [DOI] [PMC free article] [PubMed] [Google Scholar]
- 52.Vasto S, Candore G, Balistreri CR, Caruso M, Colonna-Romano G, Grimaldi MP, Listi F, Nuzzo D, Lio D, Caruso C. Inflammatory networks in ageing, age-related diseases and longevity. Mech Ageing Dev. 2007;128:83–91. doi: 10.1016/j.mad.2006.11.015. [DOI] [PubMed] [Google Scholar]
- 53.Baylis D, Bartlett DB, Patel HP, Roberts HC. Understanding how we age: insights into inflammaging. Longev Healthspan. 2013;2 doi: 10.1186/2046-2395-2-8. 8-2395-2-8. [DOI] [PMC free article] [PubMed] [Google Scholar]
- 54.Dorshkind K. IL-1 inhibits B cell differentiation in long term bone marrow cultures. J Immunol. 1988;141:531–538. [PubMed] [Google Scholar]
- 55.Hirayama F, Clark SC, Ogawa M. Negative regulation of early B lymphopoiesis by interleukin 3 and interleukin 1 alpha. Proc Natl Acad Sci U S A. 1994;91:469–473. doi: 10.1073/pnas.91.2.469. [DOI] [PMC free article] [PubMed] [Google Scholar]
- 56.Ueda Y, Cain DW, Kuraoka M, Kondo M, Kelsoe G. IL-1R type I-dependent hemopoietic stem cell proliferation is necessary for inflammatory granulopoiesis and reactive neutrophilia. J Immunol. 2009;182:6477–6484. doi: 10.4049/jimmunol.0803961. [DOI] [PMC free article] [PubMed] [Google Scholar]
- 57.Dorshkind K. Interleukin-1 inhibition of B lymphopoiesis is reversible. Blood. 1988;72:2053–2055. [PubMed] [Google Scholar]
- 58.Billips LG, Petitte D, Landreth KS. Bone marrow stromal cell regulation of B lymphopoiesis: interleukin-1 (IL-1) and IL-4 regulate stromal cell support of pre-B cell production in vitro. Blood. 1990;75:611–619. [PubMed] [Google Scholar]
- 59.Ueda Y, Yang K, Foster SJ, Kondo M, Kelsoe G. Inflammation controls B lymphopoiesis by regulating chemokine CXCL12 expression. J Exp Med. 2004;199:47–58. doi: 10.1084/jem.20031104. [DOI] [PMC free article] [PubMed] [Google Scholar]
- 60.de Jonge WJ, Kwikkers KL, te Velde AA, van Deventer SJ, Nolte MA, Mebius RE, Ruijter JM, Lamers MC, Lamers WH. Arginine deficiency affects early B cell maturation and lymphoid organ development in transgenic mice. J Clin Invest. 2002;110:1539–1548. doi: 10.1172/JCI16143. [DOI] [PMC free article] [PubMed] [Google Scholar]
- 61.Garlanda C, Dinarello CA, Mantovani A. The interleukin-1 family: back to the future. Immunity. 2013;39:1003–1018. doi: 10.1016/j.immuni.2013.11.010. [DOI] [PMC free article] [PubMed] [Google Scholar]
- 62.Gross O, Yazdi AS, Thomas CJ, Masin M, Heinz LX, Guarda G, Quadroni M, Drexler SK, Tschopp J. Inflammasome activators induce interleukin-1alpha secretion via distinct pathways with differential requirement for the protease function of caspase-1. Immunity. 2012;36:388–400. doi: 10.1016/j.immuni.2012.01.018. [DOI] [PubMed] [Google Scholar]
- 63.Coppack SW. Pro-inflammatory cytokines and adipose tissue. Proc Nutr Soc. 2001;60:349–356. doi: 10.1079/pns2001110. [DOI] [PubMed] [Google Scholar]
- 64.Wen H, Gris D, Lei Y, Jha S, Zhang L, Huang MT, Brickey WJ, Ting JP. Fatty acid-induced NLRP3-ASC inflammasome activation interferes with insulin signaling. Nat Immunol. 2011;12:408–415. doi: 10.1038/ni.2022. [DOI] [PMC free article] [PubMed] [Google Scholar]
- 65.Vandanmagsar B, Youm YH, Ravussin A, Galgani JE, Stadler K, Mynatt RL, Ravussin E, Stephens JM, Dixit VD. The NLRP3 inflammasome instigates obesity-induced inflammation and insulin resistance. Nat Med. 2011;17:179–188. doi: 10.1038/nm.2279. [DOI] [PMC free article] [PubMed] [Google Scholar]
- 66.Bruchard M, Mignot G, Derangere V, Chalmin F, Chevriaux A, Vegran F, Boireau W, Simon B, Ryffel B, Connat JL, Kanellopoulos J, Martin F, Rebe C, Apetoh L, Ghiringhelli F. Chemotherapy-triggered cathepsin B release in myeloid-derived suppressor cells activates the Nlrp3 inflammasome and promotes tumor growth. Nat Med. 2013;19:57–64. doi: 10.1038/nm.2999. [DOI] [PubMed] [Google Scholar]
- 67.Sims JE, Smith DE. The IL-1 family: regulators of immunity. Nat Rev Immunol. 2010;10:89–102. doi: 10.1038/nri2691. [DOI] [PubMed] [Google Scholar]
- 68.van de Veerdonk FL, Netea MG. New Insights in the Immunobiology of IL-1 Family Members. Front Immunol. 2013;4:167. doi: 10.3389/fimmu.2013.00167. [DOI] [PMC free article] [PubMed] [Google Scholar]
- 69.Salminen A, Kaarniranta K, Kauppinen A. Inflammaging: disturbed interplay between autophagy and inflammasomes. Aging (Albany NY) 2012;4:166–175. doi: 10.18632/aging.100444. [DOI] [PMC free article] [PubMed] [Google Scholar]
- 70.Youm YH, Grant RW, McCabe LR, Albarado DC, Nguyen KY, Ravussin A, Pistell P, Newman S, Carter R, Laque A, Munzberg H, Rosen CJ, Ingram DK, Salbaum JM, Dixit VD. Canonical Nlrp3 inflammasome links systemic low-grade inflammation to functional decline in aging. Cell Metab. 2013;18:519–532. doi: 10.1016/j.cmet.2013.09.010. [DOI] [PMC free article] [PubMed] [Google Scholar]
- 71.Yang H, Youm YH, Vandanmagsar B, Rood J, Kumar KG, Butler AA, Dixit VD. Obesity accelerates thymic aging. Blood. 2009;114:3803–3812. doi: 10.1182/blood-2009-03-213595. [DOI] [PMC free article] [PubMed] [Google Scholar]
- 72.Yang H, Youm YH, Dixit VD. Inhibition of thymic adipogenesis by caloric restriction is coupled with reduction in age-related thymic involution. J Immunol. 2009;183:3040–3052. doi: 10.4049/jimmunol.0900562. [DOI] [PMC free article] [PubMed] [Google Scholar]
- 73.Green KA, Cook WJ, Green WR. Myeloid-derived suppressor cells in murine retrovirus-induced AIDS inhibit T- and B-cell responses in vitro that are used to define the immunodeficiency. J Virol. 2013;87:2058–2071. doi: 10.1128/JVI.01547-12. [DOI] [PMC free article] [PubMed] [Google Scholar]
- 74.Zhu J, Huang X, Yang Y. Myeloid-derived suppressor cells regulate natural killer cell response to adenovirus-mediated gene transfer. J Virol. 2012;86:13689–13696. doi: 10.1128/JVI.01595-12. [DOI] [PMC free article] [PubMed] [Google Scholar]
- 75.Marigo I, Bosio E, Solito S, Mesa C, Fernandez A, Dolcetti L, Ugel S, Sonda N, Bicciato S, Falisi E, Calabrese F, Basso G, Zanovello P, Cozzi E, Mandruzzato S, Bronte V. Tumor-induced tolerance and immune suppression depend on the C/EBPbeta transcription factor. Immunity. 2010;32:790–802. doi: 10.1016/j.immuni.2010.05.010. [DOI] [PubMed] [Google Scholar]