

Abstract
Introduction
Severe falciparum malaria is commonly complicated by metabolic acidosis. Together with lactic acid (LA), other previously unmeasured acids have been implicated in the pathogenesis of falciparum malaria.
Methods
In this prospective study, we characterised organic acids in adults with severe falciparum malaria in India and Bangladesh. Liquid chromatography-mass spectrometry was used to measure organic acids in plasma and urine. Patients were followed until recovery or death.
Results
Patients with severe malaria (n=138), uncomplicated malaria (n=102), sepsis (n=32) and febrile encephalopathy (n=35) were included. Strong ion gap (mean±SD) was elevated in severe malaria (8.2 mEq/L±4.5) and severe sepsis (8.6 mEq/L±7.7) compared with uncomplicated malaria (6.0 mEq/L±5.1) and encephalopathy (6.6 mEq/L±4.7). Compared with uncomplicated malaria, severe malaria was characterised by elevated plasma LA, hydroxyphenyllactic acid (HPLA), α-hydroxybutyric acid and β-hydroxybutyric acid (all P<0.05). In urine, concentrations of methylmalonic, ethylmalonic and α-ketoglutaric acids were also elevated. Multivariate logistic regression showed that plasma HPLA was a strong independent predictor of death (odds ratio [OR] 3.5, 95 % confidence interval [CI] 1.6–7.5, P=0.001), comparable to LA (OR 3.5, 95 % CI 1.5–7.8, P=0.003) (combined area under the receiver operating characteristic curve 0.81).
Conclusions
Newly identified acids, in addition to LA, are elevated in patients with severe malaria and are highly predictive of fatal outcome. Further characterisation of their sources and metabolic pathways is now needed.
Electronic supplementary material
The online version of this article (doi:10.1186/s13054-015-1023-5) contains supplementary material, which is available to authorized users.
Introduction
Severe falciparum malaria remains a leading cause of mortality in the tropics. The case fatality rate in adult patients remains between 15 % and 40 % in resource-constrained hospital settings, and it is 11 % in intensive care units in resource-rich settings [1–3]. A better understanding of the pathophysiology of severe malaria is necessary to guide the development of new therapies.
The degree of metabolic acidosis in severe malaria is a strong prognosticator for a fatal outcome. Acidosis is associated with hyperlactataemia, and lactic acid (LA) has therefore been considered a major contributor to hydrogen ion accumulation [4, 5]. In contrast to bacterial sepsis, shock is not a common manifestation of severe malaria. Profound hyperlactataemia can occur in the presence of apparently normal macrovascular circulation [6, 7]. In severe falciparum malaria, sequestration of parasitised erythrocytes in capillaries and venules impairs oxygen delivery, leading to anaerobic glycolysis and consequent lactic acidosis with an increased lactate/pyruvate ratio [4, 8–10]. Further compromise of the microcirculatory flow occurs as a result of reduced erythrocyte deformability, rosette formation, agglutination, of parasitised erythrocytes, severe anaemia and endothelial dysfunction [4, 11, 12]. Compounding increased lactate production, clearance of lactate may be reduced owing to impaired gluconeogenesis and decreased liver blood flow [4, 13]. Renal dysfunction also contributes to acidosis through loss of the kidney’s normal role in acid–base homeostasis [14]. Yet, hyperlactataemia and renal dysfunction together still account for only two-thirds of the variance in standard base deficit (SBD) [4].
Using the modified physicochemical approach of Stewart, the presence of an unmeasured anion load was detected in patients with severe malaria [15, 16]. The mean (95 % confidence interval [CI]) strong ion gap (SIG), representing unmeasured acids, was 11.1 (10.4–11.8) mEq/L (normal value 0–2 mEq/L), whilst the mean concentration of lactate was only 2.9 mmol/L (2.7–3.2). The SIG showed an independent correlation with mortality [16]. This suggests that, in addition to LA accumulation, other organic acids play an important role in the pathogenesis of severe malaria. The prognostic value and pathological importance of such organic acids has also been recognised in other critical illnesses, including bacterial sepsis [17–19]. Understanding of the pathophysiology of severe malaria can be enhanced by profiling hitherto unidentified acids and comparing this profile with the profiles of other disease states.
Using a recently developed liquid chromatography-mass spectrometry (LC-MS) assay [20], we quantified a range of additional acids in the plasma and urine of adults with severe malaria to assess these acids’ contributions to acid load and their prognostic significance. Reference groups of uncomplicated falciparum malaria, bacterial sepsis (as an alternative cause of metabolic acidosis) and non-malarial encephalopathy (as an alternative cause of fever and coma) were also characterised.
Methods
Site selection and participants
This observational study was conducted in Chittagong Medical College Hospital, Chittagong, Bangladesh, and Ispat General Hospital, Rourkela, India, from May 2009 to September 2012. Both are areas of low, seasonal malaria transmission. Non-pregnant adults older than 16 years of age were recruited into this prospective study. There were four clinical diagnostic categories: (1) uncomplicated falciparum malaria, (2) severe falciparum malaria, (3) sepsis (in the absence of malaria) and (4) non-malarial febrile encephalopathy. Malaria was defined by the presence of asexual Plasmodium falciparum parasites visualised on a peripheral blood film, and severe malaria was distinguished from uncomplicated malaria by the presence of one or more markers of severity according to modified World Health Organisation (WHO) criteria as defined by Tran et al. [21]. Sepsis was defined by a blood film negative for malaria of all species, clinical suspicion of bacterial infection (based on history, examination and, when available, complete blood count and other investigations), SBD ≥3 mEq/L and two or more of the following four criteria: (1) heart rate >90 beats per minute, (2) respiratory rate >20 breaths per minute, (3) systolic blood pressure <90 mmHg and/or (4) Glasgow Coma Scale (GCS) score <15. Encephalopathy was defined by a blood film negative for malaria of all species, documented fever (>37.5 °C), a GCS score <11 and onset of symptoms within 14 days of admission without an obvious non-infective aetiology (such as diabetic ketoacidosis or poisoning). Participants meeting the inclusion criteria for both sepsis and encephalopathy were classified as having sepsis. Participants with chronic kidney or liver disease were excluded.
Fully informed consent was obtained from the patient or a legally acceptable representative. The Chittagong Medical College Hospital Ethical Review Committee, the Ispat General Hospital Institutional Ethical Committee and the Oxford Tropical Research Ethics Committee approved this study.
Study procedures
A detailed medical history and physical examination were performed upon enrolment, and each patient was monitored until discharge from the hospital or death. Anti-malarial medications and supportive therapies were administered in accordance with the WHO’s 2006 and 2010 malaria treatment guidelines and local hospital guidelines, although the availability of renal replacement therapy and mechanical ventilation was limited. Participants with sepsis or encephalopathy were treated according to hospital guidelines. Fluid management was carried out according to the attending physician’s discretion and typically entailed crystalloid administration guided by non-invasive monitoring. Upon patient admission, venous blood was collected for immediate processing in the hospital laboratory. Glucose, sodium, potassium, chloride, pH and partial pressure of carbon dioxide (pCO2) were assessed with an iSTAT point-of-care analyser (Abbott Point of Care, Maidenhead, UK). Bicarbonate (HCO3−) and SBD were derived internally from measurements of pH and pCO2 by using the iSTAT software. Haemoglobin and parasite count were determined using samples anti-coagulated with ethylenediaminetetraacetic acid (EDTA). Magnesium, calcium, phosphate, albumin, creatinine and total bilirubin were measured using freeze-thawed stored serum samples. l-Lactate was measured in plasma stored at −80 °C with fluoride/oxalate using the Olympus OSR 6193 system reagents for enzymatic quantification (Olympus Life Science, Southend-on-Sea, UK). Plasma Plasmodium falciparum histidine-rich protein 2 (PfHRP2) concentrations were assessed from freeze-thawed plasma stored with EDTA using a commercial sandwich enzyme-linked immunosorbent assay kit (Cellabs, Brookvale, Australia) as described previously [9]. Urine for assessment of acids was collected either as a catheter specimen or as a fresh midstream sample.
Liquid chromatography-mass spectroscopy of plasma and urine
Heparinised venous blood for LC-MS was centrifuged at 4 °C and 1500×g for 5 minutes, and plasma was stored at −80 °C or in liquid nitrogen until analysis. Unprocessed urine was stored in the same manner. The novel analytical techniques employed are described in detail elsewhere [20]. This technique permits simultaneous assessment of eight organic acids: LA, malonic acid (MA), methylmalonic acid (MMA), α-hydroxybutyric acid (α-HBA), β-hydroxybutyric acid (β-HBA), hydroxyphenyllactic acid (HPLA), ethylmalonic acid (EMA), and α-ketoglutaric acid (α-KGA). Urine concentrations were corrected for renal function by using the formula [A]urine-corrected = [A]urine × [Cre]plasma/[Cre]urine, as described previously for other urine substrates [22].
Calculation of the strong ion gap and unmeasured anions
The apparent strong ion difference (SIDapp) was calculated as SIDapp = [Na+] + [K+] + [Ca2+] + [Mg2+] − [Cl−] − [lactate−], with all concentrations expressed in milliequivalents per litre. The effective strong ion difference (SIDeff) was calculated by inclusion of the charges contributed by HCO3−, albumin and inorganic phosphate, using calculations described previously [16]. SIG was calculated as SIDapp − SIDeff as a measure of the remaining balance of charges contributed by unmeasured strong ions, including organic acids, and dissociated weak acids. For consistency with previous reports of the pathogenesis of acidosis in severe malaria, the SIG was calculated incorporating l-lactate derived by enzymatic assay.
Statistical analysis
Statistical analysis was performed using STATA/IC 12.0 software (StataCorp, College Station, TX, USA) and Prism 6.0b software (GraphPad Software, La Jolla, CA, USA). Normally distributed continuous variables and log-transformed variables were compared between groups using analysis of variance, with post-test pairwise comparisons as appropriate, using Tukey’s multiple-comparisons test. Non-normally distributed data were compared using the Mann–Whitney U test. Associations between organic acids, clinical indicators and mortality caused by severe malaria were formally explored by calculation of Spearman’s rank correlation coefficient. For potential predictors of fatal outcome, odds ratios (ORs) and P values were determined by univariate logistic regression. Inclusion of explanatory variables in a multivariate model was hypothesis-driven. Two multivariate logistic regression models were designed, one including the four detectable plasma acids and one including the seven detectable urinary acids. Both models were assessed for collinearity using the ‘collin’ function in STATA/IC. Stepwise backward selection with a P-value cutoff of <0.05 was done to come to a final multivariate logistic regression model. For the final models, the area under the receiver operating characteristic curve (AUROCC) was determined, and goodness-of-fit was measured using the Hosmer-Lemeshow test and determination of the model’s P value.
Results
Baseline characteristics of the study population
A total of 138 consecutive patients with severe malaria and 102 with uncomplicated malaria were recruited to participate in this study. Non-malarial reference groups of acutely ill patients included 32 consecutively recruited participants with sepsis and 35 with febrile encephalopathy. At the time of admission, 63 % of patients with severe malaria were comatose, 46 % had jaundice, 17 % were severely anaemic, 16 % had acute kidney injury, 2 % were hypoglycaemic and 1 % had haemodynamic shock. Mortality rates were 28 % among participants with severe malaria, 50 % for those with sepsis and 43 % for patients with encephalopathy. The clinical and biochemical characteristics of these participants at the time of enrolment are shown in Table 1.
Table 1.
Baseline clinical and biochemical characteristics of participants at the time of enrolment
| Characteristics | Uncomplicated malaria N=102 | Severe malaria N=138 | Sepsis N=32 | Encephalopathy N=35 | P value* | ||||
|---|---|---|---|---|---|---|---|---|---|
| Male, n (%) | 80 | (78 %) | 97 | (70 %) | 15 | (47 %) | 23 | (66 %) | 0.008 |
| Age, yr, mean (SD, range) | 33 | (14.8, 16–70) | 36 | (14.2, 16–75) | 37 | (14.7, 16–70) | 40 | (18.4, 18–75) | 0.106 |
| Respiratory rate, breaths/min, mean (SD, range) | 26 | (6.6, 18–48) | 32 | (10.2, 15–93) | 34 | (9.9, 15–58) | 30 | (9.4, 12–60) | <0.001 |
| Heart rate, beats/min, mean (SD, range) | 95 | (16.2, 64–149) | 110 | (22.5, 54–166) | 120 | (16.9, 92–151) | 104 | (24.7, 60–170) | <0.001 |
| Mean arterial pressure, mmHg, mean (SD, range) | 81 | (11.7, 57–115) | 83 | (15.2, 28–144) | 79 | (19.3, 20–127) | 93 | (17.1, 64–125) | <0.001 |
| Shock, SBP <80 mmHg, n (%) | 0 | (0 %) | 2 | (1.4 %) | 6 | (19 %) | 0 | (0 %) | |
| Glasgow Coma Scale score, geo mean (95 % CI) | 15 | (15–15) | 9 | (9–10) | 11 | (9–13) | 7 | (6–8) | <0.001 |
| GCS score <15, n (%) | 15/102 | (15 %) | 109/138 | (79 %) | 17/32 | (53 %) | 35/35 | (100 %) | |
| GCS score <11, n (%) | 0 | (0 %) | 87/138 | (63 %) | 10/32 | (31 %) | 35/35 | (100 %) | |
| GCS score <8, n (%) | 0 | (0 %) | 28/138 | (20 %) | 7/32 | (22 %) | 10/35 | (29 %) | |
| Parasitaemia (count/μl), geo mean (95 % CI) | 11,184 | (6853–18,253) | 27,933 | (18,101–43,105) | 0.007 | ||||
| PfHRP2 (ng/ml), geo mean (95 % CI)a | 274 | (201–376) | 1,684 | (1,323–2,143) | <0.001 | ||||
| Total bilirubin (mg/dl), geo mean (95 % CI, range) | 1.1 | (0.9–1.4, 0.2–28.3) | 2.8 | (2.3–3.5, 0.2–44.2) | 0.94 | (0.6–1.5, 0.2–10.9) | 0.47 | (0.3–0.6, 0.1–6.0) | <0.001 |
| Creatinine (mg/dl), geo mean (95 % CI, range) | 1.0 | (0.9–1.0, 0.5–2.3) | 1.5 | (1.3–1.7, 0.5–8.6) | 1.7 | (1.2–2.3,0.3–14.1) | 1.1 | (0.9–1.4, 0.6–24.3) | <0.001 |
| Acute kidney injury (creatinine >3 mg/dl) | 0/101 | (0 %) | 20/135 | (15 %) | 6/31 | (19 %) | 2/35 | (6 %) | |
| Hb (g/dl), mean (SD, range) | 10.6 | (2.8, 3.8–15.6) | 9.6 | (3.1, 2.6–17.5) | 10.3 | (3.0, 5.0–16.7) | 12.3 | (2.5, 4.7–16.1) | <0.001 |
| Anaemia (Hb <7 g/dl), n (%) | 13 | (13 %) | 24 | (17 %) | 3 | (9 %) | 2 | (6 %) | |
| Glucose (mg/dl), geo mean (95 % CI, range) | 122 | (114–130, 55–332) | 124 | (115–134, 33–455) | 126 | (104–152, 39–443) | 146 | (124–171, 63–612) | 0.205 |
| Hypoglycaemia (<40 mg/dl), n (%) | 0 | (0 %) | 3 | (2 %) | 1 | (3 %) | 0 | (0 %) | |
| Mortality, n (%) | 0 | (0 %) | 39 | (28 %) | 16 | (50 %) | 15 | (43 %) | <0.001 |
Abbreviations: GCS Glasgow Coma Scale, geo mean geometric mean, Hb haemoglobin, PfHRP2 Plasmodium falciparum histidine-rich protein 2, SBP systolic blood pressure, SD standard deviation
*P values were derived by analysis of variance (ANOVA) between four participant groups (one-way ANOVA for normally distributed continuous variables or variables log-transformed toward normality; Kruskal-Wallis test for non-normally distributed variables). Student’s t tests were used for comparison of (log-transformed) parasite count and PfHRP2 concentrations, where only two participant groups are compared. χ2 tests were used for comparison of mortality
aOwing to limited assay availability for PfHRP2 analysis, data represent 95 participants for uncomplicated malaria and 126 for severe malaria
Metabolic acidosis and the strong ion gap
The majority of participants with severe malaria had metabolic acidosis (mean SBD 6 mEq/L) (Table 2), but only 14 % of patients with severe malaria had a venous pH <7.35 compared with 47 % of patients with sepsis. SBD was different between groups (P<0.001), with higher mean SBD in patients with sepsis than in those severe malaria and higher SBD in patients with severe malaria than in patients with uncomplicated malaria or encephalopathy. SIG differed between study groups (P=0.002) and was higher in patients with severe malaria, sepsis or encephalopathy than in patients with uncomplicated malaria.
Table 2.
Biochemical characteristics pertaining to acidosis and calculation of strong ion gap using admission venous blood specimens
| Characteristics | Uncomplicated malaria N=102 | Severe malaria N=138 | Sepsis N=32 | Encephalopathy N=35 | P value* | ||||
|---|---|---|---|---|---|---|---|---|---|
| Na+ (mmol/L) | 134 | (4.73, 109–143) | 136 | (6.90, 108–160) | 136 | (11.23, 107–172) | 136 | (9.18, 113–157) | 0.163 |
| K+ (mmol/L) | 3.6 | (0.44, 2.4–5.4) | 3.9 | (0.81, 2.1–7.1) | 4.0 | (1.24, 2.0–6.9) | 3.7 | (0.74, 2.0–5.5) | 0.003 |
| Mg2+ (mmol/L) | 0.7 | (0.22, 0.1–1.1) | 0.9 | (0.21, 0.5–1.8) | 0.8 | (0.22, 0.3–1.3) | 0.8 | (0.13, 0.4–1.1) | <0.001 |
| Ca2+ (mmol/L) | 1.9 | (0.21, 1.4–2.6) | 2.0 | (0.21, 1.4–2.5) | 1.9 | (0.38, 1.1–2.6) | 2.1 | (0.27, 1.3–2.5) | <0.001 |
| Cl− (mmol/L) | 102 | (5.16, 87–113) | 105 | (7.87, 72–139) | 106 | (11.50, 78–138) | 100 | (9.73, 75–125) | <0.001 |
| l-Lactate (enzymatic assay) (mmol/L), geo mean (95 % CI, range) | 1.7 | (1.6–1.9, 0.8–4.6) | 3.7 | (3.3–4.1, 0.8–14.4) | 2.9 | (2.2–3.8, 0.7–15.8) | 1.9 | (1.4–2.5, 0.3–11.5) | <0.001 |
| Albumin (g/L) | 30 | (6.3, 16–46) | 28 | (5.8, 14–49) | 28 | (6.3, 18–41) | 35 | (6.2, 17–47) | <0.001 |
| PO4 3- (mg/dl), geo mean (95 % CI, range) | 0.7 | (0.6–0.8, 0.1–3.0) | 2.1 | (1.8–2.3, 0.5–11.6) | 3.5 | (2.7–4.6, 1.0–12.9) | 2.9 | (2.5–3.3, 1.1–11.7) | <0.001 |
| HCO3 − (mmol/L) | 23.6 | (3.4, 15.4–38.9) | 19.0 | (5.4, 3.5–35.8) | 17.0 | (6.1, 4.5–30.8) | 24.2 | (6.5, 3.9–41.3) | <0.001 |
| pH | 7.437 | (0.053, 7.308–7.566) | 7.398 | (0.101, 6.931–7.615) | 7.312 | (0.182, 6.623–7.536) | 7.442 | (0.097, 7.054–7.549) | <0.001 |
| pCO2 (kPa) | 4.8 | (0.92, 3.1–8.5) | 4.2 | (1.04, 2.2–8.1) | 4.6 | (2.10, 1.8–11.1) | 4.8 | (1.14, 1.9–7.2) | <0.001 |
| SBD (mEq/L) | +1 | (+3.6, −15 to +9) | +6 | (+6.6, −11 to +29) | +9 | (+7.6, +3 to +30) | 0 | (+7.6, −19 to +27) | <0.001 |
| SIDeff (mEq/L) | 33.5 | (4.3, 22.9–50.8) | 28.1 | (6.1, 10.5–44.4) | 26.8 | (7.5, 11.4–44.2) | 36.4 | (6.9, 18.1–53.8) | <0.001 |
| SIDapp (mEq/L) | 39.5 | (4.4, 29.0–52.7) | 36.3 | (6.2, 13.8–52.4) | 35.7 | (7.2, 18.2–49.4) | 43.0 | (4.5, 32.1–53.3) | <0.001 |
| SIG (mEq/L) | 6.0 | (3.7, −5.5 to 15.1) | 8.2 | (4.5, −2.4 to 23.4) | 8.6 | (7.7, −4.9 to 30.2) | 6.6 | (5.1, −2.4 to 24.1) | 0.002 |
Abbreviations: CI confidence interval, geo mean geometric mean, HCO 3 − bicarbonate, pCO 2 partial pressure of carbon dioxide, PO 4 3- phosphate, SBD standard base deficit; SID app apparent strong ion difference, SID eff effective strong ion difference, SIG strong ion gap
For all values, means (SD, range) are reported unless stated otherwise; geometric mean, 95 % CI and range are reported for non-normally distributed variables
*P values were determined by analysis of variance between the four participant groups. Variables with a normal or near-normal distribution were analysed directly; others were log-transformed toward normality, then analysed
Identification of organic acids in plasma and urine
Of the eight candidate acids sought by LC-MS, four were present at detectable levels in both plasma and urine: LA, α-HBA, β-HBA and HPLA. EMA, MMA and α-KGA were undetectable in plasma but were detectable in urine. MA was undetectable in both plasma and urine. Table 3 summarises the observed range of acids detected in plasma and urine specimens taken from the study groups at the time of admission. Figures 1 and 2 compare plasma and corrected urine concentrations, respectively, between study groups.
Table 3.
Quantification of organic acids in plasma and urine
| Characteristics | Uncomplicated malaria N=102 | Severe malaria N=138 | Sepsis N=32 | Encephalopathy N=35 | P value* | ||||
|---|---|---|---|---|---|---|---|---|---|
| Geo mean | (95 % CI, range) | Geo mean | (95 % CI, range) | Geo mean | (95 % CI, range) | Geo mean | (95 % CI, range) | ||
| Plasma concentration (μmol/La) | |||||||||
| LA | 1680 | (1437–1965, 122–5019) | 4912 | (4389–5497, 835–27,958) | 2615 | (1970–3470, 305–11,002) | 1898 | (1380–2611, 293–17,132) | <0.001 |
| HPLA | 4.3 | (3.7–5.0, UD–13.0) | 10.6 | (9.5–11.8, 4.4–124.7) | 7.0 | (5.4–9.0, UD–30.0) | 4.4 | (3.4–5.6, UD–15.2) | <0.001 |
| α-HBA | 46.0 | (34.6–61.0, UD–270.1) | 117.7 | (106.3–130.4, 30.7–590.1) | 88.4 | (59.4–131.5, UD–411.3) | 86.8 | (63.8–118.1, 6.4–419.7) | <0.001 |
| β-HBA | 102.7 | (91.9–114.8, UD–715.7) | 143.9 | (128.9–160.5, UD–1620.0) | 223.5 | (147.4–338.8, UD–2720.0) | 146.8 | 103.9–207.3, UD–1651.0) | <0.001 |
| Corrected urine concentrations (μmol/mmol CrCl)a,b | N=78 | N=112 | N=19 | N=26 | |||||
| LA | 2.85 | (2.32–3.49, 0.44–41.77) | 12.97 | (9.67–17.40, 0.54–1357.22) | 13.47 | (5.54–32.74, 1.00–555.30) | 10.92 | (6.05–19.72, 1.45–215.30) | <0.001 |
| HPLA | 0.48 | (0.34–0.66, 0.01–7.08) | 1.61 | (1.28–2.04, 0.05–19.61) | 1.15 | (0.46–2.85, 0.03–17.12) | 0.50 | (0.29–0.88, UD–5.82) | <0.001 |
| α-HBA | 0.63 | (0.51–0.78, 0.08–11.86) | 1.26 | (0.98–1.63, UD–79.63) | 1.06 | (0.61–1.84, 0.19–17.37) | 1.16 | (0.91–1.48, 0.36–4.57) | <0.001 |
| β-HBA | 2.11 | (1.75–2.53, UD–11.99) | 3.42 | (2.83–4.12, UD–193.30) | 5.52 | (2.66–11.46, UD–36.28) | 3.40 | (2.27–5.09, UD–17.11) | <0.001 |
| EMA | 0.34 | (0.27–0.43, 0.06–17.46) | 0.26 | (0.21–0.32, UD–9.58) | 0.37 | (0.0.24–0.57, UD–2.33) | 0.36 | (0.26–0.49, UD–2.25) | 0.145 |
| MMA | 0.23 | (0.19–0.28, 0.03–2.85) | 0.20 | (0.16–0.24, UD–2.97) | 0.19 | (0.13–0.27, UD–0.45) | 0.21 | (0.14–0.31, 0.05–4.75) | 0.646 |
| α-KGA | 2.25 | (1.72–2.95, UD–5.44) | 3.18 | (2.53–3.98, UD–27.11) | 3.52 | (1.82–6.82, UD–12.91) | 3.89 | (2.58–5.86, UD–26.41) | 0.128 |
Abbreviations: LA lactic acid, geo mean geometric mean, HPLA hydroxyphenyllactic acid, α-HBA α-hydroxybutyric acid, β-HBA β-hydroxybutyric acid, EMA ethylmalonic acid, MMA methylmalonic acid, α-KGA α-ketoglutaric acid, CrCl creatinine clearance, UD undetectable
*Acid concentrations were log-transformed toward normality before analysis of variance. For plasma specimens, undetectable concentrations were treated as half the lower limit of detection to allow inclusion in intergroup comparisons. For corrected urine concentrations, undetectable values were treated as half the lowest value calculated from a detectable specimen
aFor all plasma specimens, EMA, MMA, α-KGA and malonic acid (MA) were assayed but undetectable. For all urine specimens, MA was assayed but undetectable
bCorrected urine concentrations were adjusted for impaired creatinine clearance by incorporating the urine/plasma creatinine ratio as described in the Methods section
Fig. 1.

Plasma strong ion gap (SIG), standard base deficit (SBD) and concentrations of lactic acid (LA), hydroxyphenyllactic acid (HPLA), α-hydroxybutyric acid (α-HBA) and β-hydroxybutyric acid (β-HBA). Black bars above the scatterplots denote significantly different participant groups identified with Tukey’s test and P<0.05. Error bars represent medians and interquartile ranges
Fig. 2.
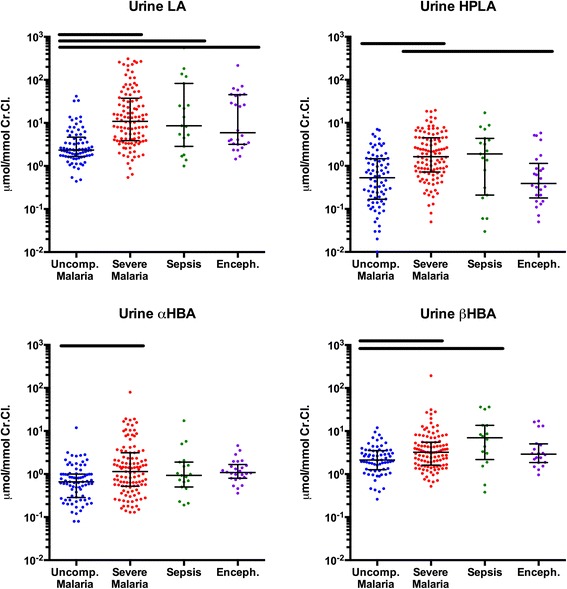
Urine concentrations of organic acids corrected for renal function. Black bars above the scatterplots denote significantly different participant groups identified with Tukey’s test and P<0.05. Error bars represent medians and interquartile ranges. Abbreviations: CrCl creatinine clearance, LA lactic acid, HPLA hydroxyphenyllactic acid, α-HBA α-hydroxybutyric acid, β-HBA β-hydroxybutyric acid
LA contributed most to the acid load in plasma and was significantly higher in severe malaria than in uncomplicated malaria, sepsis or encephalopathy.
There was a large difference in geometric mean (95 % CI) plasma HPLA concentration in patients with severe malaria (10.6 μmol/L; 9.5–11.8) compared with those with sepsis (7.0 μmol/L; 5.4–9.0), uncomplicated malaria (4.3 μmol/L; 3.7–5.0) or febrile encephalopathy (4.4 μmol/L; 3.4–5.6). Renal function–corrected urine concentrations of HPLA were also higher in patients with severe malaria than in those with uncomplicated malaria or encephalopathy.
Plasma β-HBA concentrations were significantly higher in patients with severe malaria than in those with uncomplicated malaria. Patients with sepsis had the highest relative and absolute concentrations of β-HBA in both plasma and urine. Levels of α-HBA in patients with severe malaria, sepsis or encephalopathy were higher than in those with uncomplicated malaria, but α-HBA levels were not distinguishable between patients with severe malaria and the reference groups. Corrected α-HBA urine concentrations were higher in patients with severe malaria than in patients with uncomplicated malaria.
Among participants with a positive SIG, the median total proportion of SIG that could be explained by HPLA, α-HBA and β-HBA was 3.4 % in patients with severe malaria (interquartile range [IQR] 2.1–7.0), compared with 4.2 % in patients with bacterial sepsis (IQR 2.0–15.6). The median proportion of SIG attributable to HPLA alone was 0.13 % in severe malaria (IQR 0.09–0.21), and 0.08 % in sepsis (IQR 0.04–0.18); these contributions were significantly different (P=0.018).
Plasma creatinine was correlated with HPLA (r=0.68; P<0.001) and β-HBA (r=0.21; P=0.016). Weaker correlations were seen between bilirubin and all four acids and between the parasite biomass marker PfHRP2 and all four acids. GCS score correlated inversely with all four acids. The complete correlation matrix is provided in Additional file 1: Table S1.
Prognostic significance of organic acids and their correlation with severity syndromes in patients with severe malaria
Admission plasma concentrations of LA, HPLA, α-HBA and β-HBA were each higher in patients with severe malaria who later died than in those who survived (Fig. 3). Of the four detectable acids, HPLA had the highest prognostic utility with an AUROCC of 0.79 (95 % CI 0.70–0.87), followed by LA with an AUROCC of 0.77 (95 % CI 0.69–0.86). The AUROCC for SBD was 0.75 (95 % CI 0.65-0.85), and the AUROCC for pH was 0.74 (95 % CI 0.64–0.83). Urine LA and HPLA also had prognostic value, but less than that of their plasma concentrations (data not shown).
Fig. 3.

Plasma concentrations of organic acids in severe malaria, stratified by disease outcome. Comparisons are drawn between patients who survived to discharge (n=99) and those who died (n=39). For all four acids, plasma concentrations were significantly higher among patients who later died, by unpaired t test of log-transformed concentrations (P<0.001 for LA, HPLA and β-HBA; P=0.001 for α-HBA). Error bars represent medians and interquartile ranges. Abbreviations: LA lactic acid, HPLA hydroxyphenyllactic acid, α-HBA α-hydroxybutyric acid, β-HBA β-hydroxybutyric acid
Logistic regression models were developed for patients with severe malaria, with in-hospital death as the dependent variable, to assess the prognostic value of plasma and urine organic acid concentrations (Table 4). An alternative multivariate model using clinical variables, including creatinine and PfHRP2, was undertaken, but it did not improve the performance of the model (data not shown). In the model of plasma acids in 138 patients (39 of whom died), HPLA and LA had independent prognostic value, with the combined model providing an AUROCC of 0.81. Among 112 participants with available urine specimens (34 of whom died), LA was the only urinary acid of significant independent prognostic value. The AUROCC for a model based on urinary LA alone was 0.72.
Table 4.
Summary of logistic regression models based on plasma acid concentrations (N=138) or urine acid concentrations (N=112) for probability of fatal outcome in participants with severe malaria
| Univariate analysis | Multivariate analysis | |||||||||
|---|---|---|---|---|---|---|---|---|---|---|
| β | (95 % CI) | OR | (95 % CI) | P | β | (95 % CI) | OR | (95 % CI) | P | |
| Regression of plasma acid concentrations | ||||||||||
| LA | 1.74 | (1.00–2.47) | 5.67 | (2.72–11.86) | <0.001 | 1.24 | (0.43–2.05) | 3.45 | (1.54–7.76) | 0.003 |
| HPLA | 1.76 | (1.02–2.51) | 5.82 | (2.76–12.26) | <0.001 | 1.25 | (0.48–2.02) | 3.48 | (1.61–7.52) | 0.001 |
| α-HBA | 1.22 | (0.53–1.91) | 3.40 | (1.71–6.78) | 0.001 | – | – | |||
| β-HBA | 1.09 | (0.45–1.73) | 2.98 | (1.57–5.64) | 0.001 | – | – | |||
| Regression of urine acid concentrations | ||||||||||
| LA | 0.54 | (0.25–0.84) | 1.723 | (1.28–2.31) | <0.001 | 0.54 | (0.25– 0.84) | 1.72 | (1.28–2.31) | <0.001 |
| HPLA | 0.58 | (0.21–0.96) | 1.791 | (1.23–2.61) | 0.002 | – | – | |||
| α-HBA | 0.23 | (−0.06 to +0.52) | 1.259 | (0.94–1.68) | 0.118 | – | – | |||
| β-HBA | 0.38 | (0.02–0.74) | 1.459 | (1.02–2.09) | 0.039 | – | – | |||
| MMA | −0.03 | (−0.36 to +0.29) | 0.966 | (0.70– 1.34) | 0.836 | – | – | |||
| EMA | 0.12 | (−0.22 to +0.46) | 1.126 | (0.80–1.58) | 0.489 | – | – | |||
| α-KGA | −0.13 | (−0.43 to +0.16) | 0.877 | (0.65–1.18) | 0.382 | – | – | |||
Abbreviations: OR odds ratio, LA lactic acid, HPLA hydroxyphenyllactic acid, α-HBA α-hydroxybutyric acid, β-HBA β-hydroxybutyric acid, EMA ethylmalonic acid, MMA methylmalonic acid, α-KGA α-ketoglutaric acid, AUROCC area under the receiver operating characteristic curve
Goodness of fit of the plasma acid model: AUROCC=0.81; Hosmer-Lemeshow=0.94; P=0.612, N=138. Goodness of fit of the urine acid model: AUROCC=0.72; Hosmer-Lemeshow=0.72; P=0.459, N=112. Concentrations were log-transformed to normality before analysis. All variables in univariate analysis were initially included in the model, then backward stepwise selection was performed, removing variables on the basis of P≥0.05
Discussion
Metabolic acidosis with an increased SIG and high SBD is a prominent feature of severe falciparum malaria, and severity of the acidosis is closely linked to mortality [4, 16, 23]. The present study shows that organic acids other than lactate also have a strong prognostic significance for death in adult patients with severe malaria. HPLA, α-HBA and β-HBA were all present at higher concentrations in plasma and urine of patients with severe malaria than in those with uncomplicated disease and also at higher plasma concentrations in patients who died than in those who survived. This identifies HPLA as an acid with strong independent prognostic significance, despite low absolute concentration. The elevation of HPLA was more pronounced in severe malaria than in patients with severe sepsis, whereas SBD and SIG were elevated in both groups. Patients with febrile encephalopathy were not acidotic, but some showed a strongly elevated SIG, suggesting a potential pathophysiological role for organic acids; however, the profile of acids we describe in severe malaria is distinct from that of non-malarial encephalopathy [24].
LA was detectable in plasma at a considerably higher concentrations than any other organic acid and was a strong independent predictor of death in patients with severe malaria, with a higher AUROCC than reported previously [4]. We consistently observed higher concentrations of LA detected by LC-MS than we did with the conventional enzymatic assay. This may reflect the fact that conventional enzymatic assays detect only the l-lactate isomers, whereas LC-MS detects both l- and d-isomers. Human metabolic pathways produce only l-lactate, but both isomers are produced by P. falciparum, as the parasite relies heavily on incomplete oxidation of glucose into LA for its own energy supplies [25]. Bacterially derived d-lactate can accumulate in the context of multiorgan failure, with increased transposition of bacteria from the ischaemic gastrointestinal tract [26–28], and it is noteworthy that d-lactate can cause an encephalopathy in humans ranging from disorientation to coma [29]. The hypothesis that d-lactate could contribute to the pathogenesis of severe malaria requires further quantification and study.
HPLA was identified at higher concentrations in the plasma and urine of participants with severe malaria than in reference groups, and it was a strong and independent predictor of mortality in patients with severe malaria. Although total HPLA concentrations were relatively low, the high prognostic value of HPLA may reflect perturbations in associated metabolic pathways, with related acids also contributing to the total acid load. Alternatively, this may indicate strong biological activity of the anion at low concentrations or local accumulation in affected tissues. HPLA is a product of l-tyrosine catabolism [30]. Plasma and urine HPLA concentrations are very low in health, but higher levels have been described in the context of critical illness [18, 31–35]. Adults with post-operative sepsis or hepatic encephalopathy have increased plasma and urine concentrations [34, 36]. Urinary excretion of HPLA has also been described in patients with tyrosinaemia type III, a rare inborn error of metabolism [37]. In these patients with neurological impairment, 4-hydroxyphenylpyruvate dioxygenase, the enzyme that converts hydroxyphenylpyruvate (HPPA) to homogentisate, is deficient, causing diversion of HPPA to HPLA. This raises the possibility that increased HPLA levels in severe malaria could be related to a functional blockade in the downstream pathway of HPPA. Interestingly, phenylalanine—an indirect precursor of HPPA—is elevated in both paediatric and adult patients with severe malaria [38, 39]. In addition to human metabolic pathways, gastrointestinal microflora (including Enterococcus faecalis, Escherichia coli, bifidobacteria and lactobacilli) can be a source of HPLA [35]. High levels of parasite sequestration occur in the gastrointestinal vasculature in severe malaria [40]. This could drive local ischaemia and bacterial translocation, with higher levels of HPLA entering the circulation. HPLA accumulation may also reflect changes to routes of clearance in severe disease. Its strongest identified biochemical correlation is with creatinine, so it may accumulate disproportionately in patients with kidney injury. It is noteworthy that other phenolic acids have been shown to influence brain metabolism in experimental studies in vivo and in vitro, altering neuronal and glial metabolism and inducing coma in rats [41–43]. A potential neurobiological role of HPLA in severe and cerebral malaria remains to be further elucidated.
β-HBA was high in plasma and urine of patients with severe malaria but highest in patients with severe sepsis. Concentrations were not independently correlated with mortality. β-HBA is synthesised in the liver from free fatty acids, and increased production of ketoacids can be related to the augmented metabolic demand, coupled with reduced oral caloric intake, in severe illness [18, 44, 45]. Elevated plasma β-HBA has been associated with severe malaria and other severe illnesses among children in Kenya [44].
Concentrations of α-HBA were high in patients with severe malaria, sepsis or encephalopathy, but they were not an independent predictor of mortality. α-HBA is a product of threonine and methionine catabolism, but it is also produced in glutathione synthesis during the conversion of cystathionine to cysteine. The glutathione pathway is upregulated to counteract oxidative stress, which is increased during severe malaria [22, 46]. Raised α-HBA levels may thus reflect increased production of glutathione. Raised levels of α-HBA have been found in the urine of patients with lactic acidosis, which may be related to the redox state of the cell [47].
We acknowledge the limitations of this hypothesis-generating study and the need for further, targeted exploration of the mechanisms by which the identified acids influence the pathogenesis of malaria. The heterogeneity of organ dysfunction in both severe malaria and severe sepsis complicates our understanding of both conditions, particularly with regard to the metabolic pathways implicated. This heterogeneity reduces the statistical power of our analysis; yet, significant conclusions emerge.
Conclusions
Concentrations of HPLA were significantly higher in patients with severe malaria than in patients with sepsis, febrile encephalopathy or uncomplicated malaria, which suggests a disease-specific role. HPLA also has prognostic significance independent of LA. Further research into the kinetics and biological effects of these acids, as well as into the contributing metabolic pathways, is warranted.
Key messages
Previously unmeasured organic acids could be identified in patients with severe falciparum malaria using a novel targeted LC-MS approach.
A tyrosine metabolite and two ketoacids were detected at increased concentrations in patients with severe malaria.
Lactate and 4-hydroxyphenyllactic acid were predictive of mortality in patients with severe malaria.
Our findings highlight metabolic pathways potentially implicated in disease pathogenesis.
Acknowledgements
We thank all study participants and participating hospital staff. This work was supported by the Wellcome Trust Major Overseas Programme Core Grant number 089275/Z/09/Z.
Abbreviations
- ANOVA
analysis of variance
- AUROCC
area under the receiver operating characteristic curve
- CI
confidence interval
- CrCl
creatinine clearance EDTA, ethylenediaminetetraacetic acid
- EMA
ethylmalonic acid
- GCS
Glasgow Coma Scale
- Hb
haemoglobin
- HCO3−
bicarbonate
- HPLA
hydroxyphenyllactic acid
- HPPA
hydroxyphenylpyruvate
- IQR
interquartile range
- LA
lactic acid
- LC-MS
liquid chromatography-mass spectrometry
- MA
malonic acid
- MMA
methylmalonic acid
- OR
odds ratio
- pCO2
partial pressure of carbon dioxide
- PfHRP2
Plasmodium falciparum histidine-rich protein 2
- SBD
standard base deficit
- SBP
systolic blood pressure
- SD
standard deviation
- SID
strong ion difference
- SIG
strong ion gap
- UD
undetectable
- WHO
World Health Organisation
- α-HBA
α-hydroxybutyric acid
- α-KGA
α-ketoglutaric acid
- β-HBA
β-hydroxybutyric acid
Additional file
AUROCCs of biochemical and clinical markers with prognostic significance at the time of initial assessment of patients with severe malaria as predictors of death, and correlation matrix of biochemical and clinical markers. (DOC 43 kb)
Footnotes
Competing interests
The authors declare that they have no competing interests.
Authors’ contributions
MTH, NS, and SJL drafted the manuscript. NS, NL, and JT devised and performed LCMS analyses. NJW, NPJD, and AMD conceived of the study. SD, MTH, RJM, MAF, MMUH, MAH, SMo, SMi, and CJW contributed to the design. MTH, SJL, SD, RJM, HWFK, KP, PC, KS, and KC provided clinical and diagnostic data collection and critically revised the manuscript. All authors read and approved the final manuscript.
Contributor Information
M. Trent Herdman, Email: mtherdman@gmail.com.
Natthida Sriboonvorakul, Email: Natthida@tropmedres.ac.
Stije J. Leopold, Email: stije@tropmedres.ac
Sam Douthwaite, samdouthwaite.1@googlemail.com.
Sanjib Mohanty, Email: sanjibmalaria@rediffmail.com.
M. Mahtab Uddin Hassan, Email: mahtabnipu@yahoo.com.
Richard J. Maude, Email: richard@tropmedres.ac
Hugh WF Kingston, Email: hugh@tropmedres.ac.
Katherine Plewes, Email: Katherine@tropmedres.ac.
Prakaykaew Charunwatthana, Email: Jib@tropmedres.ac.
Kamolrat Silamut, Email: oye@tropmedres.ac.
Charles J. Woodrow, Email: Charlie@tropmedres.ac
Kesinee Chotinavich, Email: nok@tropmedres.ac.
Md. Amir Hossain, Email: amir_hossain_ctg@yahoo.com.
M. Abul Faiz, Email: drmafaiz@gmail.com.
Saroj Mishra, Email: sarojrkl@gmail.com.
Natchanun Leepipatpiboon, Email: Natchanun.L@chula.ac.th.
Nicholas J. White, Email: nickwdt@tropmedres.ac
Nicholas PJ Day, Email: Nickd@tropmedres.ac.
Joel Tarning, Email: joel@tropmedres.ac.
Arjen M. Dondorp, Email: arjen@tropmedres.ac
References
- 1.Dondorp AM, Lee SJ, Faiz MA, Mishra S, Price R, Tjitra E, et al. The relationship between age and the manifestations of and mortality associated with severe malaria. Clin Infect Dis. 2008;47:151–7. doi: 10.1086/589287. [DOI] [PubMed] [Google Scholar]
- 2.World Health Organisation, Communicable Diseases Cluster Severe falciparum malaria. Trans R Soc Trop Med Hyg. 2000;94:S1–90. doi: 10.1016/S0035-9203(00)90300-6. [DOI] [PubMed] [Google Scholar]
- 3.Bruneel F, Tubach F, Corne P, Megarbane B, Mira JP, Peytel E, et al. Severe imported falciparum malaria: a cohort study in 400 critically ill adults. PLoS One. 2010;5:e13236. doi: 10.1371/journal.pone.0013236. [DOI] [PMC free article] [PubMed] [Google Scholar]
- 4.Day NP, Phu NH, Mai NT, Chau TT, Loc PP, Chuong LV, et al. The pathophysiologic and prognostic significance of acidosis in severe adult malaria. Crit Care Med. 2000;28:1833–40. doi: 10.1097/00003246-200006000-00025. [DOI] [PubMed] [Google Scholar]
- 5.Warrell DA, White NJ, Veall N, Looareesuwan S, Chanthavanich P, Phillips RE, et al. Cerebral anaerobic glycolysis and reduced cerebral oxygen transport in human cerebral malaria. Lancet. 1988;2:534–8. doi: 10.1016/S0140-6736(88)92658-X. [DOI] [PubMed] [Google Scholar]
- 6.Hanson J, Lam SW, Mahanta KC, Pattnaik R, Alam S, Mohanty S, et al. Relative contributions of macrovascular and microvascular dysfunction to disease severity in falciparum malaria. J Infect Dis. 2012;206:571–9. doi: 10.1093/infdis/jis400. [DOI] [PubMed] [Google Scholar]
- 7.Planche T, Onanga M, Schwenk A, Dzeing A, Borrmann S, Faucher JF, et al. Assessment of volume depletion in children with malaria. PLoS Med. 2004;1:e18. doi: 10.1371/journal.pmed.0010018. [DOI] [PMC free article] [PubMed] [Google Scholar]
- 8.Dondorp AM, Ince C, Charunwatthana P, Hanson J, van Kuijen A, Faiz MA, et al. Direct in vivo assessment of microcirculatory dysfunction in severe falciparum malaria. J Infect Dis. 2008;197:79–84. doi: 10.1086/523762. [DOI] [PubMed] [Google Scholar]
- 9.Dondorp AM, Desakorn V, Pongtavornpinyo W, Sahassananda D, Silamut K, Chotivanich K, et al. Estimation of the total parasite biomass in acute falciparum malaria from plasma PfHRP2. PLoS Med. 2005;2:e204. doi: 10.1371/journal.pmed.0020204. [DOI] [PMC free article] [PubMed] [Google Scholar]
- 10.Maude RJ, Beare NA, Abu Sayeed A, Chang CC, Charunwatthana P, Faiz MA, et al. The spectrum of retinopathy in adults with Plasmodium falciparum malaria. Trans R Soc Trop Med Hyg. 2009;103:665–71. doi: 10.1016/j.trstmh.2009.03.001. [DOI] [PMC free article] [PubMed] [Google Scholar]
- 11.Yeo TW, Lampah DA, Gitawati R, Tjitra E, Kenangalem E, McNeil YR, et al. Impaired nitric oxide bioavailability and l-arginine–reversible endothelial dysfunction in adults with falciparum malaria. J Exp Med. 2007;204:2693–704. doi: 10.1084/jem.20070819. [DOI] [PMC free article] [PubMed] [Google Scholar]
- 12.Yeo TW, Lampah DA, Gitawati R, Tjitra E, Kenangalem E, Piera K, et al. Angiopoietin-2 is associated with decreased endothelial nitric oxide and poor clinical outcome in severe falciparum malaria. Proc Natl Acad Sci U S A. 2008;105:17097–102. doi: 10.1073/pnas.0805782105. [DOI] [PMC free article] [PubMed] [Google Scholar]
- 13.Pukrittayakamee S, White NJ, Davis TM, Looareesuwan S, Supanaranond W, Desakorn V, et al. Hepatic blood flow and metabolism in severe falciparum malaria: clearance of intravenously administered galactose. Clin Sci (Lond) 1992;82:63–70. doi: 10.1042/cs0820063. [DOI] [PubMed] [Google Scholar]
- 14.Corey HE, Vallo A, Rodríguez-Soriano J. An analysis of renal tubular acidosis by the Stewart method. Pediatr Nephrol. 2006;21:206–11. doi: 10.1007/s00467-005-2081-8. [DOI] [PubMed] [Google Scholar]
- 15.Figge J, Rossing TH, Fencl V. The role of serum proteins in acid–base equilibria. J Lab Clin Med. 1991;117:453–67. [PubMed] [Google Scholar]
- 16.Dondorp AM, Chau TT, Phu NH, Mai NT, Loc PP, Chuong LV, et al. Unidentified acids of strong prognostic significance in severe malaria. Crit Care Med. 2004;32:1683–8. doi: 10.1097/01.CCM.0000132901.86681.CA. [DOI] [PubMed] [Google Scholar]
- 17.Forni LG, McKinnon W, Lord GA, Treacher DF, Peron JM, Hilton PJ. Circulating anions usually associated with the Krebs cycle in patients with metabolic acidosis. Crit Care. 2005;9:R591–5. doi: 10.1186/cc3806. [DOI] [PMC free article] [PubMed] [Google Scholar]
- 18.Moviat M, Terpstra AM, Ruitenbeek W, Kluijtmans LA, Pickkers P, van der Hoeven JG. Contribution of various metabolites to the “unmeasured” anions in critically ill patients with metabolic acidosis. Crit Care Med. 2008;36:752–8. doi: 10.1097/CCM.0B013E31816443CB. [DOI] [PubMed] [Google Scholar]
- 19.Balasubramanyan N, Havens PL, Hoffman GM. Unmeasured anions identified by the Fencl-Stewart method predict mortality better than base excess, anion gap, and lactate in patients in the pediatric intensive care unit. Crit Care Med. 1999;27:1577–81. doi: 10.1097/00003246-199908000-00030. [DOI] [PubMed] [Google Scholar]
- 20.Sriboonvorakul N, Leepipatpiboon N, Dondorp AM, Pouplin T, White NJ, Tarning J, et al. Liquid chromatographic-mass spectrometric method for simultaneous determination of small organic acids potentially contributing to acidosis in severe malaria. J Chromatogr B Analyt Technol Biomed Life Sci. 2013;941:116–22. doi: 10.1016/j.jchromb.2013.10.005. [DOI] [PMC free article] [PubMed] [Google Scholar]
- 21.Tran TH, Day NP, Nguyen HP, Nguyen TH, Tran TH, Pham PL, et al. A controlled trial of artemether or quinine in Vietnamese adults with severe falciparum malaria. N Engl J Med. 1996;335:76–83. doi: 10.1056/NEJM199607113350202. [DOI] [PubMed] [Google Scholar]
- 22.Charunwatthana P, Abul Faiz M, Ruangveerayut R, Maude RJ, Rahman MR, Roberts LJ, 2nd, et al. N-acetylcysteine as adjunctive treatment in severe malaria: a randomized, double-blinded placebo-controlled clinical trial. Crit Care Med. 2009;37:516–22. doi: 10.1097/CCM.0b013e3181958dfd. [DOI] [PMC free article] [PubMed] [Google Scholar]
- 23.Hanson J, Lee SJ, Mohanty S, Faiz MA, Anstey NM, Charunwatthana P, et al. A simple score to predict the outcome of severe malaria in adults. Clin Infect Dis. 2010;50:679–85. doi: 10.1086/649928. [DOI] [PMC free article] [PubMed] [Google Scholar]
- 24.Kellum JA, Bellomo R, Kramer DJ, Pinsky MR. Hepatic anion flux during acute endotoxemia. J Appl Physiol. 1995;78:2212–7. doi: 10.1152/jappl.1995.78.6.2212. [DOI] [PubMed] [Google Scholar]
- 25.Olszewski KL, Llinas M. Central carbon metabolism of Plasmodium parasites. Mol Biochem Parasitol. 2011;175:95–103. doi: 10.1016/j.molbiopara.2010.09.001. [DOI] [PMC free article] [PubMed] [Google Scholar]
- 26.Assadian A, Assadian O, Senekowitsch C, Rotter R, Bahrami S, Fürst W, et al. Plasma d-lactate as a potential early marker for colon ischaemia after open aortic reconstruction. Eur J Vasc Endovasc Surg. 2006;31:470–4. doi: 10.1016/j.ejvs.2005.10.031. [DOI] [PubMed] [Google Scholar]
- 27.Stolberg L, Rolfe R, Gitlin N, Merritt J, Mann L, Jr, Linder J, et al. d-Lactic acidosis due to abnormal gut flora—diagnosis and treatment of two cases. N Engl J Med. 1982;306:1344–8. doi: 10.1056/NEJM198206033062207. [DOI] [PubMed] [Google Scholar]
- 28.Halparin ML, Kamel KS. d-Lactic acidosis: turning sugar into acids in the gastrointestinal tract. Kidney Int. 1996;49:1–8. doi: 10.1038/ki.1996.1. [DOI] [PubMed] [Google Scholar]
- 29.Uribarri J, Oh MS, Carroll HJ. d-Lactic acidosis: a review of clinical presentation, biochemical features, and pathophysiologic mechanisms. Medicine (Baltimore) 1998;77:73–82. doi: 10.1097/00005792-199803000-00001. [DOI] [PubMed] [Google Scholar]
- 30.Bender DA. Amino acid metabolism. 3. Chichester, UK: John Wiley & Sons; 2012. The aromatic amino acids: phenylalanine, tyrosine and tryptophan; pp. 323–76. [Google Scholar]
- 31.Hoffmann G, Aramaki S, Blum-Hoffmann E, Nyhan WL, Sweetman L. Quantitative analysis for organic acids in biological samples: batch isolation followed by gas chromatographic-mass spectrometric analysis. Clin Chem. 1989;35:587–95. [PubMed] [Google Scholar]
- 32.Khodakova A, Beloboradova N. Microbial metabolites in the blood of patients with sepsis [abstract P5] Crit Care. 2007;11:S3. doi: 10.1186/cc5984. [DOI] [Google Scholar]
- 33.Deutsch JC. Determination of p-hydroxyphenylpyruvate, p-hydroxyphenyllactate and tyrosine in normal human plasma by gas chromatography-mass spectrometry isotope-dilution assay. J Chromatogr B Biomed Sci Appl. 1997;690:1–6. doi: 10.1016/S0378-4347(96)00411-2. [DOI] [PubMed] [Google Scholar]
- 34.Beloboradova NV, Olenin AY, Khodakova AS. Archiv Euromedica: advanced methods of diagnosis, treatment and prophylactics. 1 and 2. Hannover, Germany: Europäische Wissenschaftliche Gesellschaft; 2011. Phenylcarboxylic acids as potential markers for diagnosis of sepsis in cardiac surgery patients; pp. 20–6. [Google Scholar]
- 35.Beloborodova N, Bairamov I, Olenin A, Shubina V, Teplova V, Fedotcheva N. Effect of phenolic acids of microbial origin on production of reactive oxygen species in mitochondria and neutrophils. J Biomed Sci. 2012;19:89. doi: 10.1186/1423-0127-19-89. [DOI] [PMC free article] [PubMed] [Google Scholar]
- 36.Müting D, Wuzel H, Bucsis L, Flasshoff HJ. Urinary p-hydroxyphenyllactic acid as indicator of hepatic encephalopathy in patients with hepatic cirrhosis. Lancet. 1985;2:1365–6. doi: 10.1016/S0140-6736(85)92662-5. [DOI] [PubMed] [Google Scholar]
- 37.Endo F, Kitano A, Uehara I, Nagata N, Matsuda I, Shinka T, et al. Four-hydroxyphenylpyruvic acid oxidase deficiency with normal fumarylacetoacetase: a new variant form of hereditary hypertyrosinemia. Pediatr Res. 1983;17:92–6. doi: 10.1203/00006450-198302000-00002. [DOI] [PubMed] [Google Scholar]
- 38.Enwonwu CO, Afolabi BM, Salako LA, Idigbe EO, al-Hassan H, Rabiu RA. Hyperphenylalaninaemia in children with falciparum malaria. QJM. 1999;92:495–503. doi: 10.1093/qjmed/92.9.495. [DOI] [PubMed] [Google Scholar]
- 39.Lopansri BK, Anstey NM, Stoddard GJ, Mwaikambo ED, Boutlis CS, Tjitra E, et al. Elevated plasma phenylalanine in severe malaria and implications for pathophysiology of neurological complications. Infect Immun. 2006;74:3355–9. doi: 10.1128/IAI.02106-05. [DOI] [PMC free article] [PubMed] [Google Scholar]
- 40.Seydel KB, Milner DA, Jr, Kamiza SB, Molyneux ME, Taylor TE. The distribution and intensity of parasite sequestration in comatose Malawian children. J Infect Dis. 2006;194:208–5. doi: 10.1086/505078. [DOI] [PMC free article] [PubMed] [Google Scholar]
- 41.Windus-Podehl G, Lyftogt C, Zieve L, Brunner G. Encephalopathic effect of phenol in rats. J Lab Clin Med. 1983;101:586–92. [PubMed] [Google Scholar]
- 42.Hicks JM, Young DS, Wootton ID. The effect of uraemic blood constituents on certain cerebral enzymes. Clin Chim Acta. 1964;9:228–35. doi: 10.1016/0009-8981(64)90099-3. [DOI] [PubMed] [Google Scholar]
- 43.Krnjević K, Walz W. Acidosis and blockade of orthodromic responses caused by anoxia in rat hippocampal slices at different temperatures. J Physiol. 1990;422:127–44. doi: 10.1113/jphysiol.1990.sp017976. [DOI] [PMC free article] [PubMed] [Google Scholar]
- 44.Sasi P, English M, Berkley J, Lowe B, Shebe M, Mwakesi R, et al. Characterisation of metabolic acidosis in Kenyan children admitted to hospital for acute non-surgical conditions. Trans R Soc Trop Med Hyg. 2006;100:401–9. doi: 10.1016/j.trstmh.2005.07.010. [DOI] [PMC free article] [PubMed] [Google Scholar]
- 45.Record CO, Iles RA, Cohen RD, Williams R. Acid–base and metabolic disturbances in fulminant hepatic failure. Gut. 1975;16:144–9. doi: 10.1136/gut.16.2.144. [DOI] [PMC free article] [PubMed] [Google Scholar]
- 46.Lord RS, Bralley JA. Clinical applications of urinary organic acids. Part I: Detoxification markers. Altern Med Rev. 2008;13:205–15. [PubMed] [Google Scholar]
- 47.Pettersen JE, Landaas S, Eldjarn L. The occurrence of 2-hydroxybutyric acid in urine from patients with lactic acidosis. Clin Chim Acta. 1973;48:213–9. doi: 10.1016/0009-8981(73)90367-7. [DOI] [PubMed] [Google Scholar]