

Abstract
Background:
Across Canada, pharmacists have expanded their scope of practice by performing medication management (MM) services. However, little is currently known about the opinions and attitudes of patients and the general population toward MM services.
Methods:
A cross-sectional online survey, including a best-worst scaling task, was designed to understand the general public’s opinions, preferences and willingness-to-pay with respect to MM services in British Columbia.
Results:
Of 977 individuals contacted, 819 responded to the questionnaire (84% response rate). The mean age was 45 years (standard deviation [SD] 16 years), and 37% were male. Overall, 93% of respondents felt that the medication advice from their pharmacist resulted in improvement in patient outcomes and/or medication use. This was also selected as the “best” attribute of MM, while other preferred attributes of MM included being able to obtain an appointment with the pharmacist on the same day or via walk-in, improved patient-physician relationships and MM sessions able to be completed in 15 minutes with the pharmacist. The average willingness to pay for MM was $24.55 (SD $21.44). Younger males with higher household income and those who had had MM in the past were willing to pay more for MM services out of pocket.
Discussion and Conclusion:
The accessibility of pharmacists was valued highly by respondents who, overall, were supportive of MM services and recognized the potential of pharmacists’ involvement in drug therapy management to improve patient outcomes and medication use. Alternative models of funding are worth considering for the sustainability of MM service provision.
Knowledge into Practice.
Pharmacists in Canada have only recently begun providing medication management (MM; called medication therapy management [MTM] in the United States); as such, little is known about the general public’s opinions and preferences for MM.
This study showed that patients are highly supportive of pharmacistprovided MM, citing improvements to their own health outcomes, medication use and knowledge of medications.
Despite these benefits, patients valued MM at an average maximum willingness-to-pay of $24.55 per session.
Pharmacists can continue to create value in MM by tailoring services to patients’ preferred attributes, including making MM sessions accessible on a same-day/walk-in basis.
Mise En Pratique Des Connaissances.
Cela fait peu de temps que les pharmaciens du Canada ont commencé à offrir des services de gestion des médicaments (GM), c’est pourquoi on en sait peu sur l’opinion et les préférences du grand public en matière de GM.
Cette étude a montré que les patients soutiennent fortement les services de GM offerts par les pharmaciens. Les participants ont mentionné une amélioration de leur état de santé, de l’utilisation des médicaments et de leurs connaissances sur ces produits.
Malgré ces avantages, les patients indiquent qu’ils sont disposés à payer en moyenne 24,55 $ maximum par séance de GM.
Les pharmaciens peuvent continuer d’accroître la valeur de la GM en personnalisant les services en fonction des préférences des patients, notamment en rendant les séances de GM accessibles (service le jour même, sans rendez-vous).
Background
Pharmacists in Canada perceive their expertise to be underused in a role traditionally focused on dispensing and are thereby advocating for broadening their scope of practice.1,2 With expanding scope of practice in many provinces, pharmacists are taking on additional responsibilities such as adapting prescriptions, prescribing, administering injections and performing comprehensive reviews of patients’ medications.3 In British Columbia (BC), medication management (MM) has been defined as a patient care service delivered by pharmacists that focuses on the identification and resolution of actual or potential drug therapy problems (DTPs) to optimize health outcomes related to pharmacotherapy.4
Some Canadian studies have shown a positive impact of MM on disease-specific measures for individuals with asthma,5,6 hypercholesterolemia7 and diabetes.8 Positive economic outcomes and satisfaction with care have also been demonstrated in some studies of MM.5-11 Despite these positive reports, there remain several challenges, such as low patient awareness of the service and knowledge gaps regarding the benefits and drawbacks experienced by patients and patient preferences for using this service. Little is currently known about the opinions and attitudes of patients and the general population toward MM services in Canada. A recent review of MM services (called medication therapy management [MTM] in the United States) found that the majority of patients surveyed were not aware of these services and many did not see a need for them.11 In general, patients were not willing to pay out of pocket for MTM services in the United States.11
In September 2010, the BC Ministry of Health and the BC Pharmacy Association introduced a pilot MM program,12 and since its completion in January 2012, there has been province-wide implementation of several MM services.13 One of the most widely provided MM services is medication review, whereby the pharmacist interviews the patient to prepare a best-possible medication history, assesses the patient’s medications for any DTPs, and then devises a care plan to resolve DTPs and evaluate results. In BC, all residents who are using 5 or more prescription or nonprescription medications are eligible for 1 full medication review and up to 2 follow-ups (in-person or phone call reviews to evaluate the care plan) annually.14 Pharmacists in BC also have the ability to adapt prescriptions as part of MM. Prescription adaptations involve extending renewals, changing the dose or regimen or making a therapeutic substitution to improve the outcome of the treatment. However, specific criteria pertaining to which prescriptions and conditions are eligible for prescription adaptations are more complex.15 Pharmacists certified for injections are also able to provide intradermal, intramuscular or subcutaneous injection for the prevention of disease, disorders or conditions and for the treatment of anaphylaxis.16 We conducted a province-wide survey of BC residents to investigate the general public’s utilization, satisfaction and willingness to pay (WTP) for MM services provided by pharmacists.
Methods
Study design
A cross-sectional online survey was designed to understand the general public’s opinions and preferences with respect to MM services in BC. This study was approved by the University of British Columbia Behavioural Research Ethics Board.
Population
Individuals from the general population who were 19 years of age or older, able to communicate in English and residing in BC were contacted and recruited via Ipsos Reid Canada from October 16 to November 13, 2013. Ipsos Reid Canada has previously obtained consent to contact from their panel of members. Contact was initiated via e-mail, with an initial letter of information about the survey and a link to the online survey. When respondents accessed the survey online, they were directed to the consent page. After providing consent, each participant answered the online survey and responses were captured anonymously in a secure database. Two e-mail reminders were sent during the course of the recruitment period. Those who completed the survey received honoraria including points that can be redeemed for gift cards, charity donations or cash.
Survey
The survey included sociodemographic information and respondents’ self-reported health status. The survey also contained multiple-choice questions relating to MM, including frequency of service utilization, knowledge of and satisfaction with MM, perceived importance of MM, patient selection and WTP for MM. With additional consultation with the BC Pharmacy Association and the Ministry of Health, the survey questions were developed based on results of focus groups with 14 individuals from the general population.
Best-worst scaling
In addition to the survey, a best-worst scaling task was included in which respondents were asked to indicate the most preferred (best) and least preferred (worst) attributes in a choice set consisting of attributes of MM services derived from focus group results.17 When a respondent selects items as “best” and “worst” in a choice set, it means that the difference of utility between these 2 items for that individual is the greatest among other possible pairs. After repeated rounds of best-worst choices, we can obtain a full ranking of items that reveals the preferences of the general public for each of the attributes of MM services. From focus group results, a list of 13 attributes of MM services was compiled for the scaling task (see Appendix 1, available online at cph.sagepub.com/supplemental). In the scaling task, respondents were asked to choose the “best” and “worst” attributes from 4 presented choices (this comprised the choice set) leaving 2 attributes unselected; an example of a choice set is shown in Figure 1. A total of 13 different choice sets were presented, resulting in 12 possible pairs of attributes in which one of had been selected as “best” and one as “worst”; a final ranking of the 13 attributes could then be calculated for each respondent.
Figure 1.
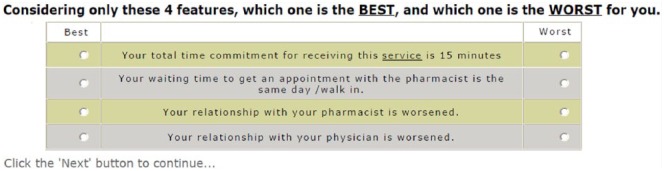
Example of one choice set from the best-worst scaling task
Analysis
Means, medians, standard deviations and ranges were calculated for continuous variables; frequencies or proportions were computed for categorical variables. A series of univariate and multivariate regression models were constructed to examine the effect of sociodemographic factors and respondent experience with MM on WTP for MM. We divided WTP responses into intervals of $0-$20, $21-$40, $41-$60 and >$60, as the dependent variable in an ordinal logistic regression model; however, the proportional odds assumption was not satisfied, so we used multinomial logistic regression analysis to determine relationships between demographic factors and individuals’ WTP. Reported odds ratios are those compared with the reference level of $0-$20.
We performed multinomial logistic regression on the responses of the best-worst scaling task to estimate the relative importance of each MM attribute. Reported regression coefficients (β) represent the relative preferences for each attribute. The least preferred attribute was taken as the reference level. Detailed methodology on the analysis of best-worst scaling responses is discussed elsewhere.18 SAS statistical software version 9.2 (SAS Institute Inc, Cary, North Carolina, USA) was used to perform all analyses.
Results
Demographics
A total of 977 individuals from the Ipsos database met the inclusion criteria and were contacted with an invitation to our survey; of these, 819 participants completed the survey (84% response rate). The mean age of respondents was 45 years (standard deviation [SD] 16 years), and their ages ranged from 19 to 82 years. Thirty-seven percent of respondents were male, the majority of respondents were married or living in a common law setting (52%) and 65% had at least some postsecondary education and were representative of all levels of income (Table 1).
Table 1.
Respondent demographics and self-reported health status
| Demographics | Frequency (n = 819) | Percentage |
|---|---|---|
| Age, years, mean (SD) | 45 (16)* | |
| Sex | ||
| Male | 301 | 37 |
| Female | 518 | 63 |
| Highest education | ||
| Elementary school | 13 | 2 |
| High school or equivalent | 181 | 22 |
| Vocational/technical school | 91 | 11 |
| Some college/university | 254 | 31 |
| Undergraduate college/university degree | 187 | 23 |
| Graduate or professional degree | 90 | 11 |
| Prefer not to respond | 3 | 0 |
| Income | ||
| Under $10,000 | 31 | 4 |
| $10,000–$19,999 | 81 | 10 |
| $20,000–$29,999 | 95 | 12 |
| $30,000–$39,999 | 90 | 11 |
| $40,000–$49,999 | 102 | 12 |
| $50,000–$74,999 | 149 | 18 |
| $75,000–$99,999 | 96 | 12 |
| $100,000–$150,000 | 69 | 8 |
| Over $150,000 | 20 | 2 |
| Prefer not to respond | 86 | 11 |
| Marital status | ||
| Married or living in common law | 424 | 52 |
| Single (never married) | 256 | 31 |
| Widow or widower | 25 | 3 |
| Separated or divorced | 106 | 13 |
| Prefer not to respond | 8 | 1 |
| Medical condition | ||
| Respiratory (e.g., asthma, chronic obstructive pulmonary disease, emphysema) | 135 | 16 |
| Musculoskeletal (e.g., arthritis) | 126 | 15 |
| Behavioural/mood (e.g., depression, bipolar, schizophrenia, anxiety) | 198 | 24 |
| Gastrointestinal (e.g., ulcers, acid reflux, Crohn’s disease, inflammatory bowel disease) | 143 | 17 |
| Liver (e.g., hepatitis, cirrhosis, fatty liver disease) | 22 | 3 |
| Cardiovascular (e.g., hypertension, stroke, heart attack, angina) | 105 | 13 |
| Visual (e.g., glaucoma, vision loss) | 67 | 8 |
| Renal/kidney problems | 32 | 4 |
| Endocrine (e.g., diabetes) | 44 | 5 |
| Neurological (e.g., multiple sclerosis, Parkinson’s disease) | 12 | 1 |
| Cancers | 8 | 1 |
| Learning difficulties | 34 | 4 |
| Hearing problems | 71 | 9 |
| Other | 44 | 5 |
| None | 15 | 2 |
| Family doctor | ||
| Yes | 701 | 86 |
| No | 118 | 14 |
| Prescription medications | ||
| None | 327 | 40 |
| 1-3 | 351 | 43 |
| 4-6 | 101 | 12 |
| 7-9 | 31 | 4 |
| More than 10 | 9 | 1 |
| Nonprescription medications | ||
| None | 363 | 44 |
| 1-3 | 424 | 52 |
| 4-6 | 23 | 3 |
| 7-9 | 7 | 1 |
| More than 10 | 2 | 0 |
All values expressed as n and % except age, which is presented as mean (SD).
Self-reported health status and health care utilization
The most common medical conditions reported by this sample were behavioural/mood disorders (24%), gastrointestinal conditions (17%), respiratory conditions (16%), musculoskeletal conditions (15%) and cardiovascular conditions (13%) (Table 1). Most of the respondents in this population were taking fewer than 4 prescription (83%) or nonprescription (96%) medications. Sixty-nine percent of the respondents indicated that they regularly interact with their pharmacist for medication advice, 40% of whom interacted with their pharmacist every 2-5 months, 24% every 6-12 months and 17% once a month. Eighty-six percent of the respondents reported having a regular family physician.
Attitudes and opinions on MM
Fifty-eight percent (n = 475) of respondents were aware that pharmacists provided MM services. Of these, 60% (n = 290) had received medication review services, 38% (n = 182) had had a prescription adapted and 24% (n = 113) received injections. Of all the components of MM presented, respondents thought medication review services were most important (39%), followed by prescription adaptation (19%) and counselling on nonprescription medications (18%). When asked to rate on a scale of 1 to 10 (not at all adequate to more than adequate), “to what extent do you feel that the medication advice received from your pharmacist was adequate in addressing medication-related needs?” 64% rated their experience ≥8 and mean rating was 7.9 (SD 1.7). Ninety-three percent of respondents felt that the medication advice from their pharmacist resulted in improvement in their outcome and/or medication use. In open-ended questions about benefits and drawbacks experienced with MM services, respondents commented on an improved understanding of their medications, the avoidance of drug interactions and allergic reactions and the overall accessibility of pharmacists compared with physicians as benefits. One respondent identified confusion in communication between a doctor and a pharmacist as the only drawback.
Sixty-three percent of respondents indicated that they believe additional health services are needed to help patients optimize the use of their medications. Of these respondents, 62% felt that physicians are the most important health care provider in providing this service, while 27% felt that it should be pharmacists.
To determine how respondents valued pharmacy services among other health services not subsidized by the government, respondents were asked to rank the importance of various health services from most to least important in 2 situations: 1) where patients had to pay for the health service themselves and 2) where the service was paid for by third-party insurance. If respondents had to pay themselves, they most frequently ranked dental services as most important (33%), then pharmacy services (22%) and counselling/psychology services (14%). If services were paid for by third-party insurance, respondents most frequently ranked dental services as most important (37%), then pharmacy services (18%) and optometry services (11%).
Patient selection for MM
Respondents were asked how a patient should be selected to receive MM from a list of options—50% indicated that physicians should refer patients to the pharmacist for this service on an “as-needed” basis, 29% indicated that pharmacists should select the patients based on specified criteria and 27% indicated that patients should be able to ask for the service based on their own needs. When asked which characteristics should be used to select patients eligible to receive medication management paid for by the government, 75% of respondents indicated that there should be a threshold of the number of medications used by the patient, with the majority (64%) selecting the threshold as “4 or more medications,” 18% selecting “7 or more medications,” 11% selecting “1 or more medications” and 7% selecting “other.” Age as a threshold was also chosen as another criterion by 39% of respondents, with 39% selecting the threshold as “age 50 or over,” 33% selecting “age 18 or over,” 21% selecting “age 65 or over” and 7% selecting “other.” Sixteen percent of respondents indicated that they felt eligible patients should have certain medical conditions, with examples reported in open-ended format including dementia, mental health disorders, cardiovascular conditions, cancer, diabetes or autoimmune conditions. Other criteria for patient selection were suggested by 14% of respondents and included low income level or those with difficulty adhering to medication regimens.
Payment and willingness to pay
Respondents were asked to indicate the maximum dollar value they were willing to pay for an MM service provided by pharmacists. One respondent who reported a WTP of $1000 for an MM service encounter with a pharmacist was dropped from the analysis due to being an extreme outlier. Of the 818 remaining responses, the average WTP per MM episode was $24.55 (SD 21.44). Of 818 respondents, 134 (16%) reported being willing to pay $0 for MM. We found age, sex, household income and whether the respondent had MM performed by a pharmacist in the past (“previous MM”) to have statistically significant relationships with WTP. With every 10-year increment in age, individuals were less likely to be willing to pay $41-$60 or >$60 for MM, compared with the reference level of $0-$20 (Table 2). Compared with females, males were approximately twice as likely to be willing to pay $41-$60 for MM services (OR 2.11, p < 0.01); the same trend was observed for WTP >$60 for MM, but the result was not statistically significant due to smaller numbers reporting in this group, as seen by the wider 95% confidence interval (Table 2). Compared with individuals reporting their household income to be ≥$50,000 annually, those with household income <$50,000 annually were almost half as likely to be willing to pay $41-$60 for MM services (OR 0.53, p < 0.01); a similar relationship was observed for WTP >$60 for MM, but again, this result was not statistically significant. Respondents who had had previous MM were 2.5 to 3 times more likely to be willing to pay $41-$60 or >$60, respectively, for MM (both p < 0.001). We found no statistically significant differences in WTP $21-$40 for MM compared with the reference level of $0-$20, based on any of the above-mentioned variables. No other associations were observed between WTP for MM and other demographic variables (education, marital status), number or types of medical conditions, or number of prescription or nonprescription medications.
Table 2.
Association of respondent sociodemographic factors and past experience with medication management with willingness-to-pay
| Per 10-year increase in age | Males vs females | Household income <$50,000 vs ≥$50,000 annually | Previous MM vs no previous MM | |||||||||
|---|---|---|---|---|---|---|---|---|---|---|---|---|
| WTP level* | OR | 95% CI | p | OR | 95% CI | p | OR | 95% CI | p | OR | 95% CI | p |
| $21-$40 | 0.95 | 0.86-1.04 | 0.27 | 0.86 | 0.61-1.21 | 0.39 | 0.72 | 0.52-0.10 | 0.05 | 1.39 | 0.91-2.12 | 0.12 |
| $41-$60 | 0.76 | 0.66-0.88 | <0.001 | 2.11 | 1.35-3.31 | <0.01 | 0.53 | 0.34-0.82 | <0.01 | 2.51 | 1.49-4.22 | <0.001 |
| >$60 | 0.60 | 0.47-0.77 | <0.001 | 1.95 | 0.96-3.97 | 0.06 | 0.55 | 0.27-1.11 | 0.10 | 3.19 | 1.49-6.85 | <0.001 |
CI, confidence interval; MM, medication management; OR, odds ratio; WTP, willingness-to-pay.
All comparisons are with the reference level of WTP $0-$20.
When asked whether patients would use MM services if they were covered 100% by the government or an insurance company, 81% indicated “yes,” while only 8% said they would use MM services if they had to pay 100% out of pocket. Thirty-two percent of respondents indicated they would use the service under a co-pay arrangement; of these, 38% would pay a maximum co-pay of up to $5 (of $60), 32% would co-pay a maximum of $10, 17% would co-pay a maximum of $15 and 13% would co-pay a maximum of $20.
Best-worst scaling
Respondents felt that the worst attribute of an MM service would be if the service resulted in worsened health and/or medication use, as all other levels were preferred over this outcome. Therefore, “worsening of health and/or medication use” was used as the reference level, and all other attribute levels were compared with this level to quantify the preferences for each. As seen in Figure 2, a 7-day waiting time for appointments with the pharmacist (β 0.496, SD 1.305) and a worsened relationship with the physician (β 0.560, SD 1.271) were the next worst possible attributes or outcomes of MM services.
Figure 2.

Relative patient preferences for attributes of medication management
Inset numbers are β-coefficients from multinomial logistic regression, representing relative preferences for each attribute of medication management. All p < 0.0001.
From the respondents’ perspective, the most important aspect of MM was whether their health and/or medication use improved (β 4.317, SD 1.597). The next most important attribute was being able to obtain an appointment with the pharmacist on the same day or via walk-in (β 3.355, SD 1.471). Respondents felt that other desirable attributes of MM included if the service improved their relationship with their physicians (β 3.483, SD 1.488) and if MM sessions could be completed within 15 minutes with the pharmacist (β 3.03, SD 1.465).
Discussion
This is the first Canadian study to determine the general population’s opinions, preferences and willingness to pay with respect to MM services. Respondents stated overall support for MM services and recognized advantages of pharmacist involvement in drug therapy management. Respondents consistently ranked MM services highly when compared with other health services not covered by government programs. Under self-payment or co-pay scenarios, members of the general population were willing to pay varying amounts to support MM. Respondents who had received MM in the past were willing to pay significantly more for MM services than those who had never received MM. Respondents’ most preferred attribute of an MM encounter was an improvement in their health and/or medication use. Respondents next most highly valued the accessibility of pharmacists, as best-worst scaling results showed that respondents had strong preferences for MM services to be accessible on a walk-in/same-day basis and to be completed within 15 minutes.
We have found through this cross-sectional survey of BC residents that 58% of respondents were aware that their pharmacies provided MM services. This finding is encouraging compared with results from previous studies conducted between 2007 and 2010 in various regions of the United States that showed that only 7% to 40% of respondents were aware of pharmacy provision of MTM services,19-22 despite MTM having been a part of Medicare Part D since 2006. In our study, most (69%) of the respondents indicated that they regularly interacted with their pharmacist and 93% of respondents felt that the medication advice from their pharmacist resulted in improvement in patient outcomes and/or medication use, demonstrating the overwhelming support by the public for pharmacists’ services. One surprising finding was that among respondents who felt that additional health services are needed to help patients optimize the use of their medications, only 27% believed that this should be the pharmacist’s role. In contrast, surveys in the United States found that 56% to 94% of patients believed that MTM was best provided by the pharmacist.20-22 This suggests that more promotion and public education should be done in Canada to increase awareness of pharmacists’ expertise in identifying and resolving drug therapy problems, pharmacists’ accessibility for providing MM and beneficial patient outcomes from MM services. As several studies indicated that MM is associated with improvements in health outcomes, increases in quality of chronic disease management and reductions in health care costs,23-28 it seems appropriate that maximizing the utilization of pharmacy services would result in better health outcomes and improved efficiency overall.
Currently, there exists wide variability in the types of services and their corresponding payments within different jurisdictions across Canada. For example, up to $20 per instance (depending on province) is paid for services such as prescription adaptation (including renewals, therapeutic substitutions and emergency supplies), immunization or pharmaceutical opinion; $40 is paid for the initial consultation for smoking cessation services; and $60 to $150 is paid for a medication review.29 Given that our findings demonstrate that patients are willing to pay an average maximum of $24.55 for MM, those who have previously received MM are willing to pay even more and a third of respondents are open to co-payment arrangement to support the provision of MM, these services appear to be valuable and worthwhile. However, one limitation and possible direction for future research is to validate and incorporate a satisfaction questionnaire to evaluate patient satisfaction with MM services provided by pharmacists.
Our survey had an excellent response rate, suggesting that the topic resonated with the participants. As such, the sample size (n = 819 out of 977 contacted, an 84% response rate) was sufficient to allow for robust analysis of results. Some limitations related to the recruitment methods of the respondents exist. As we used Ipsos to recruit respondents from their preselected panel, this could have resulted in selection bias. However, our sample was representative of BC residents; in the 2011 Census, the median age of BC residents was 42 years (whereas our study included only adults and had a mean age of 45 years).30 The proportion of BC residents who were married or living in a common law setting in 2011 was 58% (52% in our study).30 In BC, 27% of residents had completed a university degree and 25% had completed high school or equivalent (compared with 23% and 22% in our study, respectively).31
Conclusion
Among those who are aware of the expanding scope of practice of pharmacists in BC, many patients are highly satisfied with MM services provided by pharmacists. Still, more can be done to increase the public awareness of the role of pharmacists as medication experts and their accessibility and abilities in providing MM services. Alternative models of funding that explore patient out-of-pocket payment, third-party payer participation or co-payment systems are worth considering for the sustainability of MM service provision. ■
Supplementary Material
Footnotes
Author Contributions:All authors contributed to study design, interpretation of study results, critical review of the manuscript and approval of the final version submitted for publication. N. Tsao was responsible for survey construction, data analysis and manuscript writing. A. Khakban was responsible for design, construction, analysis and reporting of the best-worst scaling experiment. L. Gastonguay coordinated the focus group/interviews and contributed to survey construction and manuscript editing. K. Li contributed to data analysis and interpretation. L. Lynd and C. Marra conceived the study and obtained funding. C. Marra was responsible for posing the research question, research design and methods, and research staff supervision and contributed to manuscript writing and revisions.
Declaration of Conflicting Interests:The authors declared no potential conflicts of interest with respect to the research, authorship and/or publication of this article.
Funding:This study was funded by the British Columbia Pharmacy Association.
References
- 1. Canadian Pharmacists Association. Report to the House of Commons standing committee on health: examination into chronic diseases in Canada’s aging population and the role of the pharmacist. 2011. Available: www.pharmacists.ca/cpha-ca/assets/File/cpha-on-the-issues/HESASubmissionAgingChronicDiseases.pdf (accessed April 29, 2014).
- 2. Ontario Pharmacists’ Association. Ontario Pharmacists’ Association submission to the Health Professions Regulatory Advisory Council on scope of practice of pharmacy. 2008. Available: www.hprac.org/en/projects/resources/OntarioPharmacistsAssociationScopeofPracticeSubmission.pdf (accessed April 29, 2014).
- 3. Canadian Pharmacists Association. Summary of pharmacists’ expanded scope of practice across Canada. 2014. Available: http://blueprintforpharmacy.ca/docs/resource-items/pharmacists’-expanded-scope-of-practice_summary-chart---cpha---january-2014-from-graphicsDF4DC970F6835A01BE1C1989.pdf (accessed July 29, 2014).
- 4. BC Clinical Services Committee. British Columbia’s Clinical Services Committee: glossary of terms. 2013. Available: www.health.gov.bc.ca/pharmacare/pdf/medrev-gloss.pdf (accessed July 15, 2013).
- 5. McLean W, Gillis J, Waller R. The BC Community Pharmacy Asthma Study: a study of clinical, economic and holistic outcomes influenced by an asthma care protocol provided by specially trained community pharmacists in British Columbia. Can Respir J 2003;10:195-202. [DOI] [PubMed] [Google Scholar]
- 6. Smiley T. Community pharmacist care impact on asthma management in adults. Can Pharm J (Ott) 2007;140(Suppl 3):S30-S30.e8. [Google Scholar]
- 7. Tsuyuki RT, Johnson JA, Teo KK, et al. A randomized trial of the effect of community pharmacist intervention on cholesterol risk management: the Study of Cardiovascular Risk Intervention by Pharmacists (SCRIP). Arch Intern Med 2002;162:1149-55. [DOI] [PubMed] [Google Scholar]
- 8. Rosin J, Townsend K. Intervention and education in diabetes: a pilot project comparing usual care with pharmacist-directed collaborative primary care. Can Pharm J (Ott) 2008;141:346-51.e1. [Google Scholar]
- 9. Villeneuve J, Genest J, Blais L, et al. A cluster randomized controlled trial to evaluate an ambulatory primary care management program for patients with dyslipidemia: the TEAM study. CMAJ 2010;182:447-55. [DOI] [PMC free article] [PubMed] [Google Scholar]
- 10. Broadview Applied Research Group, Alberta Pharmacists’ Association. Alberta pharmacy practice models initiative: evaluation report. Edmonton (AB): Alberta Pharmacists’ Association; 2010. [Google Scholar]
- 11. Oladapo AO, Rascati KL. Review of survey articles regarding medication therapy management (MTM) services/programs in the United States. J Pharm Pract 2012;25:457-70. [DOI] [PubMed] [Google Scholar]
- 12. Davidson K. BCMMP paves the way for future of pharmacy. The Tablet 2012;21:18-21. Available: http://www.bcpharmacy.ca/uploads/Tablet_FebMar2012_BCMMP%20for%20web%20small.pdf. [Google Scholar]
- 13. College of Pharmacists of British Columbia. College of Pharmacists of BC: key initiatives. 2014. Available: http://www.bcpharmacists.org/professional-practice-policies-and-guides (accessed April 29, 2014).
- 14. BC Pharmacists Association. Medication review services. 2011. Available: www.bcpharmacy.ca/medication-review-service (accessed November 11, 2014).
- 15. College of Pharmacists of British Columbia. Medication management (adapting a prescription). 2013. Available: http://www.bcpharmacists.org/medication-management-adapting-prescription (accessed July 15, 2013).
- 16. College of Pharmacists of British Columbia. Medication management (administering injections). 2013. Available: http://www.bcpharmacists.org/injections-certification (accessed April 29, 2014).
- 17. Flynn TN, Marley AAJ. Best-worst scaling theory and methods. In: Hess S, Daly A. eds. Handbook of choice modelling. Cheltenham (UK): Edward Elgar Publishing; 2014. [Google Scholar]
- 18. Marley AAJ, Louviere JJ. Some probabilistic models of best, worst and best-worst choices. J Math Psychol 2005;49(6):464-80. [Google Scholar]
- 19. Doucette WR, Witry MJ, Alkhateeb F, et al. Attitudes of Medicare beneficiaries toward pharmacist-provided medication therapy management activities as part of the Medicare Part D benefit. J Am Pharm Assoc (2003) 2007;47:758-62. [DOI] [PubMed] [Google Scholar]
- 20. Truong H-A, Layson-Wolf C, de Bittner MR, et al. Perceptions of patients on Medicare Part D medication therapy management services. J Am Pharm Assoc (2003) 2009;49:392-8. [DOI] [PubMed] [Google Scholar]
- 21. Law AV, Okamoto MP, Brock K. Perceptions of Medicare Part D enrollees about pharmacists and their role as providers of medication therapy management. J Am Pharm Assoc (2003) 2008;48:648-53. [DOI] [PubMed] [Google Scholar]
- 22. Friedrich M, Zgarrick D, Masood A, Montuoro J. Patients’ needs and interests in a self-pay medication therapy management service. J Am Pharm Assoc (2003) 2010;50:72-7. [DOI] [PubMed] [Google Scholar]
- 23. Ramalho de, Oliveira D, Brummel AR, Miller DB. Medication therapy management: 10 years of experience in a large integrated health care system. J Manag Care Pharm 2010;16:185-95. [DOI] [PMC free article] [PubMed] [Google Scholar]
- 24. Isetts BJ, Schondelmeyer SW, Artz MB, et al. Clinical and economic outcomes of medication therapy management services: the Minnesota experience. J Am Pharm Assoc (2003) 2008;48:203-11; 3 p following 211. [DOI] [PubMed] [Google Scholar]
- 25. Cranor CW, Christensen DB. The Asheville Project: short-term outcomes of a community pharmacy diabetes care program. J Am Pharm Assoc (2003) 2012;52:838-50. [DOI] [PubMed] [Google Scholar]
- 26. Cranor CW, Bunting BA, Christensen DB. The Asheville Project: long-term clinical and economic outcomes of a community pharmacy diabetes care program. J Am Pharm Assoc (Wash) 2003;43:173-84. [DOI] [PubMed] [Google Scholar]
- 27. Bunting BA, Smith BH, Sutherland SE. The Asheville Project: clinical and economic outcomes of a community-based long-term medication therapy management program for hypertension and dyslipidemia. J Am Pharm Assoc (2003) 2008;48:23-31. [DOI] [PubMed] [Google Scholar]
- 28. Bunting BA, Cranor CW. The Asheville Project: long-term clinical, humanistic and economic outcomes of a community-based medication therapy management program for asthma. J Am Pharm Assoc (2003) 2006;46:133-47. [DOI] [PubMed] [Google Scholar]
- 29. Canadian Pharmacists Association. Pharmacists’ medication management services: environmental scan of activities across Canada. Blueprint for Pharmacy. 2013. Available: http://blueprintforpharmacy.ca/docs/kt-tools/canada-environmental-scan-of-pharmacy-services---cpha-october-2013---final.pdf (accessed November 5, 2014).
- 30. Government of Canada SC. British Columbia—focus on geography series—2011 Census. 2012. Available: www12.statcan.gc.ca/census-recensement/2011/as-sa/fogs-spg/Facts-pr-eng.cfm?Lang=Eng&GK=PR&GC=59 (accessed April 25, 2015).
- 31. Government of Canada SC. Education in Canada: attainment, field of study and location of study. 2014. Available: www12.statcan.gc.ca/nhs-enm/2011/as-sa/99-012-x/99-012-x2011001-eng.cfm (accessed April 25, 2015).
Associated Data
This section collects any data citations, data availability statements, or supplementary materials included in this article.