

Abstract
It has long been hypothesized that changes in gene regulation have played an important role in human evolution, but regulatory DNA has been much more difficult to study compared with protein-coding regions. Recent large-scale studies have created genome-scale catalogs of DNase I hypersensitive sites (DHSs), which demark potentially functional regulatory DNA. To better define regulatory DNA that has been subject to human-specific adaptive evolution, we performed comprehensive evolutionary and population genetics analyses on over 18 million DHSs discovered in 130 cell types. We identified 524 DHSs that are conserved in nonhuman primates but accelerated in the human lineage (haDHS), and estimate that 70% of substitutions in haDHSs are attributable to positive selection. Through extensive computational and experimental analyses, we demonstrate that haDHSs are often active in brain or neuronal cell types; play an important role in regulating the expression of developmentally important genes, including many transcription factors such as SOX6, POU3F2, and HOX genes; and identify striking examples of adaptive regulatory evolution that may have contributed to human-specific phenotypes. More generally, our results reveal new insights into conserved and adaptive regulatory DNA in humans and refine the set of genomic substrates that distinguish humans from their closest living primate relatives.
A number of traits distinguish humans from our closest primate relatives, including bipedalism, increased cognition, and complex language and social systems (for review, see O'Bleness et al. 2012). To date, the genetic basis of human-specific phenotypes remains largely unknown, complicated by the difficulties in distinguishing between phenotypically significant and benign variation. Thus, evolutionary changes in protein-coding sequences have received considerable attention, as the phenotypic consequences of these mutations have historically been easier to interpret (Clark et al. 2003; Stedman et al. 2004; Chimpanzee Sequencing and Analysis Consortium 2005; Nielsen et al. 2005; Arbiza et al. 2006; Dennis et al. 2012; Sudmant et al. 2013). Although protein-coding evolution has clearly played a role in human evolution, proteins account for only ∼1.5% of the human genome, most of which exhibit high sequence similarity between humans and chimpanzees (Chimpanzee Sequencing and Analysis Consortium 2005). However, between ∼2.5% and 15% of the human genome is estimated to be functionally constrained (Chinwalla et al. 2002; Lunter et al. 2006; Asthana et al. 2007; Meader et al. 2010; Ponting and Hardison 2011). Thus, the mutational target size of noncoding DNA is considerably larger than protein-coding sequences, suggesting that regulatory DNA is also an important substrate of evolutionary change, as originally proposed four decades ago (Britten and Davidson 1969; King and Wilson 1975). In some cases, detailed studies of individual genes have revealed human-specific regulatory evolution, such as in FOXP2, which is thought to have influenced traits related to speech and language in humans (Enard et al. 2002).
Nonetheless, interpreting patterns of interspecific divergence and intraspecific polymorphism in noncoding DNA has been considerably more challenging compared with those of protein-coding sequences. An elegant and powerful way to identify evolutionary changes in noncoding DNA of potential significance, originally described by Pollard et al. (2006b) and extensively used thereafter (Pollard et al. 2006a,b; Prabhakar et al. 2006; Kim and Pritchard 2007; Bush and Lahn 2008; McLean et al. 2010; Lindblad-Toh et al. 2011; Pertea et al. 2011), focuses on the discovery of sequences that are rapidly evolving or lost on the human lineage but that are otherwise phylogenetically conserved and thus likely functional. This approach has led to the discovery of several regions with species-specific enhancer activity (Prabhakar et al. 2008; Capra et al. 2013; Kamm et al. 2013), as well as human-specific deletion of regulatory DNA (McLean et al. 2011).
However, phylogenetic conservation is an imperfect proxy for function, particularly for noncoding regulatory sequences that can exhibit significantly high rates of turnover (Dermitzakis and Clark 2002; Wray et al. 2003; Villar et al. 2014). To more directly identify regulatory DNA, recent studies such as the ENCODE (The ENCODE Project Consortium 2012) and Roadmap Epigenomics Projects (Bernstein et al. 2010) have created genome-scale maps of DNase I hypersensitive sites (DHSs) in a large number of cell types. DNase I preferentially cleaves regions of open and active DNA, making it a powerful assay to identify regulatory elements, regardless of their specific function (Galas and Schmitz 1978; Dorschner et al. 2004). Although high-resolution maps of DHSs now exist, not all experimentally defined regulatory elements are expected to be functionally or phenotypically significant (Eddy 2012; Doolittle 2013; Graur et al. 2013; Niu and Jiang 2013).
Thus, we hypothesized that the synergistic combination of comparative and functional genomics would facilitate the high-resolution identification of conserved and human accelerated regulatory sequences. Here we describe the genome-wide architecture and characteristics of 113,577 DHSs that are conserved in primates and 524 DHSs that exhibit significantly accelerated rates of evolution in the human lineage (haDHSs). We estimate that ∼70% of substitutions within haDHSs are attributable to positive selection; we experimentally validated a large number of elements; and we perform extensive bioinformatics analyses that integrate information across multiple functional genomics data sets to better understand the functional and biological characteristics of haDHSs.
Results
Framework for identifying conserved and human accelerated regulatory DNA
To identify human accelerated regulatory DNA, we leveraged experimentally defined maps of DHSs from 130 cell types identified in the ENCODE and Roadmap Epigenomics Projects (Supplemental Table 1). After merging DHSs across cell types into 2,093,197 distinct loci (median size = 290 bp, SD = 159 bp), we used a whole-genome alignment of six primates from the EPO pipeline (Paten et al. 2008) to obtain separate alignments for each DHS, using strict filtering criteria for alignment quality. We performed two likelihood ratio tests to distinguish between DHSs that are evolving neutrally, are conserved among primates, or are conserved among primates but accelerated in the human lineage (Fig. 1). Specifically, we used a maximum likelihood test (Pollard et al. 2010) to first identify 113,577 DHSs that exhibit significant evolutionary constraint across primates, which manifest as regions of low sequence divergence compared with carefully defined putatively neutral flanking sequence (FDR = 0.01) (Fig. 1). Next, for DHSs that are conserved in primates, we performed a second likelihood ratio test (Pollard et al. 2010) and identified 524 regulatory sequences that have experienced a significant acceleration of evolution in the human lineage and therefore exhibit an excess of human-specific substitutions (FDR = 0.05) (Fig. 1; Supplemental Table 2). Importantly, to avoid biasing ourselves against identifying human acceleration, we excluded the human sequence in the first test for conservation.
Figure 1.

Identifying evolutionarily conserved and accelerated human regulatory sequences. Schematic shows the framework for identifying DHSs that are conserved in primates but accelerated in the human lineage. DHSs appear as peaks of high coverage along the genome and are merged across cell types. An alignment (purple and gray boxes) of six primates is obtained for each DHS and the neutral sequence surrounding them. Black bars represent any sequence that differs from the human sequence, except in the case where all species differ from human, which are represented as blue bars in the human sequence. Dotted red lines indicate the location of the DHS.
Characteristics of primate conserved regulatory DNA
We first characterized the set of DHSs conserved across primates. Approximately 93% of conserved DHSs overlap a phastCons conserved element, but many also contain short segments of less conserved sequence, making them overall less conserved than those identified by phastCons (Fig. 2A). We hypothesize that these less conserved sequences interspersed within DHSs may facilitate the rapid acquisition of novel transcription factor binding sites, as these regions are already actionable (i.e., accessible to proteins) and poised to evolve new functions compared with nonconserved sequences outside of DHSs.
Figure 2.
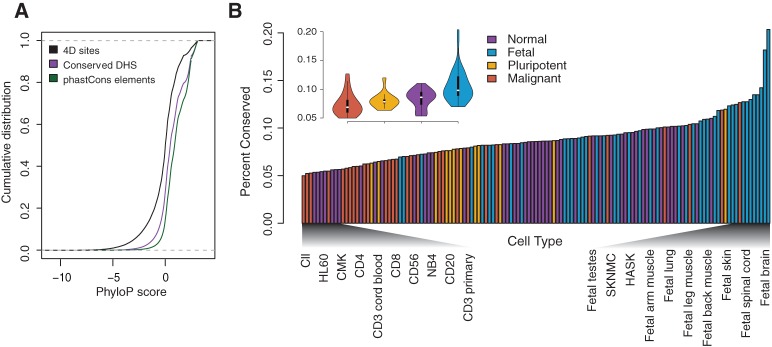
Patterns of conservation vary across cell types. (A) Cumulative distribution of single-base phyloP scores are shown for fourfold degenerate sites, conserved DHSs, and phastCons elements. The dotted gray line indicates a cumulative distribution of zero or one. (B) The proportion of conserved DHSs in each of the 130 cell types, ordered in increasing amounts of conservation. Colors denote four cell type categories: normal (purple), fetal (blue), pluripotent (yellow), or malignant (red). (Inset) Violin plot shows the distribution of the proportion of conserved DHSs for each cell type category. Cell type names at each end of the spectrum are shown for comparison.
Patterns of conservation varied significantly across cell type category (Kruskal–Wallis test; P = 5.08 × 10⁻⁸; Methods) (Fig. 2B), ranging from 5.0% of DHSs in chronic lymphocyte leukemia cells to 20.4% in fetal brain cells. DHSs active in fetal cell types showed the highest levels of conservation, consistent with the observation that gene regulation in developmental pathways is highly conserved (Lowe et al. 2011). Conversely, DHSs in malignant cell types exhibited the fewest conserved DHSs, which may reflect ectopic activation of chromatin (Vernot et al. 2012). These patterns are also observed in cell-type–specific DHSs (Supplemental Fig. 1a).
Genomic landscape of human accelerated regulatory DNA
We next investigated the set of haDHSs. Overall, these elements have evolved at approximately four times the neutral rate in the human lineage, while other primate branches have evolved at less than half of the neutral rate (Fig. 3A). In total, 70 haDHSs overlap previously identified human accelerated elements (HAEs) (Pollard et al. 2006b; Prabhakar et al. 2006; Bush and Lahn 2008; Lindblad-Toh et al. 2011), which is highly significant (permutation P < 1 × 10⁻⁵) (Fig. 3B). Thus, by focusing on experimentally defined regulatory DNA, we identify 454 novel loci that show accelerated rates of evolution in the human lineage, increasing the set of 1621 merged HAEs by 28%. The number of cell types each haDHS was active in varied substantially (Supplemental Fig. 2). Notably, 64% (337) of haDHSs were identified in at least one brain or neural cell type, and 88.5% (464) were active in at least one developing fetal tissue.
Figure 3.

Characteristics of human-accelerated DHSs. (A) Overlaid phylogenetic trees inferred in haDHSs (maroon) versus their flanking neutral regions (gray). The human branch is highlighted by the dashed rectangle. (B) Venn diagram showing overlap of haDHSs with human accelerated elements (HAEs) identified in previous studies. (C) The proportion of bases in haDHSs and conserved DHSs that are located in different functional classes of genomic sequence. (D) Distribution of haDHSs across the genome. Each vertical bar on the chromosome ideogram represents an haDHS. (Inset) Plot shows a region on Chromosome 4 near the TENM3 gene that contains five haDHSs. The fourth haDHS is enlarged to show that it is accessible in retinal pigment epithelial cells (blue) and is flanked by an H3K27ac signal (pink). Human substitutions are shown in red (weak to strong) and black (all others).
In comparison to conserved nonaccelerated DHSs, haDHSs are significantly enriched in noncoding regions (P = 1.16 × 10⁻⁷, hypergeometric test) (Fig. 3C). These data are consistent with the hypothesis that noncoding regions are more free to evolve and acquire new functions. Furthermore, we observed eight regions where four or more haDHSs were clustered within a 1-Mb window, suggesting coordinated changes in multiple regulatory elements (Fig. 3D). For instance, TENM3, which is required for establishing neuronal connections in vertebrate retinal ganglion cells (Antinucci et al. 2013; Merlin et al. 2013), is the nearest gene to five haDHSs, four of which are active in retinal pigment epithelial cells (Fig. 3D, inset).
Adaptive evolution is the primary determinant of rate acceleration in haDHSs
Human acceleration can result from both adaptive and nonadaptive forces (Haygood et al. 2007; Taylor et al. 2008; Kostka et al. 2012). We therefore performed a number of analyses to better understand mechanisms governing rate acceleration of haDHSs. First, to distinguish between relaxation of constraint and true rate acceleration on the human lineage, we applied a novel permutation test (Supplemental Text) and found that 91.8% of haDHSs were evolving faster than their surrounding neutral sequence, suggesting that most haDHSs are not the consequence of relaxed functional constraint. In contrast, it has been estimated that only 55% of HAEs exceed the neutral rate (Kostka et al. 2012). Second, we investigated the contribution of GC-biased gene conversion (GC-BGC) to our data, which influences rate acceleration of HAEs (Pollard et al. 2006a; Galtier and Duret 2007; Duret and Galtier 2009; Kostka et al. 2012), and found that 9.7% (51 haDHSs) show significant evidence of GC-BGC (Supplemental Text; Supplemental Fig. 3a). Finally, we investigated patterns of human–macaque divergence around haDHSs and found that local increases in mutation rate cannot explain rate acceleration in haDHSs, although mutation rate heterogeneity has influenced previous inferences of HAEs (Supplemental Text; Supplemental Fig. 3b; Pollard et al. 2006b; Prabhakar et al. 2006; Bush and Lahn 2008; Lindblad-Toh et al. 2011).
To more directly quantify the proportion of substitutions in haDHSs that can be attributed to positive selection, we used the McDonald-Kreitman framework and compared levels of polymorphism and divergence at haDHSs. Specifically, we used polymorphism data from the 1000 Genomes Project (The 1000 Genomes Project Consortium 2012) and calculated the statistic α, an estimate of the proportion of substitutions fixed by adaptive evolution. As a control, we first estimated α in conserved, nonaccelerated DHSs, which as expected was zero (95% CI −0.02–0.007) (Fig. 4A; Supplemental Fig. 4a). We estimate that 70.1% (95% CI 65.8%–73.7%) of substitutions can be attributed to positive selection in haDHSs (Fig. 4A), and this number is robust to mutation rate heterogeneity in the presence of complex demographic history (Supplemental Text; Supplemental Fig. 4b). To evaluate the sensitivity of α to GC-BGC, we removed all weak to strong substitutions in haDHSs and repeated the analysis. Although estimates of α decreased for haDHSs subject to GC-BGC, α increased slightly for other haDHSs, and thus the overall estimate remained almost identical (69.9%, 95% CI 64.2%–75.2%) (Fig. 4A). Of the remaining 29.9% of substitutions in haDHSs not accounted for by positive selection, we estimate 9.0% are expected without human-specific rate acceleration and 20.9% are attributable to additional factors such as relaxation of constraint (Fig. 4B). In support of this hypothesis, we find increased levels of nucleotide diversity in haDHSs and HAEs (Supplemental Text; Supplemental Fig. 5).
Figure 4.

Factors contributing to rate acceleration of haDHSs. (A) Estimates of the proportion of adaptive substitutions, α, and 95% bootstrap confidence intervals for different classes of haDHSs. Red and blue denote estimates that include or exclude weak to strong mutations, respectively. (B) Pie chart summarizing the proportion of substitutions in haDHSs inferred to be influenced by different factors. Expected indicates the proportion of substitutions assuming rates of evolution in the human lineage were the same as that in nonhuman primates; other, substitutions due to other factors such as relaxation of constraint or mutation rate heterogeneity.
haDHSs are developmental enhancers that exhibit lineage-specific activity
We performed extensive experimental studies to better understand the functional significance and potential regulatory roles of haDHSs. We found that nine of our haDHSs had previously been tested for in vivo enhancer activity using a transgenic mouse assay (Visel et al. 2007), and we tested nine additional loci. Overall, 13 out of 18 haDHSs were positive for enhancer activity in one or more tissues at the single time point assayed (e11.5) (Supplemental Table 3). These 13 haDHSs were active in a wide range of tissues (Fig. 5A), with the midbrain (n = 7), forebrain (n = 4), branchial arch (n = 4), and limb (n = 4) as the most frequent tissues showing enhancer activity. Patterns of enhancer activity varied from very broad to very tissue specific (Fig. 5A). One interesting example is located on 11p15 and is only active in the branchial arch (Fig. 5A). This haDHS is located in an intron of SOX6, and as we describe below, we find evidence that it contacts the SOX6 promoter. SOX6 is a developmental transcription factor involved in brain, bone, and cartilage development (Lefebvre et al. 1998). Notably, the branchial arch develops into several structures, including the jaw and larynx (Graham 2003), making this haDHS an intriguing candidate that potentially influences traits such as facial morphology and speech.
Figure 5.

Experimental assays of enhancer activity in haDHSs. (A) A schematic of the transgenic mouse model is depicted. Rows in the table correspond to each embryonic region, and numbers in parentheses indicate how many of the haDHSs were positive in the region indicated. Columns represent the 13 haDHSs that showed enhancer activity, and gray boxes indicate what tissues the haDHS was active in. Three examples of positive assays are shown above, along with a schematic depicting their location relative to nearby genes. The haDHS tested is shown in red, and other haDHSs in the region are shown in black. (B,C) Results from luciferase assays for haDHSs that showed significant enhancer activity in SK-N-MC and IMR90 cells, respectively. Dotted lines indicate the mean relative expression from the negative controls, and the gray box indicates haDHS human and chimpanzee sequences that showed significantly different activity (P < 0.05). Bars, SE. Asterisks below each plot indicate haDHSs that were active in SK-N-MC or IMR90 (other haDHSs were active in similar cell types, such as fetal brain or NHLF). (D) A schematic of the region surrounding haDHS12, which had the largest difference in enhancer activity. The haDHS is located just upstream of the alternatively spliced gene RNF145. Red substitutions are weak to strong, and all other substitutions are colored in blue. PhyloP scores are also shown across the region. This DHS was partitioned prior to statistical testing into two distinct DHSs. The red portion is human accelerated, and the black portion is not.
We also performed luciferase assays to functionally test haDHSs in a more high-throughput manner. Specifically, we experimentally tested 37 haDHSs in SK-N-MC cells (derived from a neuroepithelioma) and 20 haDHSs in IMR90 cells (fetal lung fibroblasts) by assaying for differences in regulatory activity of the human and chimpanzee orthologs using luciferase reporters. We chose SK-N-MC cells as a proxy for other neural cell types, and we chose IMR90 cells because many haDHSs were active in this cell type. Of the 37 pairs of haDHSs tested in SK-N-MC, 14 showed significant enhancer activity (P < 0.05) (Fig. 5B; Supplemental Fig. 6a), of which five (35%) exhibited significant differences between the human and chimpanzee haplotypes (P < 0.05) (Fig. 5B; Supplemental Fig. 6a; Supplemental Table 4). In IMR90, five out of 20 haDHSs showed significant evidence of enhancer function (P < 0.05) (Fig. 5C; Supplemental Fig. 6b; Supplemental Table 4), one (20%) of which exhibited significant differences in expression between the human and chimpanzee haplotypes. Human substitutions resulted in lower expression in four of the six haDHSs with significant differences in reporter activity between human and chimpanzee sequences (Fig. 5B,C). The haDHS with the largest difference in regulatory activity between humans and chimpanzees (2.32-fold increase in chimpanzees; P = 0.004) had five human-specific substitutions that overlapped several transcription factor binding motifs, and was located 186 base pairs upstream of RNF145, a zinc finger gene that is associated with variation in hematological traits (Fig. 5D; Soranzo et al. 2009). Although this haDHS is likely part of the promoter for RNF145, as described below, it may target several other genes, including IL12B and CLINT1.
Leveraging chromatin contact data to infer putative regulatory targets of haDHSs
Delineating the set of target genes that haDHSs regulate is key to determining their biological consequences and role in human evolution. However, identifying the targets of regulatory sequences poses a significant challenge. Enhancers often regulate distal genes, and in some cases, these may not be the closest genes to the enhancer (van Arensbergen et al. 2014). Chromatin conformation technologies such as Hi-C (Lieberman-Aiden et al. 2009) identify physical contacts between distinct segments of DNA and have been shown to identify long-range interactions between promoters and enhancers (Sanyal et al. 2012). We leveraged high-coverage Hi-C data from human IMR90 fibroblast cells to identify putative regulatory targets of haDHSs using a rigorous statistical method (Ay et al. 2014). We identified 9000 significant contacts for the 524 haDHSs at 40-kb resolution (FDR = 0.01) (Fig. 6A). On average, haDHSs overlap transcription start sites for 3.5 genes, highlighting the potential benefit of using more sophisticated strategies than simply identifying the nearest gene when inferring regulatory targets. We also found that haDHSs contact fewer genes on average than conserved DHSs (permutation P = 0.004), suggesting adaptive regulation is more likely to occur when pleiotropic effects are minimized. Furthermore, 119 haDHSs contact one or more transcription factors, and in total 132 distinct transcription factors are contacted by haDHSs. These include SOX6 (see Fig. 5A), RUNX2, and multiple HOX genes, all of which play important roles in development.
Figure 6.

Hi-C chromatin conformation data identify putative regulatory targets of haDHSs. (A) Contacts are shown for all haDHSs, and each row indicates the contacts for one haDHS, which is in the center. Black boxes indicate one 40-kb contact region. The schematic above illustrates how chromatin conformation information gets translated into the Hi-C contact data. Blue dots represent contact regions; the red dot, an haDHS. (B–D) Three example haDHSs are shown with their surrounding genes and a predicted transcription factor binding site that is affected by a human-specific mutation(s). Genes that contact the haDHSs in Hi-C data are highlighted in blue, with arrows pointing to their transcription start sites. Examples B and C depict substitutions that create transcription factor binding sites, while D is a binding site that is predicted to be lost in humans. Human-specific substitutions that go from a weak to a strong base are shown in red, while all other substitutions are shown in blue. Bar plots, FIMO (Grant et al. 2011) log likelihood ratios of motif calls in each species.
We performed a Gene Ontology (GO) enrichment analysis on the set of genes whose transcriptional start sites are contacted by haDHSs. Because haDHSs are a subset of conserved DHSs, we first performed the analysis on conserved DHS contact regions compared with the genomic background. We found that conserved DHS contacts are highly enriched for developmental genes, including those involved in neuron development (Supplemental Table 5), consistent with previous observations about conserved noncoding sequence (Lowe et al. 2011). Next, we tested for GO enrichments in haDHS contact genes using conserved DHS contact genes as the background and found a significant enrichment for developmental terms, including brain and neuron development (corrected P < 0.05) (Supplemental Table 5). These results show that haDHSs target genes are enriched for developmentally and neuronally important genes relative to conserved DHSs, which themselves are already highly enriched for these categories.
Three examples of haDHSs and their putative target regions are shown in Figure 6, B through D. All contain transcription factor motifs that are dramatically strengthened or weakened by human-specific substitutions. These haDHSs are likely targets of adaptive evolution as they show no evidence of GC-BGC and are evolving faster than surrounding neutral sequence. Moreover, all three are also active in only a small number of neuronal cell types, such as fetal brain and fetal spinal cord, indicating a potential role in human-specific cognitive phenotypes. Of particular interest is an haDHS on Chromosome 6 that lies in a gene desert 300 kb from POU3F2, a transcription factor that regulates FOXP2 in a human-specific manner (Fig. 6C; Maricic et al. 2013). Two of the substitutions in this haDHS strengthen a putative YY1 transcription factor binding site (Fig. 6C), which is known to mediate long-distance DNA interactions (Atchison 2014).
Discussion
Advances in DNA sequencing technology have led to a vast catalog of the variation in the genomes and epigenomes across many primates. However, interpreting the evolutionary, functional, and phenotypic significance of these differences and identifying the precise genetic changes that are causally related to human-specific traits remain a formidable challenge. Here, we have leveraged extensive maps of experimentally defined regulatory DNA and comprehensive comparative and population genomics analyses to identify and delimit the characteristics of conserved and human accelerated regulatory DNA. In total, we discovered 113,577 DHSs conserved in primates, 524 of which exhibit significant rates of acceleration in the human lineage.
We found marked heterogeneity in the distribution of conserved DHSs across cell types (Fig. 2B), with fetal cell types showing the largest amount of constraint. Conversely, DHSs in malignant cell types exhibited the lowest levels of conservation, an observation that may provide insight into cancer biology. For example, chromatin remodeling is disrupted in many cancers (Morin et al. 2010; Jiao et al. 2011). Previous work has shown that DHSs in malignant cell types are more likely to be cell-type specific and have levels of nucleotide diversity consistent with neutral evolution (Vernot et al. 2012). Thus, these observations combined with our results that DHSs in malignant cell types have low levels of evolutionary conservation suggest that many malignant DHSs may reflect ectopic chromatin activation.
Our results also provide new insights into human-specific adaptive regulatory evolution. Of the 524 haDHSs that we identified, 454 (87%) are novel and were not detected in previous studies of HAEs (Pollard et al. 2006b; Prabhakar et al. 2006; Bush and Lahn 2008; Lindblad-Toh et al. 2011). The haDHSs that we discovered are significantly less affected by GC-biased gene conversion and relaxation of functional constraint and have a higher proportion of substitutions that are estimated to be due to positive selection compared with previous catalogs of HAEs (Supplemental Fig. 3). We hypothesize these differences are largely the consequence of our study design that synergistically integrated experimentally defined regulatory sequences with phylogenetic conservation, which both focused our analyses to a subset of the genome enriched for functionally important sequence and limited the influence of confounding evolutionary forces. To support this hypothesis, we find that a higher proportion of haDHSs overlap human-specific enhancer marks in the cortex (Reilly et al. 2015) than HAEs (P = 7.62 × 10⁻⁵; Fisher's exact test). Large catalogs of experimentally defined regulatory DNA did not exist when HAEs were initially discovered, and we anticipate that the continued development of functional genomics technology will enable even more refined evolutionary analyses than described here.
To help interpret the functional and potential phenotypic significance of haDHSs, we performed extensive bioinformatics analyses and experimental validations. We found that haDHSs were significantly enriched in noncoding regions; a large proportion of experimentally tested elements showed enhancer activity; and many were active in brain or neural cell types and during fetal development. We also used Hi-C data to inform inferences of putative target genes that are regulated by haDHSs. These analyses revealed that haDHSs contact the transcriptional start sites of 132 transcription factors, suggesting that fine-tuning regulatory networks by tinkering with the sequences that govern the expression of regulatory proteins has been an important target of positive selection during human evolution. A number of transcription factors contacted by haDHSs are strong candidates for influencing hominin- or human-specific traits. For example, RUNX2 has been hypothesized to influence differential bone morphology in humans and Neanderthals (Green et al. 2010), and HOX genes play myriad roles in development. Another intriguing transcription factor contacted by an haDHS is POU3F2, which has recently been shown to regulate FOXP2 in a human-specific manner (Maricic et al. 2013). FOXP2 itself is a transcription factor that has previously been hypothesized to play a role in speech and language in humans (Enard et al. 2002). Our findings suggest that there may be additional levels of human-specific FOXP2 regulation via differential expression of POU3F2 expression. Furthermore, in addition to transcription factors, we identified other genes that are of significant biological interest. For instance, PEX2 is contacted by an haDHS with two substitutions that create a SMAD4 motif (Fig. 6B). Mutations in PEX2 can lead to Zellweger syndrome, characterized by a constellation of features, including impaired brain development and craniofacial abnormalities (Steinberg et al. 2006).
Our study has a number of important limitations. For example, the DHSs we used were ascertained only in human tissues. Although experimentally defined regulatory DNA has been generated in a limited number of nonhuman primates for a limited number of tissues (Shibata et al. 2012; Cotney et al. 2013), a more systematic and comprehensive effort would be of considerable value in understanding the evolution of regulatory sequences. Furthermore, we did not consider additional types of genetic variation, such as structural variation, that may influence human-specific phenotypes (Dennis et al. 2012; Sudmant et al. 2013). Furthermore, although there is evidence that chromatin conformation is relatively stable across cell types (Dixon et al. 2012), it would be of considerable interest to generate Hi-C or related data for a more comprehensive panel of cell types. These data, combined with gene expression profiles from the same tissue types, would provide further insights into the target genes regulated by haDHSs. Finally, the transgenic mouse and luciferase assays that we performed are only a first step in the experimental characterization of these and other elements that potentially contribute to human-specific phenotypes. Because the activity of a regulatory element may be highly cell-type- and developmental time point–specific, and depend on the coordination of additional regulatory elements, more extensive in vivo experiments would be fruitful. Nonetheless, associating particular haDHSs with specific phenotypes is complicated by the fact that the putative causal alleles are fixed in humans and thus refractory to traditional genetic mapping methods. However, if mutations at these sites are not lethal, given the current global population size of humans, such mutations are expected to exist, and their discovery could provide valuable phenotypic insights.
In short, our data provide substantial new insights into sequences that have experienced human-specific adaptive regulatory evolution, narrow the set of genetic changes that may influence uniquely human phenotype, and facilitate more detailed experimental and animal models of the most promising human-specific substitutions.
Ultimately, delineating the suite of genetic changes that have causally influenced human-specific phenotypes will provide insight into the evolutionary and molecular mechanisms that shaped our species evolutionary trajectory.
Methods
DNase I hypersensitivity sites
We used DNase I hypersensitivity peaks previously published as part of the ENCODE (The ENCODE Project Consortium 2012; Maurano et al. 2012) and Roadmap Epigenomics (Bernstein et al. 2010) Projects. A list of cell types is available in Supplemental Table 1. All peaks were called using the hotspot algorithm (John et al. 2011) and represent the 150-bp region of maximal DNase I signal. We merged DHSs across cell types using the BEDOPS package (Neph et al. 2012). Many DHSs were very long after merging (>2000 bp), probably because they consist of distinct regulatory elements located in close succession along the genome. To avoid analyzing distinct, potentially independently evolving regulatory elements as a single unit, we segmented merged DHSs according to the number of cell types each region was active in (Supplemental Text).
Primate alignments
We downloaded the six primate EPO alignment from Ensembl version 70 (Flicek et al. 2014). By use of this, we obtained an alignment for each DHS and the surrounding 50 kb of sequence. We masked all sites that were polymorphic in the 1000 Genomes Project (The 1000 Genomes Project Consortium 2012) integrated phase 1 data (March 2012) at <95% allele frequency, all repeat masked bases (lower case mark up in the EPO alignment), and all sites that were part of a CpG in any species in the alignment. In the surrounding 50 kb, we additionally masked all segmental duplications (UCSC Table Browser), coding exons (UCSC RefSeq genes) padded by 10 bp in order to remove splice sites, promoters (500 bp upstream of transcription start sites), other DHSs, and phastCons Eutherian mammal and primate conserved elements (UCSC phyloP46way). This helped ensure that the 50-kb surrounding region was a more appropriate approximation of the neutral evolutionary model for each DHS. We filtered any DHS in which (1) <90% of the bases remained unmasked in the DHS or (2) <15 kb remained unmasked in any of the six primates in the neutral region. Note, the EPO alignment is based on GRCh37 (hg19), and all subsequent analyses were done using GRCh37 coordinates. Given that we focus on conserved elements, which are by definition located in regions of the genome that are well resolved and alignable, we do not anticipate realigning to GRCh38 would significantly affect our results.
Identifying conserved and accelerated DHSs
DHSs that passed filtering were tested for overall conservation along the primate lineage with software from the PHAST package (Pollard et al. 2010; Hubisz et al. 2011). For each DHS, we first ran phyloFit on the neutral alignment of the surrounding 50 kb with the parameters –nrates 4 –subst-mod SSREV –EM. We used the newick tree provided with the six primate alignment in Ensembl. The resulting file was used as the neutral model while running phyloP; phyloP was run with the parameters –method LRT –mode CON after removing human sequence from the alignment. DHSs that were conserved at an FDR of 1% as determined with the Q-value package (http://github.com/jdstorey/qvalue) for R (R Core Team 2014) were then tested for human acceleration. For this test we used the same neutral model of evolution, this time using the parameters –method LRT –mode ACC –subtree homo_sapiens. DHSs significant for human acceleration at an FDR of 5% were considered in further analyses. We evaluated the accuracy of the FDR using a sampling approach (Supplemental Text).
To determine the overall rate of evolution in the neutral regions compared with haDHSs, we first concatenated sequence from both sets of regions and then conducted the same set of tests on the regions as a whole. To determine how much faster the human branch in the haDHSs was evolving compared with the expected rate, we multiplied the estimated neutral human branch length by the estimated conservation scale factor and divided the actual haDHS human branch length by this expected number.
Distribution of DHSs across cell types and genomic location
To determine how conserved and accelerated DHSs were distributed across cell types, we used the bedmap program from the BEDOPS suite (Neph et al. 2012) to map DHSs from individual cell types onto the set of merged DHSs. We then calculated the proportion of DHSs in each cell type that were called as conserved and the proportion of conserved DHSs that were also called as accelerated (Fig. 2B; Supplemental Fig. 1a–c).
Distribution of DHSs and haDHSs across the genome was assessed using UCSC Known Gene annotations from the UCSC Genome Browser, downloaded on May 14, 2013. Annotations were filtered to contain only “canonical” transcripts from the knownCanonical table. Promoters were defined as the 500 bp upstream of a transcription start site. To identify physical clusters of haDHSs, we expanded each haDHS by 500 kb on either side and then used the bedmap –count command from the BEDOPS suite (Neph et al. 2012) to count the number of haDHSs and conserved DHSs within each 1-Mb region.
Other HAEs
We obtained previously identified HAEs (Pollard et al. 2006a,b; Prabhakar et al. 2006; Bush and Lahn 2008; Lindblad-Toh et al. 2011) and assessed overlap using the bedmap program from the BEDOPS package (Neph et al. 2012). When comparing our haDHSs to these other HAEs, we merged all HAEs, again using the BEDOPS program. It was useful for us to compare haDHSs to DHSs that were conserved but not accelerated. In order to do similar analyses using the HAEs, we merged phastCons Eutherian mammal and primate elements (UCSC Genome Browser) and considered any element that was >100 bp.
To determine if the amount of overlap between haDHSs and other HAEs was significant, we created an empirical null distribution by randomly sampling 524 conserved DHSs 104 times and determining overlap with HAEs for each sample.
Population genetics analyses
We downloaded the phase 1 integrated release data from the 1000 Genomes Project (The 1000 Genomes Project Consortium 2012) and filtered sites according to several criteria (Supplemental Text). We calculated α as described previously (Charlesworth 1994), using the equation 1 − (PsFn/PnFs), where P = number of polymorphic sites, F = number of human-specific substitutions, S = number of selected sites, and N = number of neutral sites. We considered bases within haDHSs to be putatively selected and bases in the surrounding 4-kb region to be putatively neutral.
Hi-C analyses
We obtained raw paired-end Hi-C libraries for two IMR90 fibroblast cell lines (Dixon et al. 2012). Although Hi-C data were also available from human embryonic stem cells, we chose not to include this cell type as it may have a more permissive chromatin landscape that is not representative of promoter/enhancer interactions (Dixon et al. 2012). We processed the Hi-C data for each cell line at 40-kb resolution as previously described (Ay et al. 2014). Briefly, we mapped reads to the hg19 (GRCh 37) reference sequence, pairing mapped read ends, filtering duplicates, binning at 40 kb resolution, normalizing raw contact maps (Imakaev et al. 2012), and assigning statistical confidences for each contact bin pair using Fit-Hi-C with a refined null (Ay et al. 2014). We used a significance threshold of q-value <0.01 to determine regions that are contacted by haDHSs containing 40-kb windows. We omitted contacts within the same window and between adjacent windows and only focused on intrachromosomal contacts within 5 Mb of haDHSs. Note that the binning at a coarse resolution and omission of interchromosomal contacts were done to identify only high-confidence contacts with enough sequencing coverage. We used RefSeq gene annotations to obtain a list of transcription start sites that overlap contact regions and used these to perform GO analyses using the WebGestalt server (Wang et al. 2013) with the multiple testing method set to BH and the minimum number of genes per category to 10.
Transgenic mouse assays
Transgenic mouse assays were performed as previously described (Visel et al. 2007). Note, one of the previously tested assays was performed with the mouse ortholog (see Supplemental Table 3). Images of all the mouse assay replicates are available on the VISTA Enhancer Browser (Visel et al. 2007).
Luciferase assays
We considered several factors when selecting which haDHSs to experimentally study. First, because the luciferase assays detect enhancers, we prioritized haDHSs showing evidence of enhancer activity. To this end, we identified a second set of haDHSs that were within 500 bp of an enhancer histone modification (H3K4me1, H3K27ac) signal identified in the same cell type. Histone modifications for this set of haDHSs were downloaded from the UCSC Genome Browser or the Roadmap Epigenomics website. We included only DHSs from the 20 cell types for which histone modification data were available (for additional set of haDHSs and the cell types used, see Supplemental Table 6). There is a column identifying which haDHSs were used in the luciferase assays in Supplemental Tables 2 and 6. Second, we prioritized haDHSs that were active in IMR90, SK-N-MC, or other similar cell types. Both cell types represent time points that are potentially interesting for studying human evolution: SK-N-MC is a brain cell type, and IMR90 is a fetal tissue. Finally, we prioritized haDHSs that showed the greatest evidence for human acceleration.
We used standard techniques for cloning, transfection, and performing luciferase assays. Details are provided in the Supplement. For the luciferase assays, each allele and control had three to eight replicates. The positive control for each plate was cells transfected with the pGL3 control plasmid containing a minimal promoter with strong SV40 enhancer, while the negative control for each plate was cells transfected with the empty pGL3 plasmid with minimal promoter but no additional sequence cloned in.
To increase power to detect enhancer activity, negative control replicates were normalized by plate so that they could be directly comparable and combined. To accomplish this, we used the lm() function in R (R Core Team 2014) to create a linear model where the ratio of firefly to Renilla for all negative control replicates was a function of plate number. Then the coefficient for each plate was subtracted from all data points for that plate. Enhancer activity was determined using a one-sided t-test, and haDHSs were considered enhancers if either the chimp and/or human allele showed greater luciferase activity than the negative controls. We then tested enhancers for allelic differences with a two-sided t-test between the human and chimp alleles.
Supplementary Material
Acknowledgments
This work was supported by the National Institute of General Medical Sciences (NIGMS) grant GM110068 to J.M.A. R.M.G. was supported by a National Science Foundation (NSF) graduate research fellowship. L.P. was supported by National Human Genome Research Institute (NHGRI) grants R01HG003988, and U54HG006997, and research was conducted at the E.O. Lawrence Berkeley National Laboratory and performed under Department of Energy Contract DE-AC02-05CH11231, University of California. W.S.N. was supported by National Institutes of Health (NIH) grant U41HG007000.
Footnotes
[Supplemental material is available for this article.]
Article published online before print. Article, supplemental material, and publication date are at http://www.genome.org/cgi/doi/10.1101/gr.192591.115.
References
- The 1000 Genomes Project Consortium. 2012. An integrated map of genetic variation from 1,092 human genomes. Nature 491: 56–65. [DOI] [PMC free article] [PubMed] [Google Scholar]
- Antinucci P, Nikolaou N, Meyer MP, Hindges R. 2013. Teneurin-3 specifies morphological and functional connectivity of retinal ganglion cells in the vertebrate visual system. Cell Rep 5: 582–592. [DOI] [PMC free article] [PubMed] [Google Scholar]
- Arbiza L, Dopazo J, Dopazo H. 2006. Positive selection, relaxation, and acceleration in the evolution of the human and chimp genome. PLoS Comput Biol 2: e38. [DOI] [PMC free article] [PubMed] [Google Scholar]
- Asthana S, Noble WS, Kryukov G, Grant CE, Sunyaev S, Stamatoyannopoulos JA. 2007. Widely distributed noncoding purifying selection in the human genome. Proc Natl Acad Sci 104: 12410–12415. [DOI] [PMC free article] [PubMed] [Google Scholar]
- Atchison ML. 2014. Function of YY1 in long-distance DNA interactions. Front Immunol 5: 45. [DOI] [PMC free article] [PubMed] [Google Scholar]
- Ay F, Bailey TL, Noble WS. 2014. Statistical confidence estimation for Hi-C data reveals regulatory chromatin contacts. Genome Res 24: 999–1011. [DOI] [PMC free article] [PubMed] [Google Scholar]
- Bernstein BE, Stamatoyannopoulos JA, Costello JF, Ren B, Milosavljevic A, Meissner A, Kellis M, Marra MA, Beaudet AL, Ecker JR, et al. 2010. The NIH roadmap epigenomics mapping consortium. Nat Biotechnol 28: 1045–1048. [DOI] [PMC free article] [PubMed] [Google Scholar]
- Britten RJ, Davidson EH. 1969. Gene regulation for higher cells: a theory. Science 165: 349–357. [DOI] [PubMed] [Google Scholar]
- Bush EC, Lahn BT. 2008. A genome-wide screen for noncoding elements important in primate evolution. BMC Evol Biol 8: 17. [DOI] [PMC free article] [PubMed] [Google Scholar]
- Capra JA, Erwin GD, McKinsey G, Rubenstein JLR, Pollard KS. 2013. Many human accelerated regions are developmental enhancers. Philos Trans R Soc Lond B Biol Sci 368: 20130025. [DOI] [PMC free article] [PubMed] [Google Scholar]
- Charlesworth B. 1994. The effect of background selection against deleterious mutations on weakly selected, linked variants. Genet Res 63: 213–227. [DOI] [PubMed] [Google Scholar]
- Chimpanzee Sequencing and Analysis Consortium. 2005. Initial sequence of the chimpanzee genome and comparison with the human genome. Nature 437: 69–87. [DOI] [PubMed] [Google Scholar]
- Chinwalla AT, Cook LL, Delehaunty KD, Fewell GA, Fulton LA, Fulton RS, Graves TA, Hillier LW, Mardis ER, McPherson JD, et al. 2002. Initial sequencing and comparative analysis of the mouse genome. Nature 420: 520–562. [DOI] [PubMed] [Google Scholar]
- Clark AG, Glanowski S, Nielsen R, Thomas PD, Kejariwal A, Todd MA, Tanenbaum DM, Civello D, Lu F, Murphy B, et al. 2003. Inferring nonneutral evolution from human-chimp-mouse orthologous gene trios. Science 302: 1960–1963. [DOI] [PubMed] [Google Scholar]
- Cotney J, Leng J, Yin J, Reilly SK, DeMare LE, Emera D, Ayoub AE, Rakic P, Noonan JP. 2013. The evolution of lineage-specific regulatory activities in the human embryonic limb. Cell 154: 185–196. [DOI] [PMC free article] [PubMed] [Google Scholar]
- Dennis MY, Nuttle X, Sudmant PH, Antonacci F, Graves TA, Nefedov M, Rosenfeld JA, Sajjadian S, Malig M, Kotkiewicz H, et al. 2012. Evolution of human-specific neural SRGAP2 genes by incomplete segmental duplication. Cell 149: 912–922. [DOI] [PMC free article] [PubMed] [Google Scholar]
- Dermitzakis ET, Clark AG. 2002. Evolution of transcription factor binding sites in mammalian gene regulatory regions: conservation and turnover. Mol Biol Evol 19: 1114–1121. [DOI] [PubMed] [Google Scholar]
- Dixon JR, Selvaraj S, Yue F, Kim A, Li Y, Shen Y, Hu M, Liu JS, Ren B. 2012. Topological domains in mammalian genomes identified by analysis of chromatin interactions. Nature 485: 376–380. [DOI] [PMC free article] [PubMed] [Google Scholar]
- Doolittle WF. 2013. Is junk DNA bunk? A critique of ENCODE. Proc Natl Acad Sci 110: 5294–5300. [DOI] [PMC free article] [PubMed] [Google Scholar]
- Dorschner MO, Hawrylycz M, Humbert R, Wallace JC, Shafer A, Kawamoto J, Mack J, Hall R, Goldy J, Sabo PJ, et al. 2004. High-throughput localization of functional elements by quantitative chromatin profiling. Nat Methods 1: 219–225. [DOI] [PubMed] [Google Scholar]
- Duret L, Galtier N. 2009. Comment on “Human-specific gain of function in a developmental enhancer”. Science 323: 714. [DOI] [PubMed] [Google Scholar]
- Eddy SR. 2012. The C-value paradox, junk DNA and ENCODE. Curr Biol 22: R898–R899. [DOI] [PubMed] [Google Scholar]
- Enard W, Przeworski M, Fisher SE, Lai CSL, Wiebe V, Kitano T, Monaco AP, Pääbo S. 2002. Molecular evolution of FOXP2, a gene involved in speech and language. Nature 418: 869–872. [DOI] [PubMed] [Google Scholar]
- The ENCODE Project Consortium. 2012. An integrated encyclopedia of DNA elements in the human genome. Nature 489: 57–74. [DOI] [PMC free article] [PubMed] [Google Scholar]
- Flicek P, Amode MR, Barrell D, Beal K, Billis K, Brent S, Carvalho-Silva D, Clapham P, Coates G, Fitzgerald S, et al. 2014. Ensembl 2014. Nucleic Acids Res 42: D749–D755. [DOI] [PMC free article] [PubMed] [Google Scholar]
- Galas D, Schmitz A. 1978. DNAse footprinting: a simple method for the detection of protein-DNA binding specificity. Nucleic Acids Res 5: 3157–3170. [DOI] [PMC free article] [PubMed] [Google Scholar]
- Galtier N, Duret L. 2007. Adaptation or biased gene conversion? Extending the null hypothesis of molecular evolution. Trends Genet 23: 273–277. [DOI] [PubMed] [Google Scholar]
- Graham A. 2003. Development of the pharyngeal arches. Am J Med Genet A 119A: 251–256. [DOI] [PubMed] [Google Scholar]
- Grant CE, Bailey TL, Noble WS. 2011. FIMO: scanning for occurrences of a given motif. Bioinformatics 27: 1017–1018. [DOI] [PMC free article] [PubMed] [Google Scholar]
- Graur D, Zheng Y, Price N, Azevedo RBR, Zufall RA, Elhaik E. 2013. On the immortality of television sets: “function” in the human genome according to the evolution-free gospel of ENCODE. Genome Biol Evol 5: 578–590. [DOI] [PMC free article] [PubMed] [Google Scholar]
- Green RE, Krause J, Briggs AW, Maricic T, Stenzel U, Kircher M, Patterson N, Li H, Zhai W, Fritz MH-Y, et al. 2010. A draft sequence of the Neandertal genome. Science 328: 710–722. [DOI] [PMC free article] [PubMed] [Google Scholar]
- Haygood R, Fedrigo O, Hanson B, Yokoyama K-D, Wray GA. 2007. Promoter regions of many neural- and nutrition-related genes have experienced positive selection during human evolution. Nat Genet 39: 1140–1144. [DOI] [PubMed] [Google Scholar]
- Hubisz MJ, Pollard KS, Siepel A. 2011. PHAST and RPHAST: phylogenetic analysis with space/time models. Brief Bioinform 12: 41–51. [DOI] [PMC free article] [PubMed] [Google Scholar]
- Imakaev M, Fudenberg G, McCord RP, Naumova N, Goloborodko A, Lajoie BR, Dekker J, Mirny LA. 2012. Iterative correction of Hi-C data reveals hallmarks of chromosome organization. Nat Methods 9: 999–1003. [DOI] [PMC free article] [PubMed] [Google Scholar]
- Jiao Y, Shi C, Edil BH, de Wilde RF, Klimstra DS, Maitra A, Schulick RD, Tang LH, Wolfgang CL, Choti MA, et al. 2011. DAXX/ATRX, MEN1, and mTOR pathway genes are frequently altered in pancreatic neuroendocrine tumors. Science 331: 1199–1203. [DOI] [PMC free article] [PubMed] [Google Scholar]
- John S, Sabo PJ, Thurman RE, Sung M-H, Biddie SC, Johnson TA, Hager GL, Stamatoyannopoulos JA. 2011. Chromatin accessibility pre-determines glucocorticoid receptor binding patterns. Nat Genet 43: 264–268. [DOI] [PMC free article] [PubMed] [Google Scholar]
- Kamm GB, Pisciottano F, Kliger R, Franchini LF. 2013. The developmental brain gene NPAS3 contains the largest number of accelerated regulatory sequences in the human genome. Mol Biol Evol 30: 1088–1102. [DOI] [PMC free article] [PubMed] [Google Scholar]
- Kim SY, Pritchard JK. 2007. Adaptive evolution of conserved noncoding elements in mammals. PLoS Genet 3: 1572–1586. [DOI] [PMC free article] [PubMed] [Google Scholar]
- King MC, Wilson AC. 1975. Evolution at two levels in humans and chimpanzees. Science 188: 107–116. [DOI] [PubMed] [Google Scholar]
- Kostka D, Hubisz MJ, Siepel A, Pollard KS. 2012. The role of GC-biased gene conversion in shaping the fastest evolving regions of the human genome. Mol Biol Evol 29: 1047–1057. [DOI] [PMC free article] [PubMed] [Google Scholar]
- Lefebvre V, Li P, de Crombrugghe B. 1998. A new long form of Sox5 (L-Sox5), Sox6 and Sox9 are coexpressed in chondrogenesis and cooperatively activate the type II collagen gene. EMBO J 17: 5718–5733. [DOI] [PMC free article] [PubMed] [Google Scholar]
- Lieberman-Aiden E, van Berkum NL, Williams L, Imakaev M, Ragoczy T, Telling A, Amit I, Lajoie BR, Sabo PJ, Dorschner MO, et al. 2009. Comprehensive mapping of long-range interactions reveals folding principles of the human genome. Science 326: 289–293. [DOI] [PMC free article] [PubMed] [Google Scholar]
- Lindblad-Toh KK, Garber MM, Zuk OO, Lin MFM, Parker BJB, Washietl SS, Kheradpour PP, Ernst JJ, Jordan GG, Mauceli EE, et al. 2011. A high-resolution map of human evolutionary constraint using 29 mammals. Nature 478: 476–482. [DOI] [PMC free article] [PubMed] [Google Scholar]
- Lowe CB, Kellis M, Siepel A, Raney BJ, Clamp M, Salama SR, Kingsley DM, Lindblad-Toh K, Haussler D. 2011. Three periods of regulatory innovation during vertebrate evolution. Science 333: 1019–1024. [DOI] [PMC free article] [PubMed] [Google Scholar]
- Lunter G, Ponting CP, Hein J. 2006. Genome-wide identification of human functional DNA using a neutral indel model. PLoS Comput Biol 2: e5. [DOI] [PMC free article] [PubMed] [Google Scholar]
- Maricic T, Günther V, Georgiev O, Gehre S, Curlin M, Schreiweis C, Naumann R, Burbano HA, Meyer M, Lalueza-Fox C, et al. 2013. A recent evolutionary change affects a regulatory element in the human FOXP2 gene. Mol Biol Evol 30: 844–852. [DOI] [PubMed] [Google Scholar]
- Maurano MT, Humbert R, Rynes E, Thurman RE, Haugen E, Wang H, Reynolds AP, Sandstrom R, Qu H, Brody J, et al. 2012. Systematic localization of common disease-associated variation in regulatory DNA. Science 337: 1190–1195. [DOI] [PMC free article] [PubMed] [Google Scholar]
- McLean CY, Bristor D, Hiller M, Clarke SL, Schaar BT, Lowe CB, Wenger AM, Bejerano G. 2010. GREAT improves functional interpretation of cis-regulatory regions. Nat Biotechnol 28: 495–501. [DOI] [PMC free article] [PubMed] [Google Scholar]
- McLean CY, Reno PL, Pollen AA, Bassan AI, Capellini TD, Guenther C, Indjeian VB, Lim X, Menke DB, Schaar BT, et al. 2011. Human-specific loss of regulatory DNA and the evolution of human-specific traits. Nature 471: 216–219. [DOI] [PMC free article] [PubMed] [Google Scholar]
- Meader S, Ponting CP, Lunter G. 2010. Massive turnover of functional sequence in human and other mammalian genomes. Genome Res 20: 1335–1343. [DOI] [PMC free article] [PubMed] [Google Scholar]
- Merlin S, Horng S, Marotte LR, Sur M, Sawatari A, Leamey CA. 2013. Deletion of Ten-m3 induces the formation of eye dominance domains in mouse visual cortex. Cereb Cortex 23: 763–774. [DOI] [PMC free article] [PubMed] [Google Scholar]
- Morin RD, Johnson NA, Severson TM, Mungall AJ, An J, Goya R, Paul JE, Boyle M, Woolcock BW, Kuchenbauer F, et al. 2010. Somatic mutations altering EZH2 (Tyr641) in follicular and diffuse large B-cell lymphomas of germinal-center origin. Nat Genet 42: 181–185. [DOI] [PMC free article] [PubMed] [Google Scholar]
- Neph S, Kuehn MS, Reynolds AP, Haugen E, Thurman RE, Johnson AK, Rynes E, Maurano MT, Vierstra J, Thomas S, et al. 2012. BEDOPS: high-performance genomic feature operations. Bioinformatics 28: 1919–1920. [DOI] [PMC free article] [PubMed] [Google Scholar]
- Nielsen R, Bustamante C, Clark AG, Glanowski S, Sackton TB, Hubisz MJ, Fledel-Alon A, Tanenbaum DM, Civello D, White TJ, et al. 2005. A scan for positively selected genes in the genomes of humans and chimpanzees. PLoS Biol 3: e170. [DOI] [PMC free article] [PubMed] [Google Scholar]
- Niu D-K, Jiang L. 2013. Can ENCODE tell us how much junk DNA we carry in our genome? Biochem Biophys Res Commun 430: 1340–1343. [DOI] [PubMed] [Google Scholar]
- O'Bleness M, Searles VB, Varki A, Gagneux P, Sikela JM. 2012. Evolution of genetic and genomic features unique to the human lineage. Nat Rev Genet 13: 853–866. [DOI] [PMC free article] [PubMed] [Google Scholar]
- Paten B, Herrero J, Beal K, Fitzgerald S. 2008. Enredo and Pecan: genome-wide mammalian consistency-based multiple alignment with paralogs. Genome Res 18: 1814–1828. [DOI] [PMC free article] [PubMed] [Google Scholar]
- Pertea M, Pertea GM, Salzberg SL. 2011. Detection of lineage-specific evolutionary changes among primate species. BMC Bioinformatics 12: 274. [DOI] [PMC free article] [PubMed] [Google Scholar]
- Pollard KS, Salama SR, King B, Kern AD, Dreszer T, Katzman S, Siepel A, Pedersen JS, Bejerano G, Baertsch R, et al. 2006a. Forces shaping the fastest evolving regions in the human genome. PLoS Genet 2: e168. [DOI] [PMC free article] [PubMed] [Google Scholar]
- Pollard KS, Salama SR, Lambert N, Lambot M-A, Coppens S, Pedersen JS, Katzman S, King B, Onodera C, Siepel A, et al. 2006b. An RNA gene expressed during cortical development evolved rapidly in humans. Nature 443: 167–172. [DOI] [PubMed] [Google Scholar]
- Pollard KS, Hubisz MJ, Rosenbloom KR, Siepel A. 2010. Detection of nonneutral substitution rates on mammalian phylogenies. Genome Res 20: 110–121. [DOI] [PMC free article] [PubMed] [Google Scholar]
- Ponting CP, Hardison RC. 2011. What fraction of the human genome is functional? Genome Res 21: 1769–1776. [DOI] [PMC free article] [PubMed] [Google Scholar]
- Prabhakar S, Noonan JP, Paabo S, Rubin EM. 2006. Accelerated evolution of conserved noncoding sequences in humans. Science 314: 786. [DOI] [PubMed] [Google Scholar]
- Prabhakar S, Visel A, Akiyama JA, Shoukry M, Lewis KD, Holt A, Plajzer-Frick I, Morrison H, Fitzpatrick DR, Afzal V, et al. 2008. Human-specific gain of function in a developmental enhancer. Science 321: 1346–1350. [DOI] [PMC free article] [PubMed] [Google Scholar]
- R Core Team. 2014. R: a language and environment for statistical computing. R Foundation for Statistical Computing, Vienna, Austria: http://www.R-project.org/. [Google Scholar]
- Reilly SK, Yin J, Ayoub AE, Emera D, Leng J, Cotney J, Sarro R, Rakic P, Noonan JP. 2015. Evolutionary genomics: evolutionary changes in promoter and enhancer activity during human corticogenesis. Science 347: 1155–1159. [DOI] [PMC free article] [PubMed] [Google Scholar]
- Sanyal A, Lajoie BR, Jain G, Dekker J. 2012. The long-range interaction landscape of gene promoters. Nature 489: 109–113. [DOI] [PMC free article] [PubMed] [Google Scholar]
- Shibata Y, Sheffield NC, Fedrigo O, Babbitt CC, Wortham M, Tewari AK, London D, Song L, Lee B-K, Iyer VR, et al. 2012. Extensive evolutionary changes in regulatory element activity during human origins are associated with altered gene expression and positive selection. PLoS Genet 8: e1002789. [DOI] [PMC free article] [PubMed] [Google Scholar]
- Soranzo N, Spector TD, Mangino M, Kühnel B, Rendon A, Teumer A, Willenborg C, Wright B, Chen L, Li M, et al. 2009. A genome-wide meta-analysis identifies 22 loci associated with eight hematological parameters in the HaemGen consortium. Nat Genet 41: 1182–1190. [DOI] [PMC free article] [PubMed] [Google Scholar]
- Stedman HH, Kozyak BW, Nelson A, Thesier DM, Su LT, Low DW, Bridges CR, Shrager JB, Minugh-Purvis N, Mitchell MA. 2004. Myosin gene mutation correlates with anatomical changes in the human lineage. Nature 428: 415–418. [DOI] [PubMed] [Google Scholar]
- Steinberg SJ, Dodt G, Raymond GV, Braverman NE, Moser AB, Moser HW. 2006. Peroxisome biogenesis disorders. Biochim Biophys Acta 1763: 1733–1748. [DOI] [PubMed] [Google Scholar]
- Sudmant PH, Huddleston J, Catacchio CR, Malig M, Hillier LW, Baker C, Mohajeri K, Kondova I, Bontrop RE, Persengiev S, et al. 2013. Evolution and diversity of copy number variation in the great ape lineage. Genome Res 23: 1373–1382. [DOI] [PMC free article] [PubMed] [Google Scholar]
- Taylor MS, Massingham T, Hayashizaki Y, Carninci P, Goldman N, Semple CAM. 2008. Rapidly evolving human promoter regions. Nat Genet 40: 1262–1263. [DOI] [PubMed] [Google Scholar]
- van Arensbergen J, van Steensel B, Bussemaker HJ. 2014. In search of the determinants of enhancer–promoter interaction specificity. Trends Cell Biol 24: 695–702. [DOI] [PMC free article] [PubMed] [Google Scholar]
- Vernot B, Stergachis AB, Maurano MT, Vierstra J, Neph S, Thurman RE, Stamatoyannopoulos JA, Akey JM. 2012. Personal and population genomics of human regulatory variation. Genome Res 22: 1689–1697. [DOI] [PMC free article] [PubMed] [Google Scholar]
- Villar D, Flicek P, Odom DT. 2014. Evolution of transcription factor binding in metazoans—mechanisms and functional implications. Nat Rev Genet 15: 221–233. [DOI] [PMC free article] [PubMed] [Google Scholar]
- Visel A, Minovitsky S, Dubchak I, Pennacchio LA. 2007. VISTA Enhancer Browser—a database of tissue-specific human enhancers. Nucleic Acids Res 35: D88–D92. [DOI] [PMC free article] [PubMed] [Google Scholar]
- Wang J, Duncan D, Shi Z, Zhang B. 2013. WEB-based GEne SeT AnaLysis Toolkit (WebGestalt): update 2013. Nucleic Acids Res 41: W77–W83. [DOI] [PMC free article] [PubMed] [Google Scholar]
- Wray GA, Hahn MW, Abouheif E, Balhoff JP, Pizer M, Rockman MV, Romano LA. 2003. The evolution of transcriptional regulation in eukaryotes. Mol Biol Evol 20: 1377–1419. [DOI] [PubMed] [Google Scholar]
Associated Data
This section collects any data citations, data availability statements, or supplementary materials included in this article.