Summary
Mitochondria are involved in a variety of cellular functions including ATP production, amino acid and lipid biogenesis and breakdown, signaling and apoptosis1-3. Mitochondrial dysfunction has been linked to neurodegenerative diseases, cancer, and aging4. Although transcriptional mechanisms regulating mitochondrial abundance are known5, comparatively little is known about how mitochondrial function is regulated. We identify here the metabolite stearic acid (C18:0) and Transferrin Receptor (TfR1) as mitochondrial regulators. We elucidate a signaling pathway whereby C18:0 stearoylates TfR1, thereby inhibiting its activation of JNK signaling. This leads to reduced ubiquitination of mitofusin via HUWE1, thereby promoting mitochondrial fusion and function. We find that animal cells are poised to respond to both increases and decreases in C18:0 levels, with increased C18:0 dietary intake boosting mitochondrial fusion in vivo. Intriguingly, dietary C18:0 supplementation can counteract the mitochondrial dysfunction caused by genetic defects such as loss of the Parkinsons genes Pink or Parkin. This work identifies the metabolite C18:0 as a signaling molecule regulating mitochondrial function in response to diet.
Keywords: Drosophila, metabolism, mitochondria, mitofusin, Pink, Parkin, Parkinsons
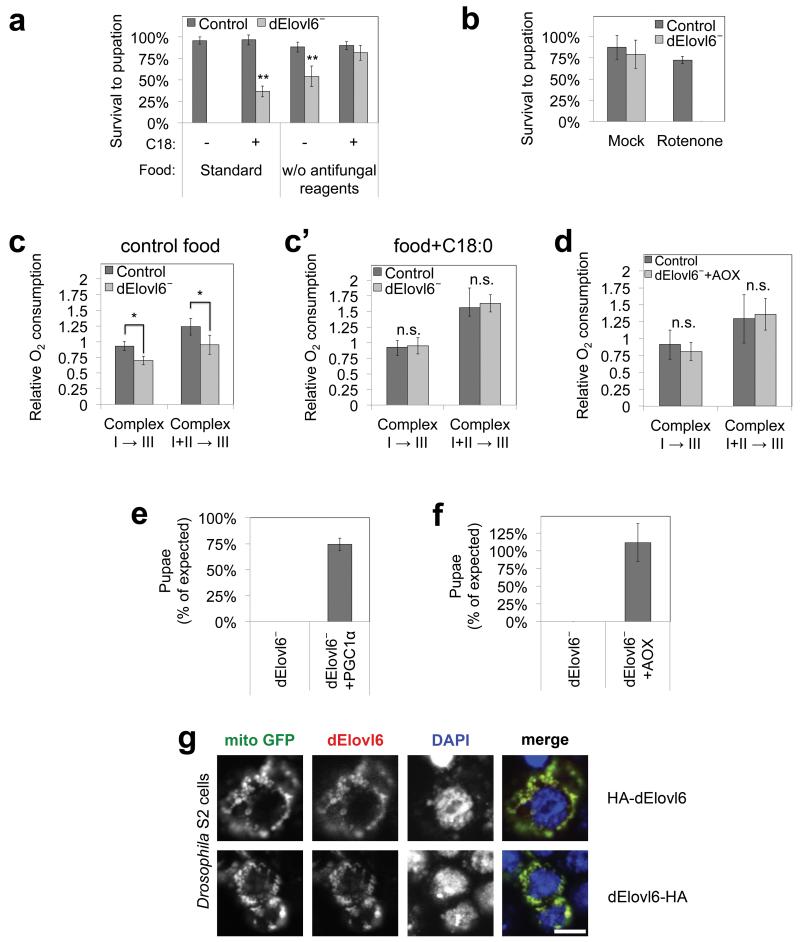
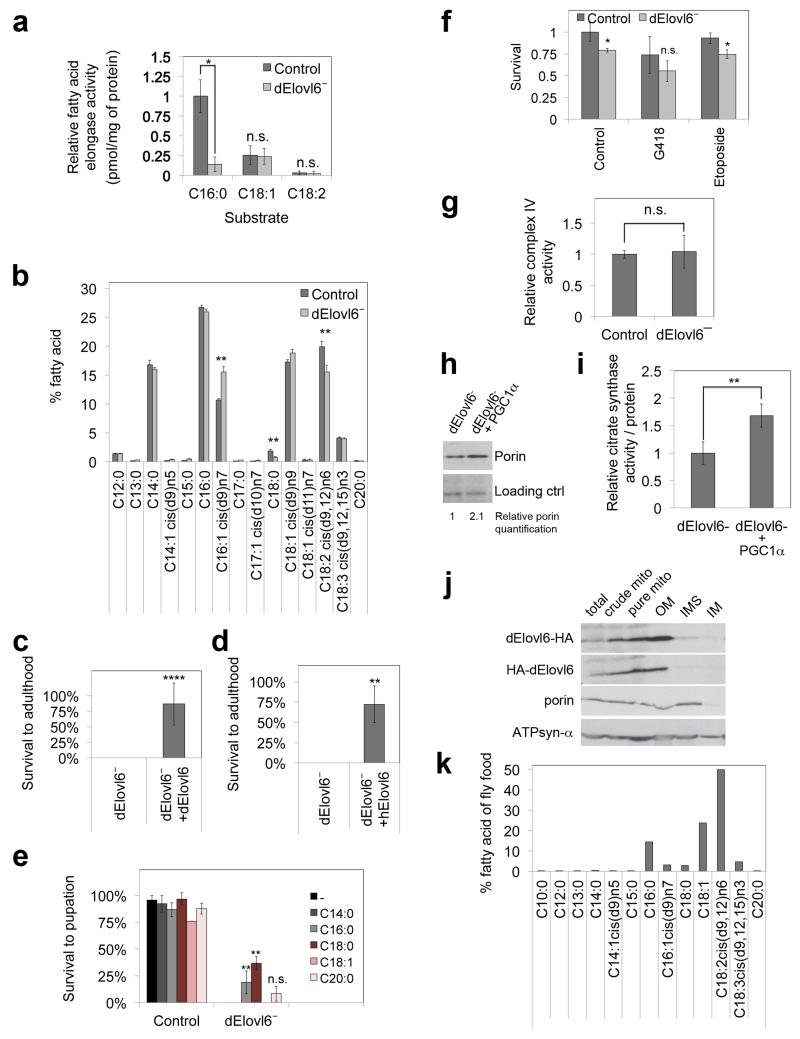
To study the function of very long chain fatty acids, we analyzed Drosophila lacking Elovl66,7, the enzyme elongating C16 fatty acids to C18. Sequence analysis identified noa8 as fly Elovl6 (“dElovl6”). On standard laboratory food, dElovl6 loss-of-function animals (l(3)02281−/−, “dElovl6−”) die as early larvae8 (Fig. 1a). We confirmed dElovl6− mutants have impaired C16:0⦿C18:0 elongase activity and reduced C18:0 levels (Extended Data Fig. 1a-b), and their lethality is rescued by human Elovl6 (ED Fig. 1c-d). Survival to pupation was rescued by supplementing fly food (containing little lipid), with C18:0 (Fig. 1a), but not C18:1 or C20:0 (ED Fig. 1e), confirming the larval lethality is due to C18:0 deficit.
Figure 1. Animals lacking C18:0 have impaired mitochondrial function.
(a) dElovl6 mutant larval lethality rescued by dietary C18:0 (10% in food) or by removal of mitotoxic antifungal reagents (n=4 × 60 animals/vial).
(b) dElovl6 mutants are sensitive to sub-lethal concentrations (100μM) of rotenone (n=4 × 30 animals/vial).
(c-d) dElovl6 mutants have impaired respiration (c), rescued by supplementing food with C18:0 (10%) (c’), or by expressing Ciona intestinalis alternative oxidase (AOX) (d), allowing bypass of Complexes III+IV. n=4 × 6 animals.
(e-f) Survival to pupation of Elovl6 mutants is rescued by ubiquitous expression of PGC1α (Drosophila Spargel) (e) or AOX (f). χ2 tests p=0.05. n=195(e) or 81(f).
(g) N or C terminus tagged dElovl6 localizes to mitochondria, visualized with mitoGFP in S2 cells. Scale bar 10μm (n=4).
Details in Supplementary Information.
(a, b, c, c’, d, e, f) Error bars: std. dev. (a, b, c, c’, d) **p<0.01, *p<0.05, n.s. p>0.05 for two tailed t-test.
We serendipitously discovered that removing antifungal agents from fly food improved Elovl6− survival (Fig. 1a). Since these agents are mitotoxins, this suggested Elovl6− mutants might be hypersensitive to mitochondrial inhibition. Indeed, sub-lethal concentrations of Rotenone, a Complex I inhibitor, killed Elovl6− mutants when added to antifungal-free food (Fig. 1b), but other drugs did not (ED Fig. 1f). Thus mitochondrial function is limiting in Elovl6− mutants. Elovl6− mutants have impaired mitochondrial respiration, rescued by dietary C18:0 supplementation (Fig. 1c-c’) or by expressing an alternative oxidase AOX9 allowing bypass of Complexes III+IV (Fig. 1d). Complex IV activity was not impaired in Elovl6− mutants (ED Fig. 1g), suggesting Elovl6− mutants suffer from a Complex III defect.
If the main cause of Elovl6− lethality is reduced mitochondrial function, then viability should be rescued by restoring mitochondrial functional capacity. Indeed, Elovl6− viability was rescued by expressing AOX or PGC1a, driving mitochondrial biogenesis (Fig. 1e-f and ED Fig. 1h-i). Thus the organismal function of C18:0 is less pleiotropic than expected. Interestingly, Drosophila Elovl6 localizes to mitochondrial outer membranes (Fig. 1g, ED Fig. 1j).
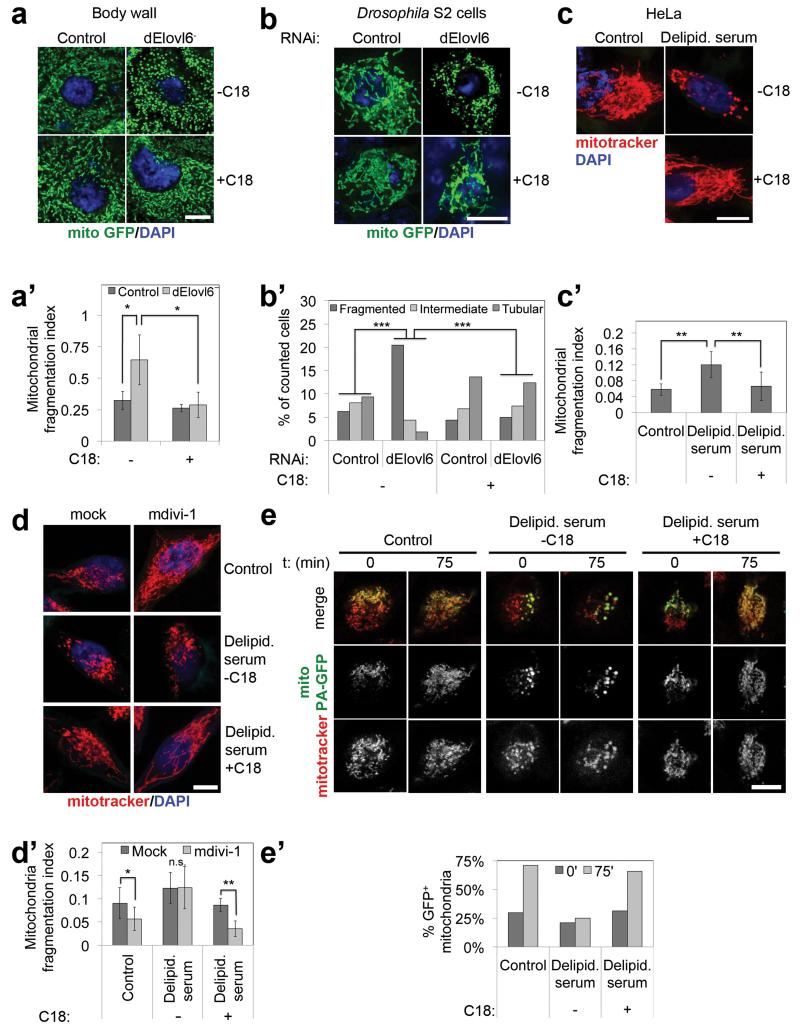
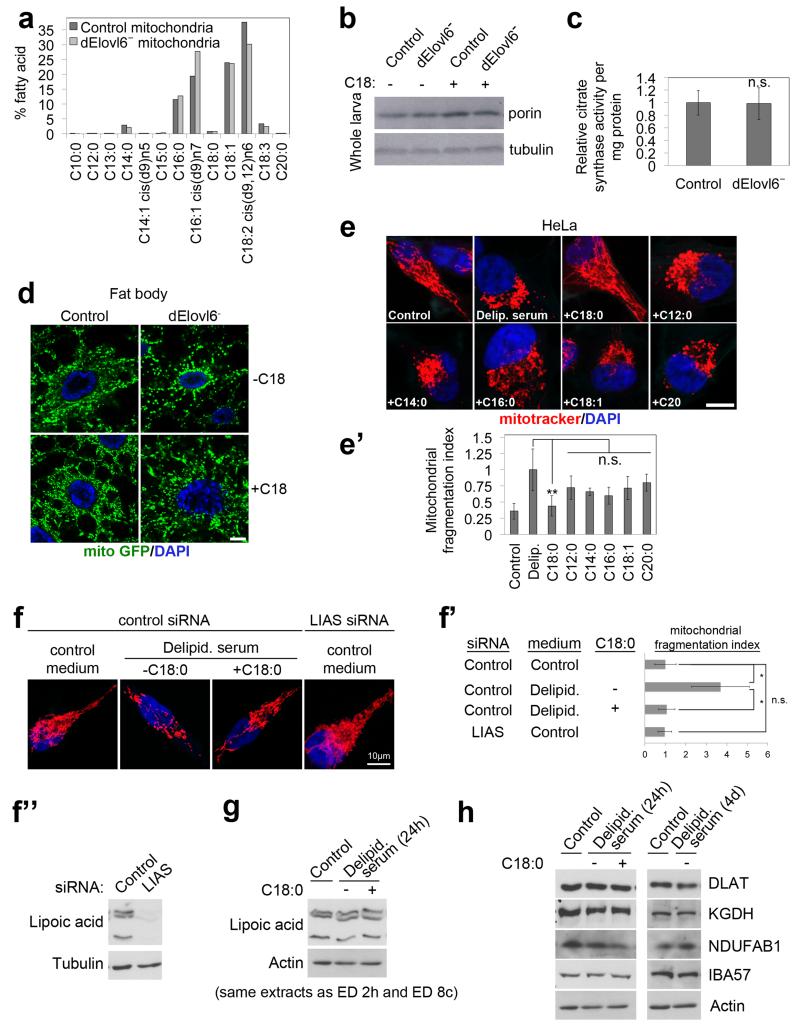
Lipidomic analysis of purified mitochondria (ED Fig. 5b) revealed their membranes have little C18:0 (ED Fig. 2a), suggesting C18:0 does not play a structural role in mitochondria. Elovl6− mutants also did not have fewer mitochondria than controls (assayed by porin levels and citrate synthase activity, ED Figs. 2b-c). We therefore investigated if C18:0 regulates mitochondrial activity. Mitochondria dynamically fuse and fission to form tubular structures10,11. Elovl6− mutants had hyper-fragmented mitochondria, rescued by dietary C18:0 supplementation (Fig. 2a-a’, ED Fig. 2d). dElovl6 knockdown in S2 cells reproduced this phenotype (Fig. 2b-b’), indicating it is cell autonomous. Importantly, we grow S2 cells in Serum Free Medium, which lacks fatty acids normally bound to serum BSA. Mitochondria of dElovl6 knockdown cells rapidly re-fused upon addition of BSA-conjugated C18:0 to the medium for just 120 (Fig. 2b-b’) or 20 minutes (not shown). Mitochondria of HeLa cells also fragmented when grown in medium with serum that was delipidated by organic extraction (Fig. 2c-c’). This was rescued by re-adding BSA-conjugated C18:0 for 2 hours (Fig. 2c-c’), but not other fatty acids (ED Fig. 2e-e’). One lipid specific to mitochondria is lipoic acid (LA). Knockdown of LA Synthase, led to reduced LA levels but not mitochondrial fragmentation (ED Fig. 2f-f”), and depletion of C18:0 did not affect levels of LA or lipoylated proteins (ED Figs. 2g-h) indicating the effects of C18:0 are independent of LA. Thus C18:0 regulates mitochondrial morphology in fly and human cells.
Figure 2. C18:0 is required for mitochondrial fusion.
(a-a’) dElovl6 mutants have fragmented mitochondria (a), rescued by dietary C18:0 (10% in food). Fragmentation quantified (8 fields from 4 animals) (a’).
(b-b’) dElovl6 knockdown in Drosophila cells causes mitochondrial fragmentation, reversed by supplementing medium with 100μM C18:0 for 120 min. (b) and quantified (b’). n=50. ***p<0.001 Mann-Whitney test.
(c-c’) C18:0 removal by de-lipidating serum causes mitochondrial fragmentation in human cells, rescued by resupplementing with 100μM C18:0 2 hrs (c), quantified in (c’). (n=15)
(d-e’) (d-d’) C18:0 affects mitochondrial fusion, not fission. Pharmacological inhibition of mitochondrial fission with mdivi-1 does not cause mitochondrial network fusion in cells growing without C18:0 (d), quantified in (d’). (n=15) (e-e’) Direct observation of mitochondrial fusion, monitored as dispersion of locally photoactivated mitoGFP (green) into the rest of the mitochondrial network (mitotracker, red), quantified in (e’) (representative of 10).
Details in Supplementary Information.
(a’, b’, c’, d’) Error bars: s.d. (a’, c’, d’) *p<0.05, **p<0.01, n.s. p≥0.05 two tailed t-test. Scale bars: 20μm in (a), 10μm in all other panels.
Mitochondrial fragmentation is due to either hyperactive fission or impaired fusion. Blocking fission with mdivi-1, a Drp1 inhibitor12, induced mitochondrial fusion in control cells, but not in HeLas cultured without C18:0 (Fig. 2d-d’), indicating impaired mitochondrial fusion in this condition. Mitochondria labeled with photoactivatable mitoGFP13 (green) rapidly fused with the rest of the network (mitotracker red) in control cells, but not in cells cultured without C18:0, demonstrating impaired fusion (Fig. 2e-e’).
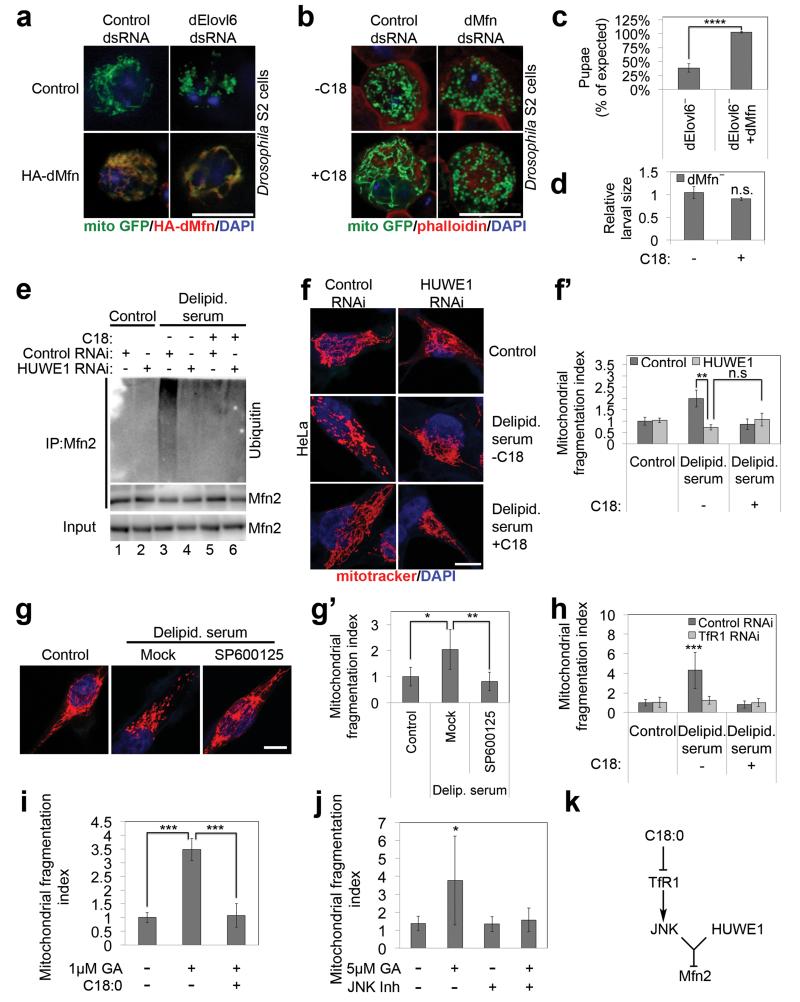
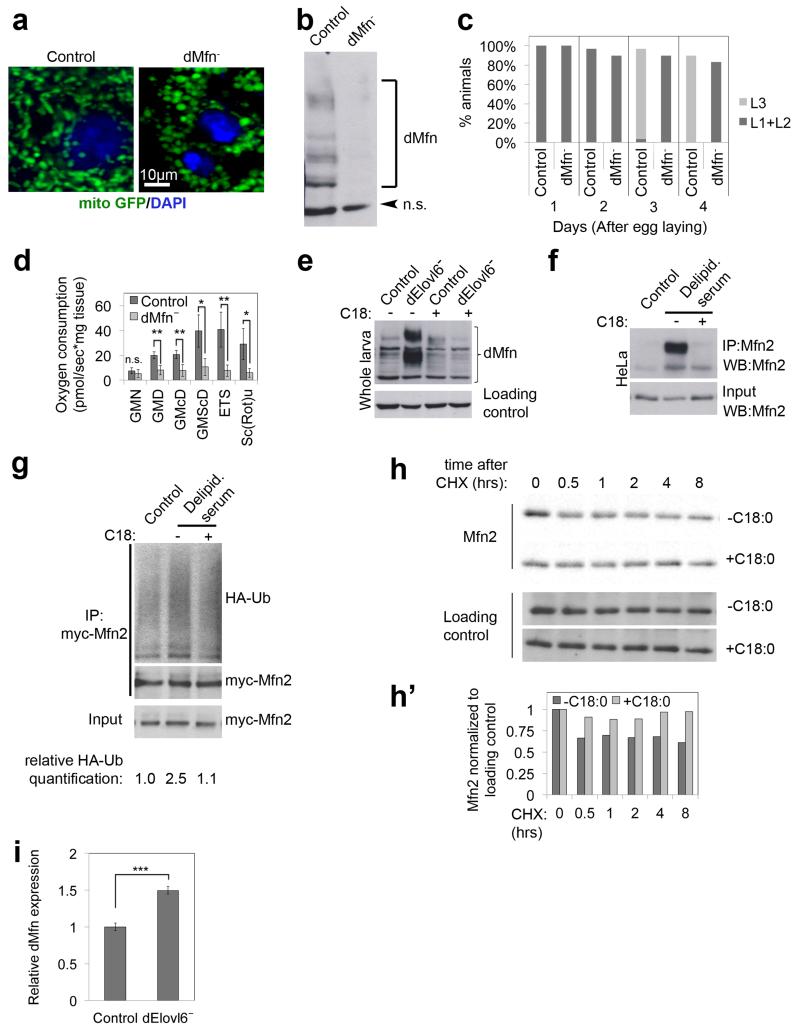
Mitochondrial fusion is regulated largely via mitofusins (Mfn)14,15. Epistasis experiments indicated C18:0 acts upstream of mitofusin to regulate mitochondrial morphology: Expression of dMfn/Marf rescued mitochondrial fragmentation in dElovl6 knockdown cells (Fig. 3a), indicating dMfn acts downstream of C18:0. C18:0 did not induce fusion in the absence of dMfn (Fig. 3b), indicating C18:0 requires dMfn for its action. Likewise, expression of dMfn rescued dElovl6− larval lethality (Fig. 3c). To test if C18:0 can rescue dMfn loss-of-function we generated dMfn knockout flies. These flies phenocopy Elovl6− mutants: they have fragmented mitochondria, reduced mitochondrial respiration, and die as early-stage larvae that do not grow (ED Fig. 3a-d). Dietary supplementation with C18:0 had no effect on growth or viability of dMfn knockouts (Fig. 3d).
Figure 3. C18:0 acts via TfR1, JNK and HUWE1 to regulate mitofusin.
(a-b) C18:0 acts upstream of mitofusin to regulate mitochondrial morphology in S2 cells. Mitochondrial fragmentation induced by dElovl6 knockdown is reversed by Mitofusin (Mfn) gain-of-function (a), whereas C18:0 (100μM, 2h) cannot induce mitochondrial fusion in the absence of dMfn (b) (n=5).
(c-d) C18:0 acts upstream of mitofusin to regulate animal growth and survival. Ubiquitous expression of dMfn rescues lethality of dElovl6 mutants until pupation (c) (χ2 test p=0.05, n=685, ****p<0.0001) whereas C18:0 supplementation cannot rescue growth of dMfn mutant animals (d) (n=6, n.s. p≥0.05).
(e-f) Ubiquitination of endogenous Mfn2 (e) and fragmentation of mitochondria (f-f’) (n=15) in response to C18:0 removal requires the Mfn2 ubiquitin ligase HUWE1.
(g-g’) Pharmacological inhibition of JNK signaling (SP600125, 10μM) blunts mitochondrial fragmentation induced upon C18:0 removal (24h delipidated serum). Representative images (g), quantification (g’). (n=15)
(h) TfR1 is required for delipidated serum to induce mitochondrial fragmentation. Quantification here; representative images in ED Fig. 7d. (n=15)
(i) Activation of TfR1 with 1μM Gambogic Acid (GA) leads to mitochondrial fragmentation which is inhibited by 1 hour C18:0 pretreatment. Quantification here; representative images in ED Fig. 9b. (n=15)
(j) JNK signaling is required to induce mitochondrial fragmentation in response to TfR1 activation with GA. HeLa cells treated with 10μM SP600125 prior to GA (2h 1μM). Quantification here; representative images in ED Fig. 9e (n=5).
(k) Schematic diagram of the signaling route by which C18:0 regulates mitochondrial fusion.
All scale bars: 10μm. (c, d, f’, g’, h, i, j) Error bars: s.d. (f’, g’, h, i, j) *p<0.05, **p<0.01, ***p<0.001, n.s. p≥0.05 for two tailed t-test.
Details in Supplementary Information.
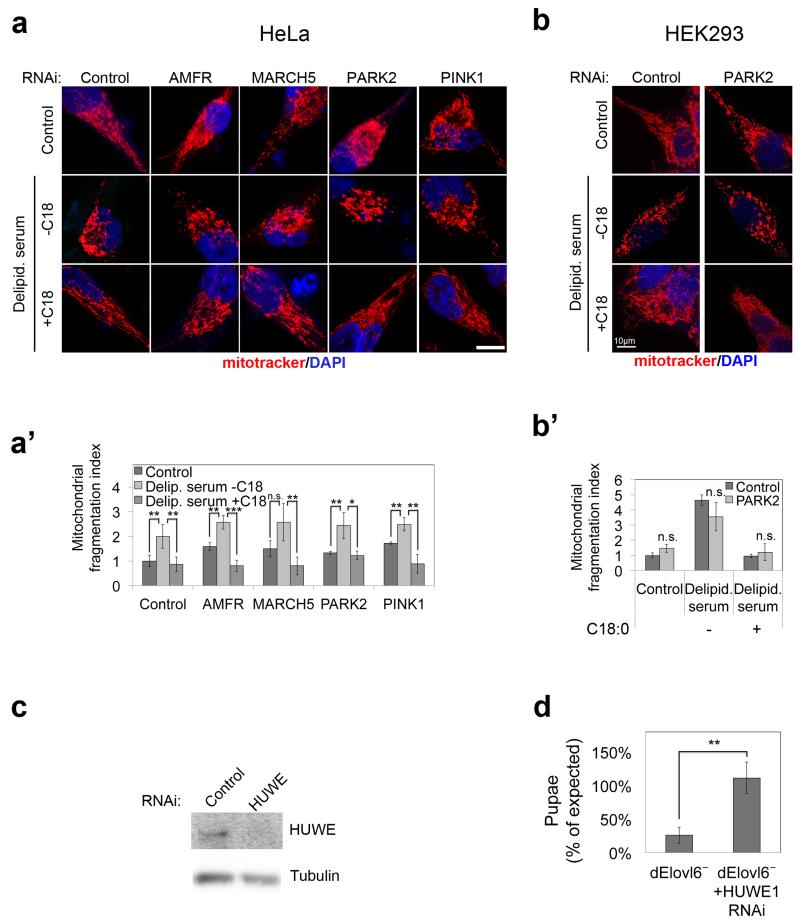
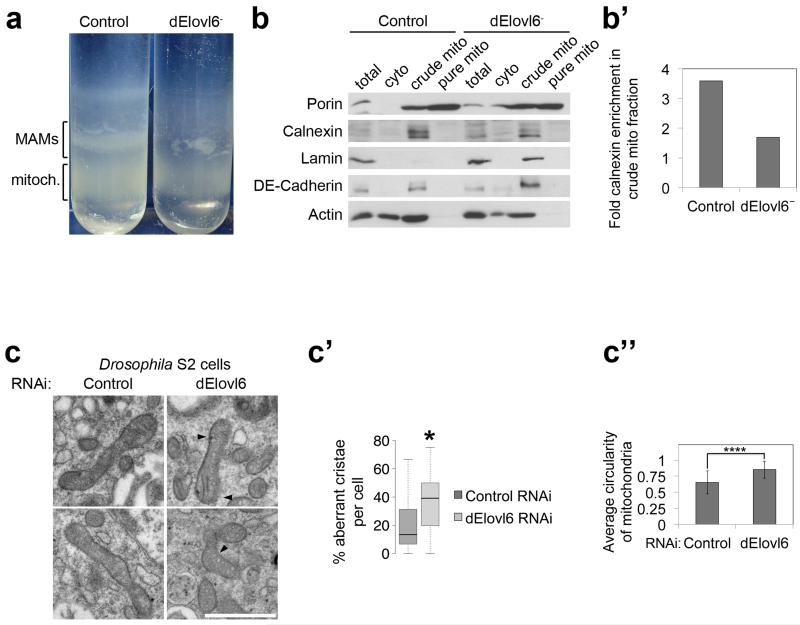
We asked if C18:0 affects Mfn via post-translational modifications (PTMs). Mfn from dElovl6− mutant larvae, or from HeLas growing with delipidated serum, migrated differently in SDS-PAGE compared to control conditions (ED Fig. 3e-f). Immunoprecipitating Mfn2 from HeLa +/−C18:0 and probing with antibodies detecting various PTMs revealed that Mfn2 from cells without C18:0 is hyper-ubiquitinated (endogenous proteins Fig. 3e lanes 1, 3, 5 and tagged proteins ED Fig. 3g). Several ubiquitin ligases target Mfn216-18. Only knockdown of HUWE1 rescued the mitochondrial fragmentation (Fig. 3f-f’, ED Fig. 4a-c) and Mfn2 hyper-ubiquitination (Fig. 3e lanes 3 vs 4) caused by C18:0 removal, as well as lethality of Elovl6 mutant flies (ED Fig. 4d), identifying HUWE1 as the C18:0-responsive ubiquitin ligase. As expected19, increased Mfn2 ubiquitination caused Mfn2 protein destabilization (ED Fig 3h-h’). C18:0 removal did not dramatically drop Mfn2 steady-state levels, partly due to compensatory increases in Mfn2 expression (ED Fig. 3i), suggesting ubiquitination additionally blocks Mfn2 function in a degradation-independent manner, as for other HUWE1 targets20. HUWE1 only ubiquitinates Mfn2 phosphorylated on Ser27 by JNK19. Inhibition of JNK prevented mitochondrial fragmentation upon C18:0 removal (Fig. 3g-g’). In sum, C18:0 regulates Mfn ubiquitination via HUWE1, and thereby mitochondrial morphology and function. Elovl6− mutant flies display other dMfn loss-of-function phenotypes, such as reduced ER-to-mitochondrial connections and abnormal cristae21,22 (ED Fig. 5).
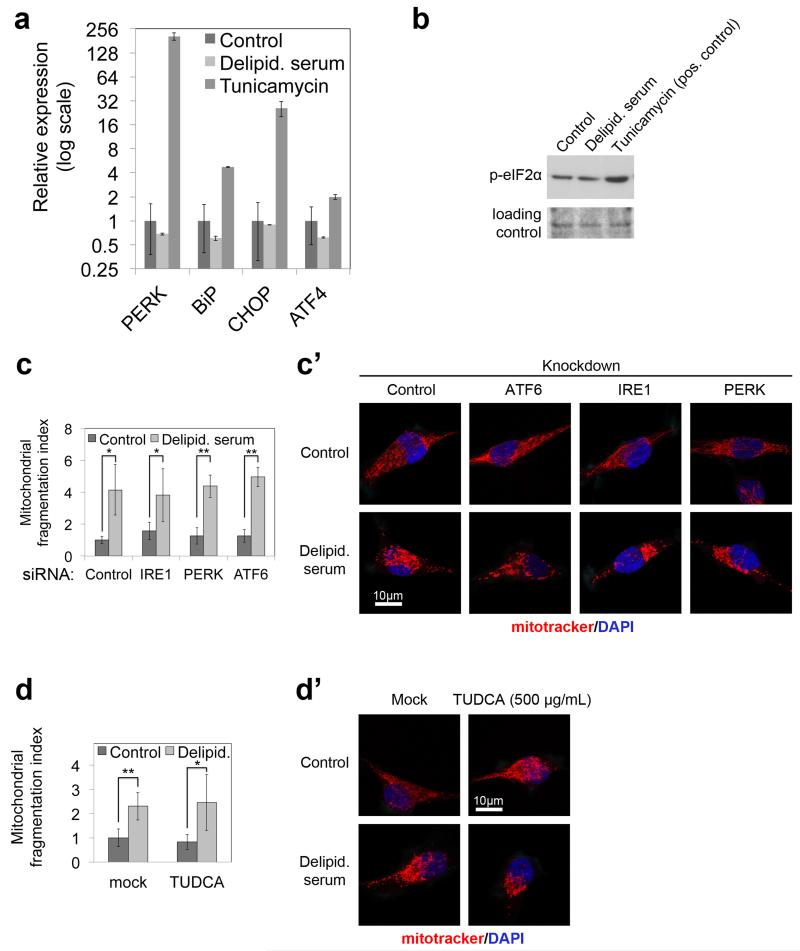
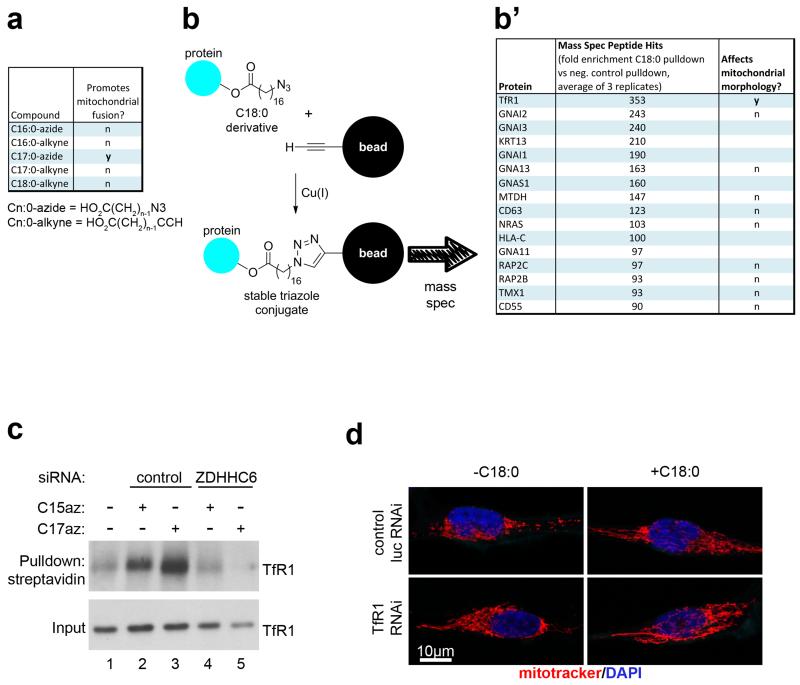
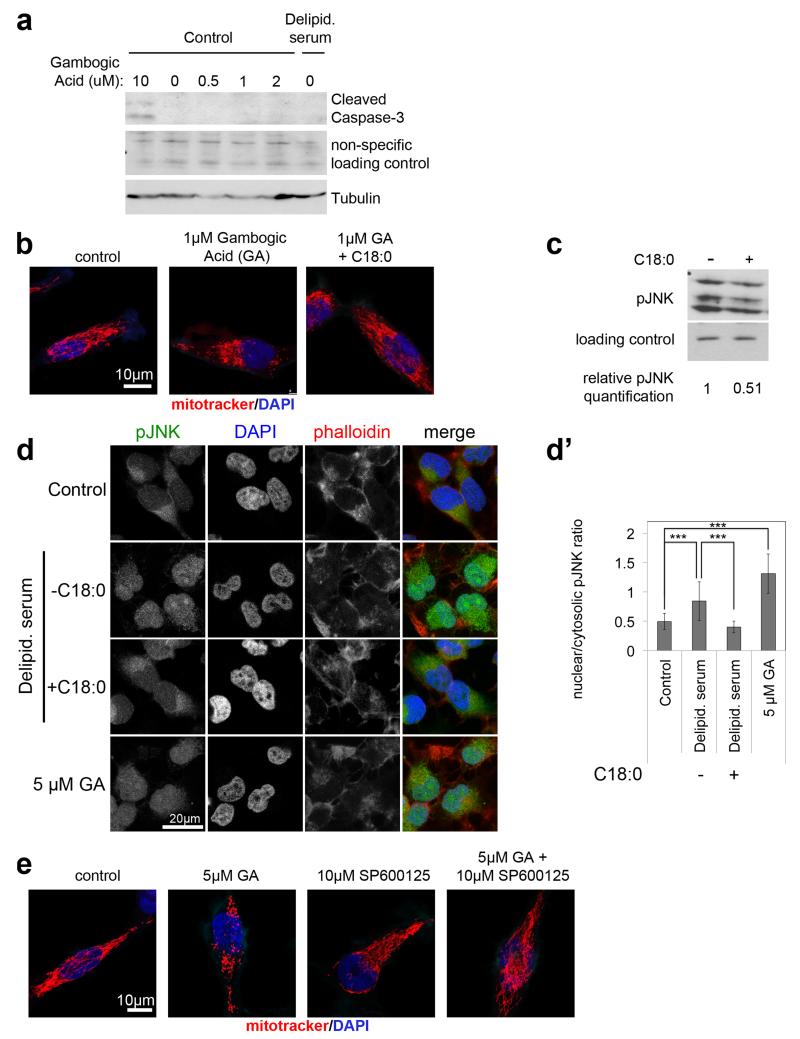
We asked how C18:0 affects JNK or HUWE1 activity. ER stress can activate JNK. However C18:0 removal did not lead to a UPR response (ED Fig. 6a-b) and neither knockdown of UPR effectors nor treatment with TUDCA, an ER chaperone that inhibits ER stress23, blunted mitochondrial fragmentation upon C18:0 removal (ED Fig. 6c-d’). Instead, we hypothesized C18:0 might regulate proteins via covalent binding (“stearoylation”), analogous to protein palmitoylation. We synthesized C18:0 derivatives with azide or alkyne functionalities, allowing covalent coupling to beads via copper-catalyzed azide-alkyne cycloaddition (“click chemistry”) (ED Fig. 7b). We tested multiple derivatives, and only C17:0-azide induced mitochondrial fusion like C18:0 (ED Fig. 7a). We treated HeLas with C17:0-azide for 2 hours, lysed them in 8M urea to denature proteins, precipitated the lipid by coupling to beads, and identified covalently bound proteins by mass spectrometry. The most abundant protein in the lipid pulldown was Transferrin Receptor (TfR1) (ED Fig. 7b’), confirmed by immunoblotting (ED Fig. 7c lanes 1-3). Binding of TfR1 to C17:0-azide was abolished by treating lysates with hydroxylamine pH7.5, indicating a thioester linkage (not shown). We tested the top 10 putatively stearoylated protein complexes for effects on mitochondrial morphology by knockdown. Knockdown of TfR1 completely blunted mitochondrial fragmentation upon C18:0 removal (Fig. 3h and ED Fig. 7b’,d). Thus TfR1 is required for cells to sense the absence of C18:0.
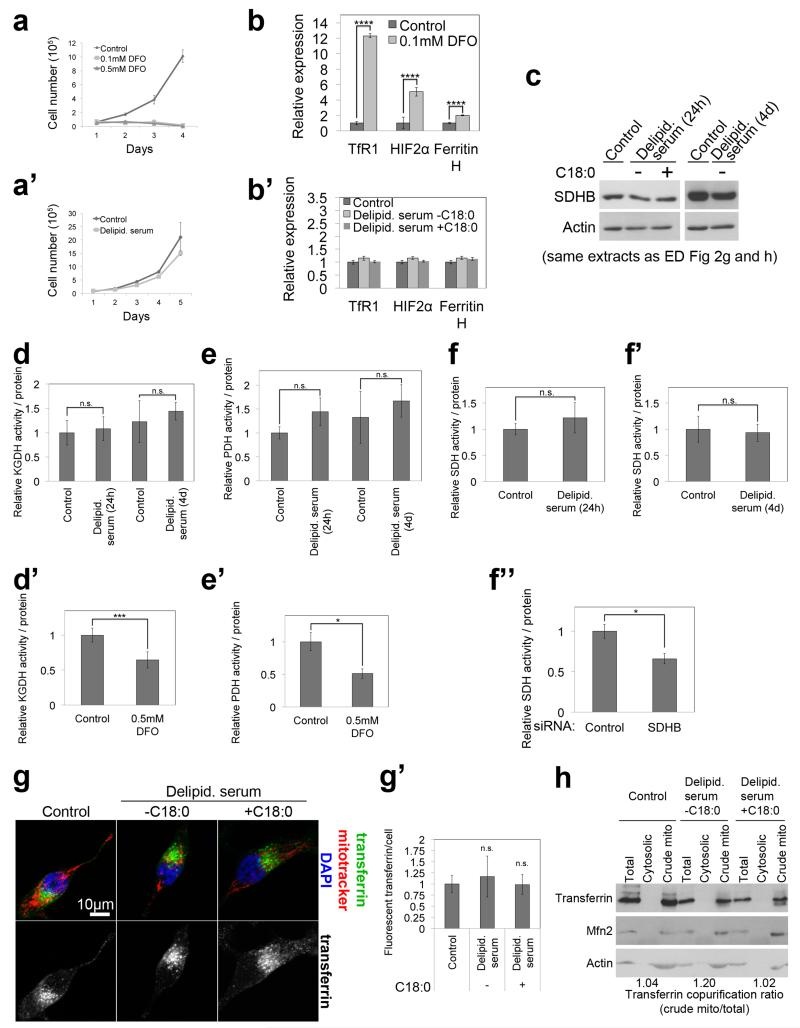
Since TfR1 is important for cellular iron uptake, TfR1 stearoylation could affect mitochondria via iron uptake or delivery. However, cells grow for days in medium lacking C18:0 but die in medium lacking iron (ED Fig. 8a-a’), suggesting iron uptake is not significantly impaired in the absence of C18:0. Indeed, cells in medium lacking C18:0 do not show an iron deficiency transcriptional response (ED Fig. 8b), nor a drop in protein or activity levels of enzymes containing iron-sulfur clusters (ED Fig. 8c-f”), nor impaired transferrin uptake (ED Fig. 8g-g’) nor reduced association of transferrin with mitochondria (ED Fig. 8h), suggesting the effects of C18:0 are independent of iron. TfR1 also has a signaling function, activating JNK in response to the ligand gambogic acid (GA)24. Low concentrations of GA which do not induce apoptosis (ED Fig. 9a) induced rapid mitochondrial fragmentation in HeLas (2 hours, Fig. 3i). This was suppressed by adding C18:0 (Fig. 3i and ED Fig. 9b), indicating C18:0 blocks this signaling function of TfR1. Indeed, treatment of HeLas with C18:0 reduced JNK activation, using Jun kinase phosphorylation and phospho-JNK nuclear translocation as readouts (ED Fig. 9c-d). JNK inhibition blocked the ability of GA to induce mitochondrial fragmentation (Fig. 3j and ED Fig. 9e). In sum, these data suggest TfR1 induces mitochondrial fragmentation via JNK, and this is inhibited by TfR1 stearoylation (Fig. 3k).
Palmitoyl-transferases covalently bind C16:0 before transferring it to substrates. We found one member of this family, ZDHHC6, in our C17:0-azide pulldowns, suggesting it is a C18:0 transferase. Indeed, knockdown of ZDHHC6 blunted TfR1 stearoylation (ED Fig. 7c, lane 5). Further work is required to study this in detail.
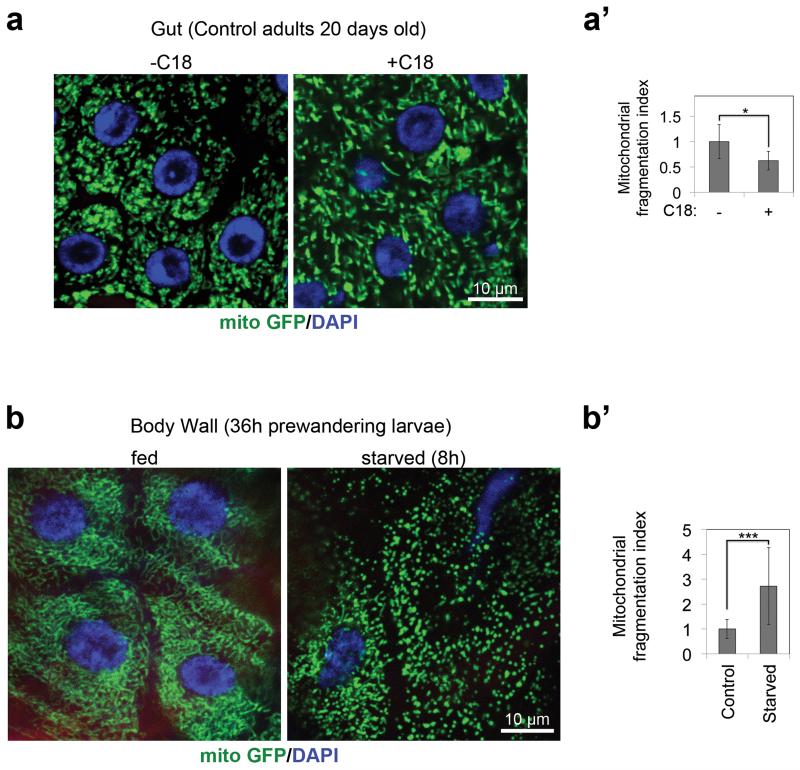
We noticed that elevating C18:0 levels in control cells increases mitochondrial fusion (Fig. 2b-b’). Supplementing the diet of wildtype flies with C18:0 also increased mitochondrial fusion, whereas starvation of larvae led to mitochondrial fragmentation (Fig. 4). Thus fly cells respond to both increases and decreases in levels of C18:0.
Figure 4. Mitochondrial morphology is sensitive to dietary C18:0 levels in Drosophila.
(a-a’) Dietary supplementation with 10% C18:0 leads to increased mitochondrial fusion in control flies (a), quantified as a drop in mitochondrial fragmentation (a’). (4 animals per condition, 6 optical areas per animal)
(b-b’) Starvation of larvae (8h on PBS agar) causes mitochondrial fragmentation (b) quantified in (b’). (3 animals per condition, 16 optical areas per animal)
Details in Supplementary Information.
(a’, b’) *p<0.05, ***p<0.001 of two tailed t-test, error bars represent s.d.
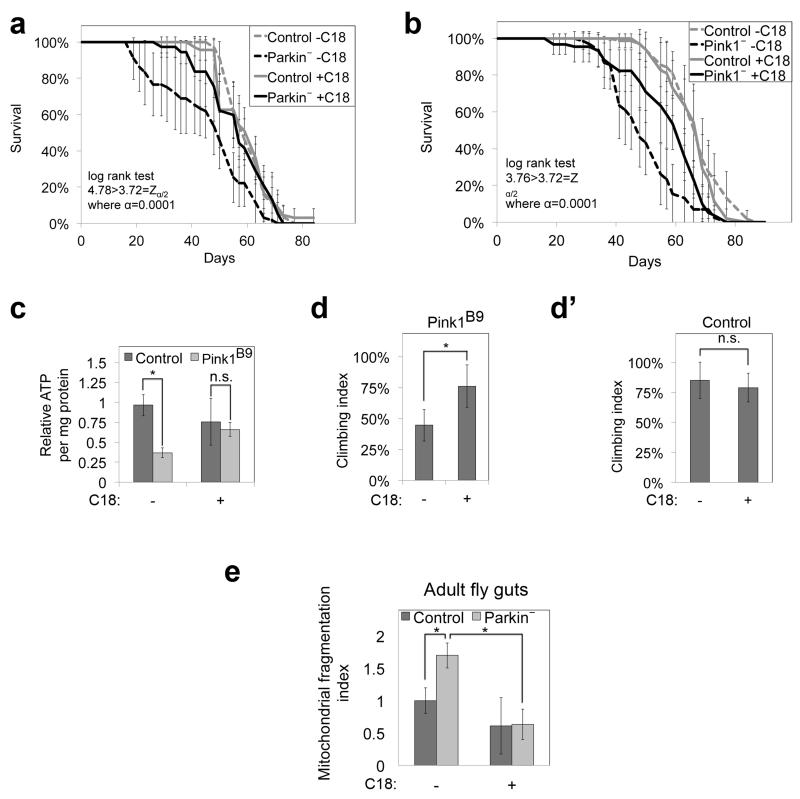
We asked if dietary C18:0 supplementation improves mitochondrial function in pathological conditions. Flies mutant for Pink or Parkin are established Parkinsons models. They have impaired mitochondrial function, and recapitulate Parkinsons phenotypes (reduced lifespan, neurodegeneration, and impaired motor control25-29). Dietary supplementation with C18:0 rescued the longevity, ATP levels, and climbing defects of Pink− flies and the longevity of Parkin− flies (Fig. 4, ED Fig. 10, other Parkin phenotypes not tested).
We identify C18:0 as a regulator of mitochondrial function. Upon loss of C18:0, TfR1 de-stearoylation activates JNK, leading to HUWE1-dependent Mfn ubiquitination, impaired Mfn activity19, and mitochondrial fragmentation. Loss of C18:0 in flies specifically impacts mitochondrial function, since Elovl6− lethality can be rescued by PGC1a, AOX, or mitofusin expression or HUWE1 knockdown. To our knowledge, this is the first time stearoylation of a human protein regulates its function. The link of TfR1 to mitochondria perhaps makes sense since iron enters cells via TfR1 and then mainly travels to mitochondria for iron-sulfur clusters. Flies are sensitive to dietary C18:0; increased dietary C18:0 leads to increased mitochondrial fusion in vivo. Thus the metabolite C18:0 acts as a signaling molecule linking diet to mitochondrial function. Intriguingly, dietary C18:0 can improve mitochondrial function also in some pathological conditions in the fly, since dietary supplementation with C18:0 improved the Parkinsons-related phenotypes observed in Pink and Parkin mutant flies. See Supplementary Discussion.
Methods
Please see Supplementary Information.
Extended Data
Extended Data Figure 1: dElovl6 is the functional homolog of human Elovl6.
(A) C16:0 to C18:0 elongase activity is significantly blunted in dElovl6 mutants, whereas elongase activities on other fatty acids measured are not affected. Microsomal preparations from control or dElovl6 mutant animals were incubated with radioactive malonyl-CoA and the indicated Fatty-Acyl-CoA. Elongation was quantified by incorporation of the aqueous metabolite malonyl-CoA into lipid soluble fatty acids, as described in 30. Values represent biological triplicates.
(b) Gas Chromatography Flame Ionization Detector (GC-FID) analysis reveals that dElovl6 mutant larvae have reduced levels of C18:0, the product of Elovl6 elongase activity. Values are the averages of technical duplicates on biological duplicates. Error bars represent s.e.m.
(c) Lethality of dElovl6 mutants is fully rescued to expected mendelian ratios by ubiquitous expression (with actin-GAL4) of dElovl6 from a UAS transgene (Chi square test 1.149<3.841=χ2 where p=0.05, n=141, **** p<0.0001).
(d) Human Elovl6 and Drosophila Elovl6 are functionally equivalent, since the lethality of dElovl6 mutant flies is fully rescued to expected mendelian ratios by ubiquitous expression (with actin-GAL4) of human Elovl6 from a UAS transgene (Chi square test 2.38<3.841=χ2 where p=0.05, n = 76, ** p<0.01)
(e) The lethality of dElovl6 mutant flies is most strongly rescued by C18:0, the product of Elovl6. Synchronized 1st instar larvae of indicated genotypes were grown on standard food supplemented with indicated fatty acids (5%). The percentage of total animals surviving to pupation was calculated. Values represent average of biological triplicates.
(f) dElovl6 mutants are not hypersensitivite to drugs such as G418 (protein biosynthesis inhibitor) or etoposide (topoisomerase inhibitor). 30 synchronized L1 larvae were grown in vials with food supplemented with either G418 (50μg/mL) or etoposite (25μM). Percentage of animals that reach pupation was quantified. Values represent average of 4 biological replicates.
(g) Complex IV activity of dElovl6− larvae is not impaired. Complex IV activity of female prewandering larvae was measured with Oroboros High Resolution Respirometry. Oxygen consumption was measured in the presence of only TMPD as substrate, which can be directly oxidized by complex IV. The values were corrected for non-mitochondrial oxygen consumption (oxygen consumption in the presence of complex IV inhibitor KCN) and normalized to tissue weight. (n=3)
(h, i) Overexpression of PGC1α (fly Spargel) in dElovl6 mutant female prewandering larvae leads to increased mitochondrial abundance, assessed by porin levels (h, representative of 6 biological replicates) and citrate synthase activity (i, n=4) in pre-wandering larvae. See Supplementary Information Figure 12 for image of the uncropped full western blot.
(j) dElovl6 (either N or C terminally tagged) localizes to the mitochondrial outer membrane. S2 cell lysates (“total”) were successively fractionated to yield crude mitochondria (which include mitochondrial-associated membranes, MAMs), pure mitochondria (lacking MAMs), and mitochondrial outer membranes (OM), inner membranes (IM) and inter-membrane space (IMS). Endogenous porin and ATPsyn-α were used as positive controls for OM and IM respectively. 7.5μg of protein from each fraction was loaded per lane. See Supplementary Information Figure 13 for image of the uncropped full western blot. Representative of 2 biological replicates.
(k) Lipidomic analysis of standard fly food reveals low levels of C18:0 in the food.
(a, c, d, e, f, g, i). Error bars represent s.d. (a, b, e, f, g, i) n.s. p≥0.05, * p<0.05, ** p<0.01, of two tailed t-test.
Extended Data Figure 2: C18:0 regulates mitochondrial morphology.
(a) Lipidomic (GC-FID) profiles of purified mitochondria from dElovl6 mutant 3rd instar larvae do not show major differences compared to control animals. Mitochondrial membranes from both control and mutant animals have very low levels of C18:0. Controls for purity of mitochondrial prep in ED Figure 6b.
(b-c) dElovl6 mutant larvae do not have reduced amounts of mitochondria, quantified via levels of porin (b, representative of 3 biological replicates) or citrate synthase activity (c, n=3). See Supplementary Information Figure 14 for image of the uncropped full western blot.
(d) dElovl6 mutant larvae have fragmented mitochondria, which is rescued by dietary C18:0 supplementation. Mitochondrial morphology from fat bodies of control or Elovl6 mutant female larvae, fed control or C18:0 (10%) supplemented food, visualized with mito-GFP. Images are representative of 8 areas of 4 larvae from each genotype and food conditions. Equivalent pictures for body wall are shown in Main Figure 2a.
(e-e’) Only C18:0, and not shorter, longer, or desaturated fatty acids, restores mitochondrial fragmentation to control levels in HeLa cells grown in medium containing delipidated serum. Mitochondria were visualized with mitotracker (red) (e) and mitochondrial fragmentation was quantified by normalizing the number of mitochondrial particles to total mitochondrial area (e’). (n=15)
(f-f”) Reduced lipoic acid (LA) levels do not lead to mitochondrial fragmentation. Lipoic acid synthase (LIAS) was knocked down by RNAi in HeLa cells, leading to significantly reduced LA levels, assayed by immunoblotting of total cell lysates with antibody detecting LA (f”). Unlike removal of C18:0, this does not lead to mitochondrial fragmentation. Representative images in (f), quantified in (f’) (n=6). See Supplementary Information Figure 14 for image of the uncropped full western blot.
(g, h) HeLa cells growing in medium containing delipidated serum do not display reduced levels of protein lipoylation (g) or reduced levels of lipoylated proteins (h). HeLa cells were grown in medium containing delipidated serum for either 24 hours (the same timepoint used for all other experiments in this manuscript where mitochondrial fragmentation is assessed) (g-h), or for an extended period of time – 4 days (h). Lipoic acid levels were assayed by immunobloting total cell lysates with an anti-lipoic acid antibody (g), and levels of lipoylated proteins were assessed with specific antibodies (h). See Supplementary Information Figure 15 for image of the uncropped full western blot.
(c, e’, f’) n.s. p≥0.05, * p<0.05, ** p<0.01, of two tailed t-test, error bars represent s.d.
All scale bars: 10μm.
Extended Data Figure 3: Mitofusin loss-of-function phenocopies Elovl6 mutation or removal of C18:0.
(a) dMfn (official gene symbol Marf) knockout larvae (1st instar) have fragmented mitochondria, visualized with mito-GFP. Representative of 10 images.
(b) Endogenous Mfn runs as a main band plus a laddering of apparently increasing molecular weights on an SDS-PAGE gel. Specificity is controlled by blotting lysates from control and Mfn knockout female larvae with anti-Mfn antibody.
(c) Homozygous mutation of dMfn is lethal. Mfn knockout larvae survive for multiple days as small L1/L2 larvae and eventually die. Synchronised 1st instar larvae were grown on standard fly food and examined every 24 hours for developmental stage and percent survival (n=30).
(d) dMfn knockout animals have impaired oxygen consumption. Oxygen consumption of inverted, digitonin permeabilized, female larval tissues was measured with an Oroboros oxygraph chamber and normalized to tissue weight. Oxygen consumption was measured in the presence of the following substrates: GMN (glutamate and malate), GMD (glutamate, malate and ADP), GMcD (glutamate, malate, cytochrome c and ADP), GMScD (glutamate, malate, succinate, cytochrome c and ADP), ETS (glutamate, malate, cytochrome c, ADP and uncoupling reagent), and Sc(Rot)u (glutamate, malate, cytochrome c, ADP and rotenone). (n=5)
(e) Endogenous dMfn is post-translationally modified in a C18:0-dependent manner in Drosophila. Mfn2 from dElovl6 female mutants migrates in an SDS-PAGE gel differently, compared to Mfn2 from control animals. This is reversed by supplementing the diet with C18:0. All indicated bands are dMfn, since they disappear in lysates from dMfn knock animals – see Extended Data Figure 3b. Flies were grown on antifungal free food.
(f) Endogenous Mfn2 is post-translationally modified in a C18:0-dependent manner in human HeLa cells. Mfn2 immunoprecipitated from HeLa cells treated 24 hours with medium containing standard or delipidated serum, and then 2 hours in the absence or presence of C18:0 (100μM), lysed in 8M urea – see Methods.
(g) C18:0 affects ubiquitination of Mfn2. Mfn2 is more heavily ubiquitinated in cells treated with delipidated serum than in control cells and this is reversed by supplementing the medium with C18. HeLa cells were cotransfected with tagged versions of Mfn2 (myc) and Ubiquitin (HA). Tagged Mfn2 was immunoprecipitated and blots were probed with HA antibody to detect ubiquitination. Quantification of ubiquitination, normalized to myc-Mfn2 in the IP is shown below the lane.
(h,h’) C18:0 removal destabilizes Mfn2 protein. A cyclohexamide (CHX) chase experiment was performed to block de novo synthesis of Mfn2, thereby looking at turnover of existing Mfn2 protein in vivo. HeLa cells treated with medium containing delipidated serum plus/minus C18:0 were treated with 100μM CHX and then lysed at indicated time points to compare Mfn2 protein levels. (h’) shows densitometric quantification of the blots normalized to loading control.
(i) dMfn expression is upregulated in dElovl6− flies compared to controls. dMfn transcript levels in 24-hour female prewandering larvae were determined by quantitative RT-PCR, normalized to rp49 (in triplicates).
Scale bar shows 10μm. (d, i) n.s. p≥0.05, * p<0.05, ** p<0.01, *** p<0.001 of two tailed t-test, error bars represent s.d.
See Supplementary Information Figure 16 for images of the uncropped full western blots.
Extended data figure 4: HUWE1 is required for hyperubiquitination of Mfn2 in response to C18:0 withdrawal.
(a) siRNA depletion of other ubiquitin ligases targeting Mfn (besides HUWE1, shown in main Figure 3) does not rescue the mitochondrial fragmentation induced by removal of C18:0 (a), quantified in (a’). (n=15)
(b) siRNA depletion of PARK2 in HEK293 cells, as in HeLa cells (a), does not rescue the mitochondrial fragmentation induced by removal of C18:0 (b), quantified in (b’). (n=15)
(c) HUWE1 knock down efficiency controlled by detecting HUWE1 protein levels. See Supplementary Information Figure 17 for image of the uncropped full western blot.
(d) Survival to pupation of Elovl6 mutants is fully rescued by ubiquitous expression (daughterless-GAL4) of RNAi targeting dHUWE1. Elovl6 mutants expressing HUWE1 RNAi survive to pupation at expected mendelian frequencies (Chi square test 0.86<3.841=χ2 where p=0.05). Flies were grown on antifungal free food. Values represent average of 4 biological replicates.
All scale bars show 10μm. (a’, b’, d) n.s. p≥0.05, * p<0.05, ** p<0.01, ***p<0.001 of two tailed t-test, error bars represent s.d.
Extended Data Figure 5: dElovl6 mutants have other Mfn loss-of-function phenotypes such as reduced mitochondrial-associated membranes (MAMs) and abnormal cristae.
(a) The mitochondrial associated membranes (MAM) band is strongly reduced or absent in percoll gradients of crude mitochondrial fractions from dElovl6 mutant animals, compared to controls.
(b) Purity control of mitochondrial preps show that pure mitochondrial fractions are lacking markers of other subcellular organelles such as Calnexin (ER) and Lamin (nuclei). See Supplementary Information Figure 17 for image of the uncropped full western blot.
(b’) Quantification of (b) shows that levels of the ER marker calnexin are reduced in crude mitochondrial fractions from dElovl6 mutants, compared to controls, in agreement with reduced MAMs in dElovl6 mutants. Values show densitometry ratios of calnexin levels in crude mitochondrial fractions, normalized to total lysate calnexin.
(c-c”) Electron microscopy of Drosophila S2 cell mitochondria (c) reveals cristae abnormalities in dElovl6 depleted cells, quantified in (c’) (n=200). Significance of the difference was calculated with a Mann-Whitney test (*p<0.05). (c”) average circularity of mitochondria was calculated with Image J software. Scale bar: 1μm. (n=200, ****p<0.0001 of two tailed t-test)
(c’ and c”) error bars: s.d.
Extended Data Figure 6: C18:0 removal does not lead to ER stress, and inhibiting UPR does not inhibit mitochondrial fragmentation upon C18:0 removal.
(a) C18:0 removal for 24 hours does not induce expression of UPR target genes, quantified by quantitative RT-PCR, normalized to hRpL19. BiP is a readout for IRE1 activation, CHOP is a readout for ATF6 activation, and PERK is a readout of its own activation due to a positive transcriptional feedback loop. Tunicamycin, serves as a positive control. y-axis is displayed in logarithmic scale to fit all datapoints on one graph. The experiment was done in triplicates.
(b) p-eIF2α, a UPR marker, does not increase upon removal of C18:0 whereas it is induced by tunicamycin, a positive control. See Supplementary Information Figure 18 for image of the uncropped full western blot.
(c-c’) Knocking down mediators of the UPR response does not inhibit mitochondrial fragmentation upon C18:0 removal. HeLa cells were transfected with either control siRNAs or siRNAs targeting UPR mediators as indicated. (c) shows the mitochondrial fragmentation index and (c’) shows representative images. (n=15)
(d-d’) Inhibiting ER stress by means of a chemical chaperone, TUDCA, does not rescue mitochondrial fragmentation upon C18:0 removal. HeLa cells were pretreated with 500 μg/mL TUDCA 30 minutes before delipidated serum treatment. (d) shows mitochondrial fragmentation index (n=15) and (d’) shows representative images.
(a, c, d) *p<0.05, **p<0.01 of two tailed t-test, error bars: s.d.
Extended Data Figure 7: TfR1 is the mediator of C18:0 signaling to mitochondrial morphology.
(a) C17:0-azide is a functional analog of C18:0 in that it induces mitochondrial fusion in HeLa cells, whereas other C18:0 derivatives are not. (Cn:0-azide = HO2C(CH2)n-1N3 and Cn:0-alkyne = HO2C(CH2)n-1CCH).
(b-b’) Transferrin receptor (TfR1) is the most enriched protein in a C17:0-azide pull-down, and it regulates mitochondrial morphology. HeLa cells were treated with C17:0-azide for 2 hours, and covalently bound proteins were precipitated by lysing cells under denaturing conditions (8M urea), and linking the C17:0-azide to an alkyne-labelled resin via click chemistry (b). Precipitated proteins were identified by mass spec, and peptide counts were normalized to peptide counts in a negative control pull-down from cells not treated with C17:0-azide (n=3) (b’, column 2). Indicated proteins were also tested by siRNA-mediated knockdown for effects on mitochondrial morphology (column 3).
(c) TfR1 is covalently bound to the C18:0 derivative C17:0-azide in HeLa cells in a ZDHHC6-dependent manner. HeLas were treated with C17:0-azide for 2 hours, and subsequently lysed in denaturing conditions (8M urea). Similar to panel (b), the C17:0-azide was “clicked” onto a biotinylated alkyne, and the labelled proteins were pulled-down with streptavidin beads. After washing, immunoprecipitated proteins were eluted off beads in Laemmli buffer containing biotin, and analyzed by immunoblotting. The palmitic acid analog C15:0-azide was used as a positive control since TfR1 is known to also be palmitoylated. C17:0-azide pulls down more TfR1 than equal amounts of C15:0-azide, indicating that TfR1 palmitoylation cannot account for the C17:0 signal. The C17:0-azide-TfR1 interaction is completely blunted upon ZDHHC6 knockdown. See Supplementary Information Figure 18 for image of the uncropped full western blot.
(d) TfR1 is required for C18:0 removal to induce mitochondrial fragmentation. HeLa cells were transfected with either control or TfR1 targeting siRNAs prior to treatement with medium containing delipidated serum +/− C18:0. Representative images are shown here and quantification of mitochondrial fragmentation is shown in the main Figure 3h. (n=15)
Extended Data Figure 8: C18:0 removal does not effect iron uptake or delivery.
(a, a’) HeLa cells cannot grow in the presence of DFO, an iron chelator (a) whereas they grow in delipidated serum lacking C18:0 at a comparable rate to cells in control medium (a’). (n=3)
(b, b’) Treatment of HeLa cells with medium containing delipidated serum (lacking C18:0) for 24h does not lead to transcriptional activation of iron deficiency response genes (b’), which are activated by DFO-mediated iron chelation (24h) as a positive control (b). (n=3)
(c) Treatment of HeLa cells with medium containing delipidated serum for 24 hours or 4 days does not lead to a drop in levels of the succinate dehydrogenase protein SDHB, which contains an Fe-S cluster. See Supplementary Information Figure 19 for image of the uncropped full western blot.
(d-f”) Treatment of HeLa cells with medium containing delipidated serum for 24 hours or 4 days does not lead to a drop in activities of enzymes containing lipoylated subunits (PDH and OGDH) (d-e’) or Fe-S cluster containing subunits (SDH) (f-f”). DFO treatment to chelate iron from the medium, or siRNA-mediated depletion of the enzymes were used as positive controls (d’, e’, f”). (n=4).
(g, g’) Treatment of HeLa cells with medium containing delipidated serum (24h) does not cause a reduction in transferrin uptake. Cells were treated with 25 μg/mL Alexa 488 coupled transferrin for 30 minutes. Representative images (g) and quantification of the amount of transferrin per cell in (g’) (n=5).
(h) Treatment of HeLa cells with medium containing delipidated serum (24h) does not reduce association of transferrin containing vesicles with mitochondria. Crude mitochondria were fractionated from cells growing in medium containing or lacking C18:0, and the amount of transferrin that copurifies with mitochondria was analyzed and quantified by immunoblotting. See Supplementary Information Figure 19 for image of the uncropped full western blot.
(a, a’, b, b’, d, d’, e, e’, f, f’, f”, g’) n.s. p≥0.05, * p<0.05, *** p<0.001, ****p<0.0001 of two tailed t-test, error bars: s.d.
Extended data figure 9: JNK signaling is required for mitochondrial fragmentation induced by C18:0 removal.
(a) Treatment of HeLa cells with 1μM gambogic acid does not induce apoptosis. 10 μM, gambogic acid was used as a positive control for apoptosis induction, assessed by cleaved caspase-3 levels. 1μM gambogic acid neither induces caspase cleavage (shown here) nor causes cells to die (not shown). Cells were treated with 10μM gambogic acid for 1 hour, or for all other concentrations for 3 hours. See Supplementary Information Figure 20 for image of the uncropped full western blot.
(b) Activation of TfR1 by treating cells with 1μM gambogic acid leads to mitochondrial fragmentation which is reversed by 1 hour C18:0 pretreatment. Representative images are shown here and quantification of mitochondrial fragmentation is shown in main Figure 3i (n=15).
(c) Treatment of HeLa cells with C18:0 to inhibit TfR1 causes reduced JNK signaling activity, assayed by p-Jun kinase levels on an immunoblot. See Supplementary Information Figure 20 for image of the uncropped full western blot.
(d, d’) Removal of C18:0, as well as treatment with gambogic acid, induces shuttling of phosphorylated Jun kinase into the nucleus. Cells were stained with phosho Jun kinase antibody (d) and relative levels of nuclear to cytosolic phospho Jun kinase signal was quantified (d’) (n=37 cells). ***p<0.001 of two tailed t-test. Error bars: s.d.
(e) JNK signaling is required for TfR1 activation to induce mitochondrial fragmentation. HeLa cells were treated with the JNK inhibitor SP600125 30 minutes prior to gambogic acid treatment to activate TfR1. Representative images are shown here and quantification of mitochondrial fragmentation is shown in main Figure 3j (n=15).
Extended Data Figure 10: Dietary C18:0 improves Parkinsons phenotypes of Pink and Parkin mutant flies.
(a, b) Dietary C18:0 supplementation (10%) significantly increases lifespan of male Parkin25 (a) and Pink1B9 (b) mutant flies. (n=8 × 10 animals).
(c) Dietary C18:0 supplementation rescues ATP levels of 1-week old male Pink1B9 mutant adult flies. (n=3 × 3 animals).
(d-d’) Dietary C18:0 supplementation significantly improves locomotor defects of 2-week old male Pink1B9 mutant flies. Locomotion quantified as animals climbing up past a threshold in given amount of time (technical duplicates, biological quadruplicates, 10 animals per assay).
(e) Parkin loss-of-function in flies leads to mitochondrial fragmentation which is rescued by dietary supplementation with C18:0. Guts from 14-day old female control or park25 mutant adult flies expressing mitoGFP and grown on food supplemented +/− C18:0 (10%) were dissected and mitochondria were imaged. Quantification of mitochondrial fragmentation is shown. (3 animals per condition, 6 optical areas per animal)
For panels (b-d) control flies are the revertant line Pink1RV.
(a, b, c, d, d’, e) Error bars show s.d., * p<0.05, n.s. p≥0.05
Supplementary Material
Acknowledgements
We thank Antonio Zorzano and Jorge Seco for photo-activatable mito-GFP, Antonio Zorzano and Juan Pablot for myc-tagged Mfn2, Howy Jacobs for UAS-AOX flies, Christian Frei for UAS-Spargel flies, Patrik Verstreken for parkinsons flies, Alex Whitworth for anti-dMfn, Jongkyeong Chung for anti-dPorin, Roland Lill for anti-IBA57, Jessica Sagalés (Zorzano lab) for help with respirometry on the Mfn knockout animals, Frauke Melchior for advice on detecting ubiquitination, Karsten Richter (DKFZ EM Core Facility) for help with electron microscopy, the DKFZ Light Microscopy Core Facility for help with live-cell imaging, Martina Schnölzer (DKFZ Proteomics Core Facility) for Mass Spec analysis of proteins, and Maria del Sol for technical support. This work was supported in part by Deutsche Forschungsgemeinschaft (DFG), SFB1118, Helmholtz Portfolio Topic ‘Metabolic Dysfunction’, and ERC Starting Grants (#260602) to A.A.T., and BBSRC and MRC programme grants to AVP.
Footnotes
Competing financial interests
The authors declare no competing financial interests.
References
- 1.McBride HM, Neuspiel M, Wasiak S. Mitochondria: more than just a powerhouse. Current biology: CB. 2006;16:R551–560. doi: 10.1016/j.cub.2006.06.054. doi:10.1016/j.cub.2006.06.054. [DOI] [PubMed] [Google Scholar]
- 2.Vafai SB, Mootha VK. Mitochondrial disorders as windows into an ancient organelle. Nature. 2012;491:374–383. doi: 10.1038/nature11707. doi:10.1038/nature11707. [DOI] [PubMed] [Google Scholar]
- 3.Suen DF, Norris KL, Youle RJ. Mitochondrial dynamics and apoptosis. Genes Dev. 2008;22:1577–1590. doi: 10.1101/gad.1658508. doi:10.1101/gad.1658508. [DOI] [PMC free article] [PubMed] [Google Scholar]
- 4.Nunnari J, Suomalainen A. Mitochondria: in sickness and in health. Cell. 2012;148:1145–1159. doi: 10.1016/j.cell.2012.02.035. doi:10.1016/j.cell.2012.02.035. [DOI] [PMC free article] [PubMed] [Google Scholar]
- 5.Jornayvaz FR, Shulman GI. Regulation of mitochondrial biogenesis. Essays in biochemistry. 2010;47:69–84. doi: 10.1042/bse0470069. doi:10.1042/bse0470069. [DOI] [PMC free article] [PubMed] [Google Scholar]
- 6.Moon YA, Ochoa CR, Mitsche MA, Hammer RE, Horton JD. Deletion of ELOVL6 Blocks the Synthesis of Oleic Acid but does not Prevent the Development of Fatty Liver or Insulin Resistance. Journal of lipid research. 2014 doi: 10.1194/jlr.M054353. doi:10.1194/jlr.M054353. [DOI] [PMC free article] [PubMed] [Google Scholar]
- 7.Matsuzaka T, et al. Elovl6 promotes nonalcoholic steatohepatitis. Hepatology. 2012;56:2199–2208. doi: 10.1002/hep.25932. doi:10.1002/hep.25932. [DOI] [PubMed] [Google Scholar]
- 8.Jung A, Hollmann M, Schafer MA. The fatty acid elongase NOA is necessary for viability and has a somatic role in Drosophila sperm development. Journal of cell science. 2007;120:2924–2934. doi: 10.1242/jcs.006551. doi:10.1242/jcs.006551. [DOI] [PubMed] [Google Scholar]
- 9.Fernandez-Ayala DJ, et al. Expression of the Ciona intestinalis alternative oxidase (AOX) in Drosophila complements defects in mitochondrial oxidative phosphorylation. Cell metabolism. 2009;9:449–460. doi: 10.1016/j.cmet.2009.03.004. doi:10.1016/j.cmet.2009.03.004. [DOI] [PubMed] [Google Scholar]
- 10.Friedman JR, Nunnari J. Mitochondrial form and function. Nature. 2014;505:335–343. doi: 10.1038/nature12985. doi:10.1038/nature12985. [DOI] [PMC free article] [PubMed] [Google Scholar]
- 11.Okamoto K, Shaw JM. Mitochondrial morphology and dynamics in yeast and multicellular eukaryotes. Annual review of genetics. 2005;39:503–536. doi: 10.1146/annurev.genet.38.072902.093019. doi:10.1146/annurev.genet.38.072902.093019. [DOI] [PubMed] [Google Scholar]
- 12.Cassidy-Stone A, et al. Chemical inhibition of the mitochondrial division dynamin reveals its role in Bax/Bak-dependent mitochondrial outer membrane permeabilization. Developmental cell. 2008;14:193–204. doi: 10.1016/j.devcel.2007.11.019. doi:10.1016/j.devcel.2007.11.019. [DOI] [PMC free article] [PubMed] [Google Scholar]
- 13.Twig G, et al. Tagging and tracking individual networks within a complex mitochondrial web with photoactivatable GFP. American journal of physiology. Cell physiology. 2006;291:C176–184. doi: 10.1152/ajpcell.00348.2005. doi:10.1152/ajpcell.00348.2005. [DOI] [PubMed] [Google Scholar]
- 14.Campello S, Scorrano L. Mitochondrial shape changes: orchestrating cell pathophysiology. EMBO reports. 2010;11:678–684. doi: 10.1038/embor.2010.115. doi:10.1038/embor.2010.115. [DOI] [PMC free article] [PubMed] [Google Scholar]
- 15.Liesa M, Palacin M, Zorzano A. Mitochondrial dynamics in mammalian health and disease. Physiological reviews. 2009;89:799–845. doi: 10.1152/physrev.00030.2008. doi:10.1152/physrev.00030.2008. [DOI] [PubMed] [Google Scholar]
- 16.Escobar-Henriques M, Langer T. Dynamic survey of mitochondria by ubiquitin. EMBO reports. 2014;15:231–243. doi: 10.1002/embr.201338225. doi:10.1002/embr.201338225. [DOI] [PMC free article] [PubMed] [Google Scholar]
- 17.Livnat-Levanon N, Glickman MH. Ubiquitin-proteasome system and mitochondria - reciprocity. Biochimica et biophysica acta. 2011;1809:80–87. doi: 10.1016/j.bbagrm.2010.07.005. doi:10.1016/j.bbagrm.2010.07.005. [DOI] [PubMed] [Google Scholar]
- 18.Ziviani E, Tao RN, Whitworth AJ. Drosophila parkin requires PINK1 for mitochondrial translocation and ubiquitinates mitofusin. Proceedings of the National Academy of Sciences of the United States of America. 2010;107:5018–5023. doi: 10.1073/pnas.0913485107. doi:10.1073/pnas.0913485107. [DOI] [PMC free article] [PubMed] [Google Scholar]
- 19.Leboucher GP, et al. Stress-induced phosphorylation and proteasomal degradation of mitofusin 2 facilitates mitochondrial fragmentation and apoptosis. Mol Cell. 2012;47:547–557. doi: 10.1016/j.molcel.2012.05.041. doi:10.1016/j.molcel.2012.05.041. [DOI] [PMC free article] [PubMed] [Google Scholar]
- 20.de Groot RE, et al. Huwe1-mediated ubiquitylation of dishevelled defines a negative feedback loop in the Wnt signaling pathway. Science signaling. 2014;7:ra26. doi: 10.1126/scisignal.2004985. doi:10.1126/scisignal.2004985. [DOI] [PubMed] [Google Scholar]
- 21.Lee S, et al. Mitofusin 2 is necessary for striatal axonal projections of midbrain dopamine neurons. Human molecular genetics. 2012;21:4827–4835. doi: 10.1093/hmg/dds352. doi:10.1093/hmg/dds352. [DOI] [PubMed] [Google Scholar]
- 22.de Brito OM, Scorrano L. Mitofusin 2 tethers endoplasmic reticulum to mitochondria. Nature. 2008;456:605–610. doi: 10.1038/nature07534. doi:10.1038/nature07534. [DOI] [PubMed] [Google Scholar]
- 23.Ozcan U, et al. Chemical chaperones reduce ER stress and restore glucose homeostasis in a mouse model of type 2 diabetes. Science. 2006;313:1137–1140. doi: 10.1126/science.1128294. doi:10.1126/science.1128294. [DOI] [PMC free article] [PubMed] [Google Scholar]
- 24.Jian J, Yang Q, Huang X. Src regulates Tyr(20) phosphorylation of transferrin receptor-1 and potentiates breast cancer cell survival. The Journal of biological chemistry. 2011;286:35708–35715. doi: 10.1074/jbc.M111.271585. doi:10.1074/jbc.M111.271585. [DOI] [PMC free article] [PubMed] [Google Scholar]
- 25.Whitworth AJ, Wes PD, Pallanck LJ. Drosophila models pioneer a new approach to drug discovery for Parkinson’s disease. Drug discovery today. 2006;11:119–126. doi: 10.1016/S1359-6446(05)03693-7. doi:10.1016/S1359-6446(05)03693-7. [DOI] [PubMed] [Google Scholar]
- 26.Greene JC, et al. Mitochondrial pathology and apoptotic muscle degeneration in Drosophila parkin mutants. Proceedings of the National Academy of Sciences of the United States of America. 2003;100:4078–4083. doi: 10.1073/pnas.0737556100. doi:10.1073/pnas.0737556100. [DOI] [PMC free article] [PubMed] [Google Scholar]
- 27.Park J, et al. Mitochondrial dysfunction in Drosophila PINK1 mutants is complemented by parkin. Nature. 2006;441:1157–1161. doi: 10.1038/nature04788. doi:10.1038/nature04788. [DOI] [PubMed] [Google Scholar]
- 28.Park J, Kim Y, Chung J. Mitochondrial dysfunction and Parkinson’s disease genes: insights from Drosophila. Disease models & mechanisms. 2009;2:336–340. doi: 10.1242/dmm.003178. doi:10.1242/dmm.003178. [DOI] [PubMed] [Google Scholar]
- 29.Guo M. Drosophila as a model to study mitochondrial dysfunction in Parkinson’s disease. Cold Spring Harbor perspectives in medicine. 2012;2 doi: 10.1101/cshperspect.a009944. doi:10.1101/cshperspect.a009944. [DOI] [PMC free article] [PubMed] [Google Scholar]
- 30.Jump DB. Mammalian fatty acid elongases. Methods in molecular biology. 2009;579:375–389. doi: 10.1007/978-1-60761-322-0_19. doi:10.1007/978-1-60761-322-0_19. [DOI] [PMC free article] [PubMed] [Google Scholar]
Associated Data
This section collects any data citations, data availability statements, or supplementary materials included in this article.


