

Abstract
Estimating the rate of exchange of individuals among populations is a central concern to evolutionary ecology and its applications to conservation and management. For instance, the efficiency of protected areas in sustaining locally endangered populations and ecosystems depends on reserve network connectivity. The population genetics theory offers a powerful framework for estimating dispersal distances and migration rates from molecular data. In the marine realm, however, decades of molecular studies have met limited success in inferring genetic connectivity, due to the frequent lack of spatial genetic structure in species exhibiting high fecundity and dispersal capabilities. This is especially true within biogeographic regions bounded by well-known hotspots of genetic differentiation. Here, we provide an overview of the current methods for estimating genetic connectivity using molecular markers and propose several directions for improving existing approaches using large population genomic datasets. We highlight several issues that limit the effectiveness of methods based on neutral markers when there is virtually no genetic differentiation among samples. We then focus on alternative methods based on markers influenced by selection. Although some of these methodologies are still underexplored, our aim was to stimulate new research to test how broadly they are applicable to nonmodel marine species. We argue that the increased ability to apply the concepts of cline analyses will improve dispersal inferences across physical and ecological barriers that reduce connectivity locally. We finally present how neutral markers hitchhiking with selected loci can also provide information about connectivity patterns within apparently well-mixed biogeographic regions. We contend that one of the most promising applications of population genomics is the use of outlier loci to delineate relevant conservation units and related eco-geographic features across which connectivity can be measured.
Keywords: connectivity, gene flow, marine conservation, population genomics, population structure
Introduction
Inferring population connectivity from molecular data within a population genetic framework can shed light on the evolutionary and ecological processes that shape patterns of genetic diversity (Clobert et al. 2012). Population genetic approaches offer convenient methods to evaluate the rate and scale of dispersal (or migration) when the movement of individuals cannot be assessed by other means such as mark–recapture field experiments. This problem is particularly acute in the marine environment, where the distribution and migratory pathways of organisms are hidden to human eyes underneath the surface of the oceans (Hellberg 2009; Selkoe and Toonen 2011). The potential of genetic methods, illustrated by successful studies in reef species (Selkoe et al. 2010; Puebla et al. 2012), has led to increased expectations for inferring marine connectivity patterns from molecular markers, especially for conservation and management purposes.
The majority of marine species, however, display combinations of life history traits (e.g. high fecundity, large population sizes, high dispersal potential often combined to complex life cycles) that produce weak patterns of genetic differentiation or even no differentiation at all (Ward et al. 1994; Waples 1998; Palumbi 2003; Hedgecock et al. 2007). A lack of genetic differentiation may result from a range of situations spanning from nearly complete demographic independence among large-sized populations to the existence of a unique panmictic population (Palumbi 2003; Waples and Gaggiotti 2006; Waples et al. 2008) (Fig. 1). Spatial genetic homogeneity may thus hide a large diversity of scenarios with regard to the contemporary rates of demographic exchanges among groups of individuals inhabiting different parts of a species range. This is of particular concern because the per-generation number of migrants, which is sufficient to lead to apparent genetic panmixia, may not be high enough to ensure demographic connectivity and rescue effects (Waples 1998; Lowe and Allendorf 2010). This discrepancy between the objective of inferring demographic connectivity for conservation biology and management purposes and the limitations inherent to most population genetic approaches has motivated several reviews in the field (Waples and Gaggiotti 2006; Broquet and Petit 2009; Hellberg 2009; Lowe and Allendorf 2010). Our goal here is not to provide a new synthesis of existing methods to infer connectivity, which have been thoroughly addressed in those reviews. We rather aim at considering the new perspectives offered by the increasing number of markers in population genomic studies, with a special focus on the use of loci influenced by selection. The rapid spread of next-generation sequencing (NGS)-based genotyping methods in the molecular ecologists' toolbox has considerably enhanced our ability to identify and characterize genetic variation from population samples (Davey et al. 2011). Still, it remains unclear which approaches will benefit the most from this massive amount of sequence data. One direct benefit of analyzing thousands of markers is an increased precision in measuring genetic differentiation and a higher statistical power to detect small genetic differences among populations (Waples 1998). However, populations with large effective sizes, high migration rates or both may remain virtually undifferentiated, and thus, multiplying neutral markers in such cases may still fail to reveal the current level of demographic connectivity.
Figure 1.
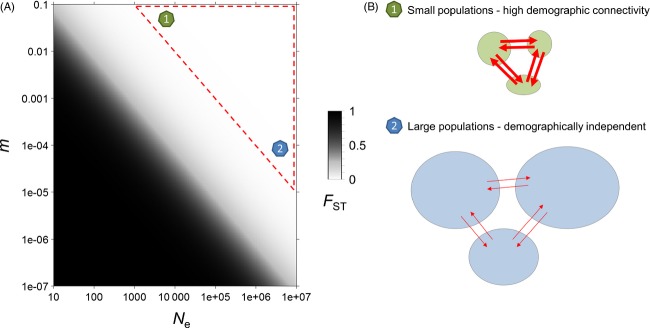
The demographic parameters values behind weak FST values. (A) Because of the nonlinear relationship between FST and Nem in the island model, genetic differentiation (FST, in color scale) rapidly shrinks as the per-generation number of migrants (Nem) increases. (B) At equilibrium, weak to null genetic differentiation is expected for small (Ne = 103) and highly connected (m = 10−1) populations, but also for large (Ne = 107) and demographically independent (m = 10−5) populations.
Another major achievement offered by NGS approaches is to facilitate the discovery of genetic markers that are influenced by selection (Allendorf et al. 2010; Stapley et al. 2010). These outlier loci can reveal genetic differentiation patterns at the place where neutral markers often remain uninformative, and therefore, it has been suggested that the signal held by outlier loci could be used to delineate locally adapted stocks and redefine conservation units (Nielsen et al. 2009, 2012; Funk et al. 2012). This approach is appealing because selection may be much more efficient than drift in opposing the homogenizing effect of migration, in particular when populations have large effective sizes. However, outlier loci may arise through a wide variety of evolutionary mechanisms apart from local adaptation, which is the primary target of most genome scan studies looking for adaptive variation (Bierne et al. 2013). These evolutionary mechanisms thus need to be identified before using outlier loci to evaluate connectivity.
Allele frequency shifts at outlier loci are expected to be concentrated in particular geographic regions where strong ecological gradients promote local adaptation (Schmidt et al. 2008). Hotspots of genetic differentiation may also arise through the trapping of tension zones by natural barriers to dispersal (Barton 1979a), or through the coupling between exogenous and endogenous reproductive barriers (Bierne et al. 2011). These predictions are corroborated by well-known hotspots of genetic differentiation in the sea (e.g. the Almeria-Oran front, the Siculo-Tunisian strait, Cape Agulhas, Cape Cod, Oresund, Point Conception, among others). However, marine conservation and management issues often require measures of connectivity in areas located outside these particular zones. In a last section, we explore alternative mechanisms that generate disequilibrium at neutral hitchhiker loci even outside the cline of the selected locus itself. These indirect effects of selection can reveal cryptic genetic structure within apparently well-mixed areas. These effects are of two sorts: (i) gradients of introgression (or introgression tails) originating from a geographically distant contact zone (Gagnaire et al. 2011) and (ii) hitchhiking clines that are transiently generated during the propagation of a selective sweep (Bierne 2010). Large population genomic datasets now provide molecular ecologists with the means to use these patterns to study marine connectivity. Therefore, there is a good hope that gathering theoretical background with these new data will further catalyze research in the field.
Genetic approaches to marine connectivity using neutral markers: successes and limits
Quantitative methods for inferring dispersal with neutral genetic markers fall into two broad categories. One first class of methods looks for the effects of gene flow on the level of genetic differentiation between populations. These methods rely on population genetics models that integrate all relevant evolutionary forces, apart from the effect of mutation which can be neglected for a wide range of migration rates (Box 1). For instance, migration can be indirectly inferred using observations of genetic structure and a model formalizing how gene flow might have produced these observations. The second option is to detect individual dispersal events directly to reconstruct the distribution of dispersal distances, which can be done through genealogy inference (e.g. parentage assignment) or clustering analysis to ascertain population membership of individuals. Not all methods strictly take one of these two routes, but we mention this broad dichotomy here because it gives a good indication of the underlying assumptions, the amount of data required, the nature of the dispersal (or migration) parameter to be estimated, and the spatial and temporal scales over which each method is pertinent and its estimates reliable. The applicability of these methods to three sampling strategies commonly deployed in marine population genetic studies is summarized in Box 2. Below, we briefly describe their broad properties rather than providing an exhaustive catalog, highlighting why both types of dispersal inference methods may be limited in their application for many marine species.
Box 1: What is the right FST estimator in high gene flow species?
Since the advent of multi-allelic loci in population genetics, it has been pointed out that the maximum value taken by Wright's FST at a given locus is bounded by its level of genetic diversity so that Fmax ≤ 1 − HS, where HS is the average within-sample diversity (reviewed in Meirmans and Hedrick 2011). Various methods (i.e. estimators aimed at scaling the maximum possible value to 1) have been proposed to correct what is perceived under certain circumstances as a bias, or even a drawback for measuring allelic differentiation between populations (Jost 2008). In the case of bi-allelic loci, all measures (e.g. D, F', G, θ; see definitions in Meirmans and Hedrick 2011) give the same equilibrium estimation as Wright's FST, which can be transformed into migration rate at migration–drift equilibrium. However, the problem becomes more complex when more than two allelic states occur, and one wishes to take mutation and homoplasy into account. In the island model, 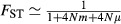 , so the relative role of mutation and migration becomes a key issue. In the case of high gene flow species, it is generally admitted that μ ≪ m. Hence, the main criticism against the use of FST (i.e. m = 0, μ > 0, which produces a multi-allelic FST estimate tending toward 0 with time despite maximal differentiation and the absence of gene flow) is not justified in such species. On the contrary, m ≫ μ would imply that the variation detected in one deme is mostly replenished by migration from the metapopulation rather than by locally arisen mutations. Under this assumption, the small differentiation generally observed in most marine species would not be an artifact of using multi-allelic markers, but the consequence of high migration. This has two consequences for our interpretation of genetic variation in high gene flow species: (i) homoplasy is likely to play a very limited role because homoplastic alleles will be almost equally distributed throughout the metapopulation by migration, (ii) high heterozygosity values reflect large metapopulation effective size rather than locally high population size, a pattern that remains true even with relatively low migration between populations.
Box 2: Neutral methods to infer genetic connectivity
(A) The distribution of dispersal distances can be estimated in two ways: through the direct detection of discrete dispersal events (blue bars), or the indirect estimation of dispersal parameters like the standard deviation of parent–offspring dispersal distances (σ). The mean dispersal distance (μ) can be obtained from σ by assuming a normal distribution of dispersal distance (blue line). (B) The three sampling strategies commonly used in marine population genetic studies: 1. A geographically subdivided species range is discretely sampled, but some populations are not sampled (gray dotted circle); 2. A continuously distributed species is sampled discretely, and the geographic distance between samples is of the same order as σ; 3. Continuous sampling of individuals separated by distances of the same order as σ. Colored points are sampled individuals, gray points indicate nonsampled individuals. (C) The information about dispersal that can be obtained from indirect and direct methods for each sampling strategy.
Inferring genetic connectivity using indirect methods
A representative example of indirect methods is the estimation of dispersal from IBD patterns. The IBD model can be used to estimate dispersal from the increase in genetic differentiation with increasing geographic distances between populations (Rousset 1997) or individuals (Rousset 2000) when dispersal is spatially limited (Box 2). Another example is the estimation of the absolute number of migrants per generation (Nem) from FST in the island model (Wright 1951). Other indirect methods include estimators of Nem or m under various extensions of the island model or other more refined population structures (Broquet and Petit 2009). All these methods are associated with a number of generally strong assumptions regarding the structure of populations (e.g. constant and equal size of demes, homogeneous migration, and population density), the life cycle of the species (e.g. nonoverlapping generations, identification of pre- and postdispersal stages and random mating within demes), and the role of each evolutionary force (e.g. negligible effect of selection and negligible or known mutation rate). Model-based methods share at least two important properties. First, a measure of genetic structure never easily translates into an estimate of migration rate (Whitlock and McCauley 1999; Marko and Hart 2011). In particular, a low FST does not necessarily mean that migration is strong as genetic differentiation is influenced by both effective size (Ne) and migration rate (m) (Fig. 1). For instance, little dispersal is required to limit the global differentiation in an island model or a stepping-stone migration model (Rousset 2004; and for a recent empirical example: Puebla et al. 2012). Second, dispersal estimates often depend on other known parameters relevant to other evolutionary forces. For instance, the effect of genetic drift must be estimated independently (usually using density estimates) to infer dispersal under the isolation-by-distance model (Pinsky et al. 2010). The main advantage of model-based inference methods is that they require a small amount of data (for the less demanding methods, say about 10 sampling sites with 20 individuals per site). These methods produce estimates of migration rates (m) or moments of the distribution of dispersal distances (such as σ, the standard deviation of axial dispersal distances, Box 2) which can be difficult to interpret in an ecological context. Finally, such estimates, which have the merit of integrating the effects of evolutionary forces over longer time scales than direct approaches, rely on the questionable hypotheses that dispersal is stable over time and that the migration–drift equilibrium has been reached.
Indirect methods have been applied in a series of case studies in marine organisms. For instance, keeping IBD as a typical example of model-based inference, empirical estimates of σ have been reported for a variety of species (Rose et al. 2006; Puebla et al. 2009, 2012; Ledoux et al. 2010; Pinsky et al. 2010). However, such indirect approaches of dispersal can fail on two grounds. First, if genetic drift is too weak to generate population differentiation, then dispersal cannot be inferred using a model that relies on the migration/drift balance. This problem is often encountered in species with extremely large population sizes, such as many marine fishes and invertebrates (DeWoody and Avise 2000; McCusker and Bentzen 2010). For instance, there is no detectable genetic differentiation among populations of the California sea mussel Mytilus californianus across 4000 km of its distribution range (Addison et al. 2008). Second, species with large effective population sizes may show patterns of genetic structure that are not at mutation–migration–drift equilibrium. Indirect estimators of dispersal are based on different statistics that evolve at their own speed. Therefore, the rate of approach of equilibrium for a given estimator has to be evaluated to determine whether or not equilibrium is a strong assumption in particular case studies. For that reason, the uncertainty of indirect dispersal estimates due to a possible departure from equilibrium is generally unknown (Pogson et al. 2001).
Direct estimates of genetic connectivity
In contrast with indirect approaches, the direct detection of migrants through parentage analysis or individual assignment makes much fewer assumptions. For instance, population or parentage assignment methods allow estimating dispersal rates or distances without necessarily relying on demo-genetic models. On the downside, these approaches generally require a great deal of data, very good knowledge of the species distribution, and make the sampling design critical as it must be representative of the postdispersal distribution of individuals (evaluation of long-distance dispersal might be especially difficult due to constraints in the size of the study area). In the case of parentage analysis, an additional constraint stems from the necessity to sample a large fraction of the potential parents. Assignment methods specifically applied to detect immigrants without identifying their origin require less extensive sampling, but their efficiency reduces quickly with decreasing genetic differentiation (but see Gaggiotti et al. 2002). Parental assignments or first-generation migrant tracking methods provide measures of dispersal distances that are relevant to the dispersal episode preceding sampling. Moreover, these methods yield estimates of individual movement rather than gene flow, as immigrants may or may not reproduce locally following dispersal. Finally, although interpreting the results produced by these methods is generally more intuitive than those of indirect approaches, care must be taken regarding the effect of type I errors (i.e. incorrectly identifying a local individual as an immigrant) and unsampled putative parents or source populations (Paetkau et al. 2004; Waples and Gaggiotti 2006). For example, even with high statistical power (no type II error), accepting a 5% type I error for detecting migrants can spuriously increase the estimate of migration rate.
Direct methods have been successfully applied to some marine species. For instance, genetic assignment has yielded useful dispersal information in seals (Gaggiotti et al. 2002), reef fish (Saenz-Agudelo et al. 2011), and corals (Underwood et al. 2007). Similarly, parentage assignment has proven efficient in a number of case studies focusing especially on reef fishes (Jones et al. 2005; Planes et al. 2009; Christie et al. 2010; Almany et al. 2013). Besides a minute type I error, the success of such studies relies upon the fraction of potential source populations or parents that are sampled. These approaches thus require a high-density sampling at a relevant geographic scale, and their application in the marine environment is therefore limited to species with population sizes and distribution ranges that are well documented and small enough for such sampling to be realistic. Although recent studies have shown that larval dispersal oftentimes occurs over smaller spatial scales than previously believed (Swearer et al. 2002; Almany et al. 2007; van der Meer et al. 2012; Puebla et al. 2012), many marine species typically have high fecundity rates, large distribution ranges, and population size (Palumbi 1994). These methods are thus inapplicable to the majority of marine animal species (from invertebrates to pelagic fishes) that have medium to large population sizes, elusive population contours and for which only a minute fraction of the individuals can be sampled for genetic studies.
Investigating genetic connectivity with clustering methods
When the study species is subdivided into discrete populations, there is a need to first determine the number of populations before evaluating gene flow (Waples 1998). Clustering methods which detect genetic discontinuities and limits to gene flow have been proposed as a way to identify both populations (stocks) and migrants (Pritchard et al. 2000; Broquet et al. 2009). The different clustering approaches (Pritchard et al. 2000; Corander et al. 2003) have their own limits, such as departures from the underlying models (François and Durand 2010). In particular, patterns of isolation by distance may lead to artificial clustering (Schwartz and McKelvey 2009; Blair et al. 2012; Aurelle and Ledoux 2013), and peculiar reproductive systems like partial selfing can induce spurious admixture patterns (Gao et al. 2007). The power of clustering methods generally increases with the amount of genetic differentiation among populations (Latch et al. 2006). For that reason, they are mostly suited to infer genetic connectivity in species with intrinsically or behaviorally limited dispersal abilities and relatively small local population sizes (Ledoux et al. 2010; Wilson and Eigenmann Veraguth 2010; Mokhtar-Jamaï et al. 2011; Perrier et al. 2011; Ansmann et al. 2012; Lukoschek and Shine 2012), which are not representative of the majority of marine species.
Population genomics using neutral markers for marine connectivity studies: what way forward?
Estimating connectivity from genetic data is a challenging task, which is made even more difficult by the particular life history traits and demographic characteristics of many marine species. More markers may enhance the statistical power of genetic studies and yield more precise estimates of small genetic differentiation values (Patterson et al. 2006), but the signature of dispersal contained in the data may remain intrinsically small or inexistent. In particular, it is not clear whether increasing the number of loci will help in situations where large effective population size keeps genetic structure down, even with restricted migration. As the number of markers rapidly increases, the nonindependence of loci in large population genomic datasets is also becoming another important issue which requires further investigation (Waples 2015).
Despite well-recognized limitations, there is still a good hope that population genomic datasets will improve the usefulness of indirect methods by increasing the power and precision of small genetic differentiation estimates. Although fairly robust estimates of dispersal were already obtained from IBD patterns among populations or discrete geographic samples using tens of markers, greater improvement is expected for methods based on genetic differentiation between individuals (Rousset 2000). This should be achieved through a more accurate estimation of pairwise genetic differentiation between individuals, just like population genomic datasets have improved the inference of relatedness between pairs of individuals for heritability estimation (Visscher et al. 2008). Because the power of isolation-by-distance regression scales with the number of observed pairwise geographic and genetic distances, a continuous sampling of individuals separated by distances in the order of σ (Rousset 2000) may be preferable to a discrete sampling of groups of individuals (Box 2).
Analyzing thousands of markers should also increase the power of direct methods, although the type I error issue underlined above is unlikely to be fully resolved even with high power, and sampling requirements cannot be alleviated by intensifying the genetic coverage of each individual. On the other hand, population genomic datasets may also contain useful information on migration events that trace back to several generations in the past. Therefore, extending direct estimates of dispersal beyond the identification of parent–offspring or sibling relationships seems appealing. This should encourage the development of methods that take the full spectrum of relatedness into account.
Whether large datasets will significantly improve the ability of clustering methods to detect existing structure when genetic differentiation is small remains to be tested with recent programs that have been specifically developed for rapidly processing population genomic data (Popescu et al. 2014; Raj et al. 2014). The use of principal component analysis (PCA) methods already proved useful for detecting fine-scale structure between human populations exhibiting low levels of genetic differentiation (Patterson et al. 2006; Novembre et al. 2008). This type of analysis may benefit from the informativeness of rare variants to detect fine-scale population structures (O'Connor et al. 2014), especially in the case of large populations that only exchange few migrants per generation.
Genome-wide polymorphism data that contain information about haplotype phase may open other interesting possibilities for studying connectivity. Immigration followed by successive rounds of sexual reproduction with local residents produces individuals with mixed genetic ancestry. Across generations, the original immigrant chromosomes are progressively broken down by recombination, so that the genome of admixed individuals is composed by a mosaic of segments originating from different ancestral populations (Gompert and Buerkle 2013). The length distribution of such admixture tracts (also called migrant tracts) can be used to infer migration rates between populations (Pool and Nielsen 2009; Gravel 2012). In practice, this approach requires that the ancestry of admixture tracts can be accurately inferred, and this might be possible only when admixture stems from divergent populations. A related approach is based on the analysis of identical genomic segments that are inherited by pairs of individuals. The genomic proportions of long segments that are identical by descent between individuals from the same or different populations are directly related with migration rate (Palamara and Pe'er 2013). Referred to as ‘haplotype sharing’, this approach may be better suited to infer relatively recent migration between populations, although so far it has only been tested using high marker density datasets in species with a high-quality reference genome. These methods are currently under development (Gravel 2012; Liang and Nielsen 2014) and need to be evaluated for their potential to estimate migration in nonmodel species with weakly structured populations contemporarily exchanging migrants. Below, we develop another avenue of research that takes advantage of large population genomic datasets by focusing on genetic markers affected by selection.
Using selected and hitchhiker loci as an alternative approach to infer marine connectivity
As developed above, the approaches to infer demographic parameters from genetic data classically rely on neutral models that assume a balance between migration and genetic drift (Whitlock and McCauley 1999). As in large populations the effect of drift is very weak, even the most sophisticated methods based on this balance may lack power to infer migration, not to mention that disentangling the effects of Ne and m it is very difficult under these models (Waples 1998; Fig. 1). Alternatively, selection can act as a more efficient antagonistic evolutionary force than drift to counteract the homogenizing effect of migration (Lenormand et al. 1998). As the efficiency of selection scales up with population size, the counterbalancing effect of directional or divergent selection is expected to be greater in marine species with large population sizes (Allendorf et al. 2010). The detection of selected genes has long been a challenging prerequisite, but large marker datasets have considerably enhanced the power of genome scans to identify loci with extreme levels of differentiation (Stapley et al. 2010), the so-called ‘FST outliers’ supposed to be directly or, more probably, indirectly affected by selection (Luikart et al. 2003; Storz 2005). Recent conservation genetic studies have proposed to delineate locally adapted units based on the signal held by outlier loci (Funk et al. 2012; Nielsen et al. 2012), but without providing means to explicitly assess connectivity between such units. Before providing further guidance for using selected markers to infer the rate and scale of dispersal, we consider some of the problems that specifically arise with this category of markers.
Important concerns related to outlier detection
A common issue encountered in population genomic studies is that the different methods that can be used for identifying FST outliers usually detect only partially overlapping sets of loci. These inconsistencies across methods partly reflect the influence of unknown genetic structure and demographic history on outlier detection tests (for recent reviews, see Narum and Hess 2011; De Mita et al. 2013; De Villemereuil et al. 2014; Lotterhos and Whitlock 2014). In particular, the most commonly used methods for detecting FST outliers have a high rate of false-positive detection under nonequilibrium scenarios (Fraïsse et al. 2014; Lotterhos and Whitlock 2014), hierarchical population genetic structure (Excoffier et al. 2009), and IBD patterns (Meirmans 2012; Fourcade et al. 2013), while suffering at the same time from limited sensitivity (false-negative detection). To circumvent these problems, combining differentiation-based methods with genotype–environment association tests was suggested as a more reliable outlier identification approach (De Villemereuil et al. 2014). In addition, new methods have been developed that are expected to account for correlated ancestry among samples (Excoffier et al. 2009; Bonhomme et al. 2010; Duforet-Frebourg et al. 2014; Foll et al. 2014). However, even if FST outlier tests perform rather well when selection acts on few loci with large effects, they are more seriously challenged by selection acting on many small-effect loci or when the marker loci are loosely linked to the target loci. Because adaptation involving quantitative traits most often evolves through polygenic selection (Pritchard and Di Rienzo 2010), the small changes in allele frequencies resulting from polygenic adaptation may remain below the detection limit of most outlier detection methods (Le Corre and Kremer 2012). In light of recent simulation-based studies that have investigated the performance of outlier tests, it thus appears that outlier candidates should be submitted to validation by combining different statistical approaches, or more directly by comparing allele frequencies before (e.g. in the larval pool) and after (e.g. in juveniles or adults) selective mortality whenever possible (Gagnaire et al. 2012).
An important question that stems from acknowledging the limited power to detect polygenic selection is how to treat the signal held by the most differentiated selected loci, which may have a long, complex, and unanticipated history of divergence, when many others remain undetectable? Apart from the fact that undetected selected loci are expected to bias the neutral-based estimations of connectivity described above, these loci may be more informative than neutral loci for delineating genetic clusters, even if polygenic selection produces small allele frequency changes. Principal component-based analyses combining neutral and selected loci may thus be used as a naive approach to test whether genetic variation is continuously distributed in space, or partitioned into discrete genetic clusters to which individuals can be assigned to estimate the rate and scale of dispersal. Because many species probably match the polygenic selection model, this approach may be appropriate to improve the delineation of discrete genetic clusters in study systems where neutral marker datasets have been uninformative. However, the gain of power offered by large population genomic datasets is difficult to predict and requires further examination using simulated data under different dispersal scenarios.
Another concern when reliable outlier candidates can be identified relates to the nature of the selective effects behind their detection. Several selective mechanisms can increase genetic differentiation above the genome-wide average (Bierne et al. 2013), including underdominance, local and background selection (Charlesworth et al. 1997), but also convergent evolution in response to uniform selection (Ralph and Coop 2010). Importantly, each type of selection can affect neutral loci through linkage, which means that outlier loci could most often result from the indirect effect of selection at other loci. The pervasive effect of selection at linked sites has been well documented in Drosophila (e.g. Langley et al. 2012). In such species with large population effective sizes, background selection (Charlesworth et al. 1993) and genetic hitchhiking (Maynard Smith and Haigh 1974) can easily generate correlation between local recombination rates and genetic diversity. Such a correlation has been recently described in the stickleback (Roesti et al. 2012) and the European sea bass (Tine et al. 2014), which confirms that selection at linked sites can also have a dominant effect on genetic diversity in marine species.
In the next sections, we consider geographic patterns generated under various types of selection and provide a guide to infer genetic connectivity using existing and newly developed theoretical frameworks. Applied in local areas with environmental and hydrological singularities, some of these approaches will provide quantitative estimates of dispersal. In other cases, where the effects of selection are less well resolved, genomic data will be helpful to detect genetic discontinuities and provide qualitative assessment of connectivity.
Estimating dispersal distances using genetic clines
Genome scan studies in marine species have reported several empirical examples of outlier loci exhibiting clinal variation patterns, usually coinciding in space with environmental gradients, ecotones, or boundaries between biogeographic regions (Murray and Hare 2006; Bradbury et al. 2010; Colbeck et al. 2011; Gagnaire et al. 2011; Lamichhaney et al. 2012; Limborg et al. 2012). It is well established that selected markers analyzed in light of cline theory can provide robust estimates of dispersal distances (Barton and Gale 1993; Lenormand et al. 1998; Sotka and Palumbi 2006). Cline shape is basically determined by a balance between migration and selection, which allows under quasi-equilibrium conditions to derive the dispersal parameter in the geographic region of the cline. Empirically inferred dispersal distances may not be precise when only one locus is available and when linkage disequilibrium between selected loci is unknown, but even then they should be of the right order of magnitude (Sotka and Palumbi 2006). Population genomic studies have now the power to detect loci exhibiting clinal variation in species previously believed to be genetically homogeneous, so the potential for discovering new cases of local adaptation clines and cryptic hybrid zones is high (Bierne et al. 2011).
Using local adaptation clines to infer dispersal
We refer to local adaptation clines as monogenic clinal variation patterns maintained by a balance between the divergent effects of selection and the homogenizing effects of migration. Such clines occur along environmental gradients or at the frontier between habitats when alternative alleles have antagonistic fitness effects in different environmental conditions (Powers and Place 1978; Koehn et al. 1980). Allele frequencies vary as a sigmoid function of geographic distance (Box 3A) without necessarily reaching fixation if selection cannot purge the inflow of maladapted genotypes (Slatkin 1973). Local adaptation clines can be used to estimate dispersal distance (σ) if the selection coefficient (s) can be measured, which actually represents a serious challenge to most case studies. However, a measure of selection can sometimes be obtained using experimental populations or genotype frequency comparisons between larvae and adults sampled from the same cohort. By contrast, inferring dispersal from a neutral hitchhiker locus only requires the recombination rate with the selected locus (Box 3A). This can be more readily obtained by studying the signature left by selection in the chromosomal neighborhood of individual outlier loci. For instance, resequencing the region around outliers may help to determine which polymorphism is actually under selection (i.e. the one showing the highest FST value, surrounded by decreasing differentiation on both sides; Box 3A) and provides data to estimate local recombination rates around the selected locus without needing a recombination map (Stumpf and McVean 2003). The chromosomal signature left by local selection in high gene flow species is usually limited to very narrow regions, even when selection acts on de novo mutations (Fig. 2). Therefore, high-density genome scans are usually required for efficiently detecting local adaptation loci.
Box 3: Using selected and hitchhiker loci to infer genetic connectivity
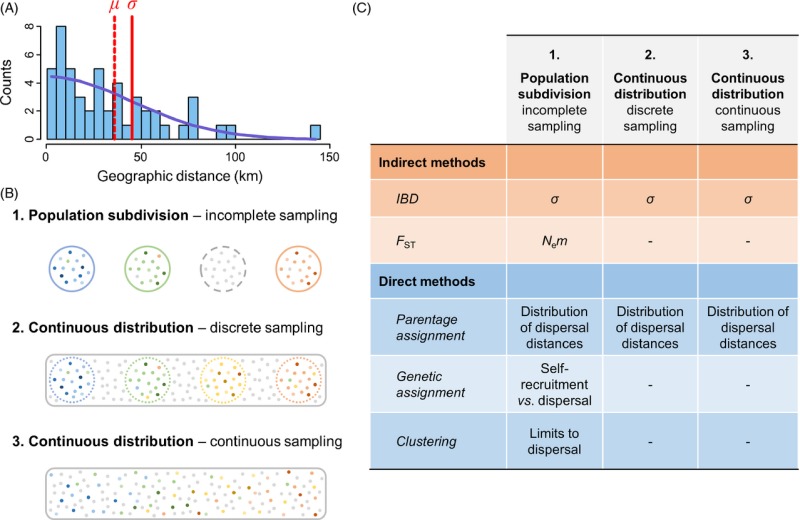
Plots show the chromosomal and geographic signatures of selection under four different selective processes. Selected and neutral loci are colored in red and green, respectively. Genetic differentiation (FST) along the chromosome is measured between spatial coordinates −500 and 500. (A) A local adaptation cline lying at the frontier between two environments where selection acts in opposite directions (s = 0.1, σ = 30). The cline width parameter (w) is defined as the inverse of the maximum slope at the cline center, and k is a coefficient that depends on the selection regime (Slatkin 1973; Nagylaki 1975; Endler 1977; Barton and Gale 1993; Kruuk et al. 1999). A neutral hitchhiker locus with a recombination rate r with the selected locus makes a shift (Δp) in the central region of the cline, and an external gradient of allele frequency (∂p/∂x) directly outside the cline (Barton 1979b). (B) Hybrid zone cline between two partially reproductively isolated populations with selection acting against hybrid genotypes (s = 0.5). The amount of linkage disequilibrium (D) between selected loci is measured after dispersal at the center of the overlapping clines. (C) A tail of introgression produced by the inflow of foreign alleles entering a subdivided population (see Fig 3 for details). (D) Local connectivity patterns revealed by a global sweep. An unconditionally favorable mutation (s = 0.05) appears on the left side of a chain of demes (at an initial frequency of 1/2Ne) and then propagates to the right side from deme to deme (m = 0.01), leaving behind a complex allele frequency pattern at a neutral hitchhiking locus (r = 0.001). Local connectivity between adjacent demes is transiently revealed by the structure of the neutral hitchhiking locus, as long as gene flow re-homogenizes allele frequencies. The chromosomal signatures of selection can take the form of narrow regions of differentiation (A), large genomic islands (B), or shoulders of differentiation (C and D) centered on the selected loci.
Figure 2.
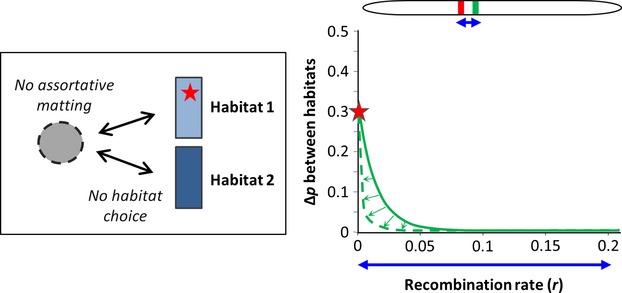
The chromosomal signature of local selection acting on a de novo mutation in panmixia. We consider a two habitats Levene's model (Levene 1953) represented in the left box, with random mating (in the dotted circle) and random dispersal (arrows) across two habitats of equal size (rectangles). A new selected mutation (allele a, red star) appears in habitat 1 on a haplotype bearing rare neutral variants (in green) at variable recombination distances (the initial frequency is 1/2Ne). The selected mutation has symmetrical antagonistic effects on the fitness of genotypes with respect to habitat (Habitat 1: ωAA/ωAa = 0.5, ωaa/ωAa = 2; Habitat 2: ωAA/ωAa = 2, ωaa/ωAa = 0.5). At equilibrium, varying selection among genotypes and habitats results in differentiation between habitats at the selected locus (in this example Δp ≈ 0.3). During the progress toward equilibrium, neutral variants hitchhike with the selected allele, transiently producing a narrow chromosomal region where genetic differentiation is increased around the selected locus (green line). As the selected allele progressively recombines away from its haplotypic background, differentiation at neutral alleles rapidly vanishes (green arrows). After a few thousands of generations, differentiation is almost limited to the selected locus (dashed green line).
As with parentage assignment methods, the dispersal parameter estimated from local adaptation clines is mostly relevant over short time scales in the geographic area where the shift in allele frequency is observed. However, discordant clines arising in distinct locations in response to spatially uncorrelated selective factors should provide independent local estimates of dispersal across a species range. Local adaptation clines might thus offer valuable alternatives to estimate migration in high gene flow marine species, keeping in mind that the underlying models assume that each cline evolves independently. Therefore, caution must be taken in distinguishing oligogenic from highly polygenic clines. For instance, a high-density genome scan in Drosophila melanogaster revealed the existence of several latitudinal clines (Fabian et al. 2012) that geographically overlap with classical clines attributed to local adaptation (e.g. the Adh locus, Berry and Kreitman 1993). As for Drosophila (Bergland et al. 2015), some classical clines found in marine organisms, such as the Ldh cline in the killifish Fundulus heteroclitus (Powers and Place 1978), turned out to occur in secondary contact zones (Durand et al. 2009). This suggests that some of the few clinal outliers that were detected trough candidate gene or low-density genome scans may only reflect the emerged part of the iceberg and that polygenic clines and cryptic hybrid zones coinciding with environmental boundaries may be more common than usually believed (Bierne et al. 2011). When significant linkage disequilibrium is detected among clines, the hybrid zone theory offers a more appropriate framework to infer dispersal.
Using hybrid zone clines to infer dispersal
Many clines evidenced in marine population genetics studies actually result from selection acting at multiple loci, as revealed by the finding of concordant clines in contact zones between hybridizing taxa, that is hybrid zones (Duggins et al. 1995; Bierne et al. 2003; Sotka et al. 2004; Murray and Hare 2006; Zbawicka et al. 2014). In such clines, each locus cumulates the indirect selective effects from other loci (transmitted through linkage disequilibrium) in addition to its own selection coefficient (Barton 1983; Kruuk et al. 1999). The magnitude of indirect effects depends on the amount of linkage disequilibrium and therefore on selection, recombination, and dispersal. The associations among selected alleles in hybrid zones can be used in combination with cline width to infer dispersal (Box 3B, Barton and Gale 1993). As for single locus clines, outlier loci showing concordant clines are not necessarily the actual targets of selection but more likely neutral loci presenting various degrees of linkage with the genes involved in the barrier. Therefore, the shift in allele frequency in the central region of the cline is often much less than 1 for neutral markers, and linkage disequilibrium needs to be corrected for the effect of introgression to estimate dispersal distance (Box 3B).
The cumulative effects of direct selection and indirect selection acting on other loci produce a typical cline shape characterized by a central sigmoid step with two exponential tails of introgression on either side (Barton 1983; Barton and Gale 1993). Allele frequency data collected across a hybrid zone transect can be used to fit a model of cline shape and estimate its parameters, including cline center and width within the narrow region of abrupt change (Szymura and Barton 1986). Hybrid zones analysis programs like HZAR provide useful functions for fitting clines along geographic transects (Derryberry et al. 2014).
Genetic tagging in hybrid zones
A conceptually different approach to estimating connectivity in contact zones is to perform individual genetic assignments to identify migrants. This approach which is similar to the one detailed in the above section (i.e. direct estimates of genetic connectivity) takes advantage of the substantial genetic differences existing between populations or species that are on both sides of the hybrid zone. Minimal dispersal distances can be obtained through the identification of parental genotypes that crossed a hybrid zone and successfully settled in a foreign parental population or species. An even more precise estimation of larval dispersal distance can be made when the source of dispersing larvae is known, as for first-generation hybrids dispersing outside a hybrid zone. Using this strategy, patterns of larval movement among neighboring patches of blue mussels have been examined by measuring realized larval dispersal based on the genetic identification of recently settled juveniles (Gilg and Hilbish 2003). This approach provides an interesting alternative to the measures of dispersal offered by the analysis of genetic clines. In the blue mussel example, both approaches provide comparable estimates: Gilg and Hilbish (2003) found a dispersal distance of 30 km which is in accordance with the 38 km width of the LAP cline in Long Island (Lassen and Turano 1978) and the 52 km width of the cline between M. edulis and M. trossulus in the Oresund (Väinölä and Hvilsom 1991). Because genetic tagging relies on a clear distinction between parental genotypes, introgressed individuals, and real hybrids, individual assignments should be done using the most highly differentiated (and preferentially diagnostic) markers identified in genome scans.
Using introgression tails to reveal cryptic population structure
Previous methods based on cline width analysis are constrained in their application by the geographic localization of cline centers. However, estimates of population connectivity are often required outside these singular regions, for instance when it is necessary to determine whether there is limited dispersal between populations within areas delimited by ecological or biogeographic boundaries, a relatively common concern for conservation and stock management issues (Allendorf et al. 2010). A potential solution, when the migration–drift equilibrium is not informative, is to search for evidence of spatial structure revealed by introgression (Gagnaire et al. 2011). Introgression may generate gradients (or steps) in allele frequencies along a geographic axis originating at the edge of a contact zone. These tails of introgression may extend to large distances beyond cline centers and can arise for several reasons.
The first one is the free diffusion of neutral alleles following secondary contact between two genetically differentiated populations, or two partially reproductively isolated species. This process creates a transient gradient of introgressing alleles if the rate of introgression is higher or equal to the rate of homogenization within the introgressed population (i.e. the introgression/homogenization rate ratio is ≥1). Importantly, the gradient only appears if dispersal is spatially limited, otherwise spatial homogenization occurs immediately as foreign alleles enter the introgressed population. In order to illustrate how this mechanism can be used to detect a local barrier to dispersal, we simulated a contact zone between two partially reproductively isolated species and the introgression of foreign alleles within one of the two species which is geographically subdivided (Fig. 3). The extent of genetic differentiation within the introgressed species was measured between two populations separated by a weak barrier to gene flow (m = 0.01), other adjacent demes being otherwise highly connected in the standard linear stepping-stone model. During a few thousands of generations postcontact, introgression generates a step in allele frequency between the two populations of the introgressed species, and the step then disappears as allele frequencies equilibrate between species (the black dashed line Fig. 3A). Two important properties emerge from these simulations. As the introgression/homogenization rate ratio approaches 1, the magnitude of the frequency step decreases, but the maximum step magnitude is reached later and the step lasts longer. A direct application of these properties is that variable introgression rates among loci provide with the means to detect a weak barrier to gene flow even when introgression has started thousands of generations in the past. For instance, a snapshot taken after 10 000 generations of introgression shows that while the step has completely vanished at freely recombining neutral loci, neutral loci in partial linkage with reproductive isolation loci have retained the signal of differentiation between populations due to their reduced effective migration rate (Fig. 3B). Therefore, differential introgression between parapatric species can be used as a powerful tool to detect cryptic population structure outside the contact zone.
Figure 3.

Using the inflow of foreign alleles to reveal within-species connectivity patterns. At generation zero, two partially reproductively isolated species meet on a linear stepping-stone model between demes 10 and 11 and start to exchange genes. The auto-recruitment rate is 1 − m, and migration to adjacent demes is m/2 (with m = 0.5). A weak barrier to gene flow (m = 0.01) was set between demes 20 and 21, in the middle of the range of the species localized on the right side. Strong selection (s = 0.5) acts against heterozygote genotypes at a reproductive isolation locus, which is linked to neutral markers located at variable recombination distances (from closely linked to unlinked). A recombination rate of 1 cM per Mb was used to convert genetic into physical distances. (A) The step size, calculated as the difference in allele frequency between demes 20 and 21 (Δp), as a function of the number of generations postcontact. (B) Spatial allele frequency patterns after 10 000 generations of introgression showing the frequency step between demes 20 and 21. (C) The step size between demes 20 and 21 as a function of the physical distance to the reproductive isolation locus. (D) The step size between demes 20 and 21 as a function of the difference in allele frequency between species.
Tails of introgression may be also influenced by selection acting outside the tension zone. In this case, the gradient of allele frequency within the range of the introgressed species may be steepened by a gradient of selection (e.g. an environmental gradient). Because secondary contact zones commonly coincide with environmental gradients (Bierne et al. 2011), introgression tails may be commonly encountered within biogeographic regions separated by environmental boundaries (e.g. the Baltic Sea).
These mechanisms show how much it is important to sample not only the whole distribution range of a species but also other divergent populations, or closely related species that live in parapatry or in sympatry before interpreting spatial genetic variation patterns (Gagnaire et al. 2011; Cullingham et al. 2013; Gosset and Bierne 2013). Now that NGS tools begin to reveal genomic islands of differentiation between cryptic species that were previously considered as populations of the same species (Hemmer-Hansen et al. 2013; Karlsen et al. 2013; Tine et al. 2014), polymorphisms located in the periphery of these islands may become a powerful new type of markers to infer connectivity within species, as illustrated in Fig. 4. Importantly, the spatial range of application of genomic-island associated loci could be large if markers are taken at various recombination distances from the central region of a genomic island of differentiation.
Figure 4.
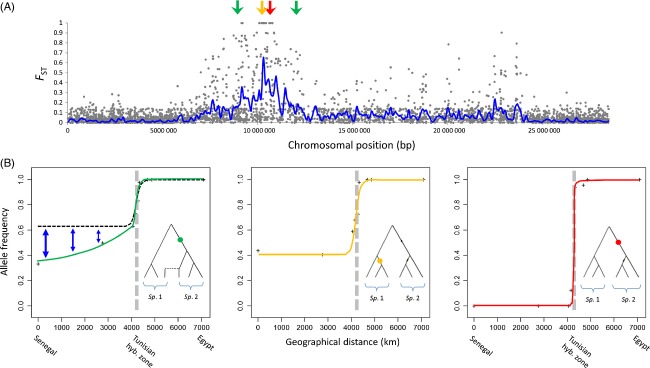
Genomic islands of differentiation and the information therein. (A) A genomic island of differentiation between Atlantic and Mediterranean sea bass lineages (Dicentrarchus labrax) on chromosome 7 (RAD-sequencing data from Tine et al. 2014). (B) Geographic clines between two partially reproductively isolated species of sole, Solea senegalensis (Sp. 1, left side) and Solea aegyptiaca (Sp. 2, right side) assessed by RAD-Sequencing (A. Souissi, P.-A. Gagnaire, L. Bahri-Sfar, F. Bonhomme, unpublished). Red and orange clines correspond to expectations near reproductive isolation loci (i.e. at the center of a genomic island, where there is no introgression), for a diagnostic locus (red) and a locus only polymorphic in S. senegalensis (orange) due to incomplete lineage sorting. The green cline shows a gradient (or a tail) of introgression due to the inflow of S. aegyptiaca alleles in the S. senegalensis background. At this locus, the shared allele is a consequence of secondary introgression instead of incomplete lineage sorting. Such gradients of introgression are expected to be found at loci showing intermediate degrees of linkage with reproductive isolation loci (i.e. located in the periphery of a genomic island, where introgression is reduced but not zero). Introgression tails may be used to reveal cryptic genetic structure where freely recombining neutral loci remain uninformative (black dashed line), as it is the case in S. senegalensis.
Hitchhiking clines
Another scenario that generates outlier loci happens during the spread of an unconditionally favorable allele in a spatially subdivided population. This process leaves a transient footprint at neutral markers in the chromosomal vicinity of the sweeping allele. When the overall genomic differentiation is low, as it is typically the case in marine species, this process generates an elevated level of differentiation on both sides of the selected locus (Bierne 2010), which corresponds to the locations of sweep shoulders (Schrider et al. 2015). The reason is that recombination progressively breaks the association between the selected locus and the hitchhiker neutral locus, while the sweeping wave propagates. Therefore, the hitchhiking effect is strong at the birthplace of the favorable mutation, while it progressively softens as the wave travels. The effect is stronger for intermediate recombination rates between the selected and the hitchhiker neutral locus, because when linkage is tight, associations remain during the spread of the wave while when linkage is loose the hitchhiking effect is weak right from the beginning. For a similar reason as for the case of introgression clines (Fig. 3C), global hitchhiking therefore generates two shoulders of differentiation on each side of the selected locus on the chromosome. In the deterministic model, the spatial structure generated is a gradient in allele frequency called ‘hitchhiking cline’, but when stochasticity is introduced, for example random genetic drift, the spatial structure can be more complex and sometimes results in nonmonotonic variations in allele frequency (a patchy genetic structure as shown in Box 3D). Detecting the genomic signature of a global sweep requires a high-density screening of the genetic differentiation in the chromosomal neighborhood of the selected locus. Therefore, only few examples that fit the predictions have been studied, with only two cases in marine species (in the blue mussel, Bierne 2010; and the stickleback, Roesti et al. 2014), and some possible cases in highly polymorphic terrestrial species such as maize (Gore et al. 2009; Bierne 2010) and nematodes (Jovelin et al. 2014). By adjusting the global hitchhiking model to the mussel data, it has been possible to estimate the minimal migration rate needed to obtain the observed FST value between the two geographically distant populations of M. edulis (Faure et al. 2008) which proved to be surprisingly low (m < 10−8), as well as the position of the selected locus (−3 kb 5′ of the start codon of the EF1α gene), the selection coefficient (s = 0.01), and incidentally the local recombination rate of the chromosomal region (ρ = 1.7 cM/Mb, Bierne 2010). This result nicely closes the loop of our argumentation by showing how two populations of mussels that are demographically largely independent for thousands of years do not depart from apparent genetic panmixia. Recent analysis based on NGS data (Fraïsse et al. 2015) revealed that deep sampling of the neutral fraction of the genome does not reveal a clear genetic structure between the two populations and that local adaptation is either extremely rare or extremely difficult to evidence (Gosset et al. 2014). Only the indirect effect of selection transiently generated at a linked neutral hitchhiker locus has revealed a sufficiently clear pattern to demonstrate demographic independence.
Conclusion
Substantial progresses in our understanding of connectivity in nonmodel organism can be achieved with large population genomic datasets. High-density genome scans have reached the power to detect outlying patterns of genetic differentiation at different spatial scales, enabling conservation geneticists to identify genetic differences reflecting restriction to gene flow where classical neutral markers were hitherto most often largely uninformative, as in high gene flow species. The scope of the applications of outlier loci for assessing connectivity patterns in marine species needs further investigations, in particular through gathering a larger set of empirical data. Some of the methodologies that were proposed in this review are still underexplored, and we hope that our work will stimulate new research to test how broadly they are applicable to nonmodel marine species. Although spatially explicit methods are directly applicable to continuously distributed sessile species, selected and hitchhiker loci also have the potential to reveal cryptic genetic structure in migratory species with natal homing (Gagnaire et al. 2011) or feeding migrations. A growing question will be to determine whether all the genetic differences revealed by outlier loci are relevant for conservation and species management. Genome scans will probably confirm the picture of major biogeographic boundaries as hotspots of cryptic genetic structure between populations and partially reproductively isolated species pairs. They may also reveal new and unexpected barriers to gene flow. Such zones are likely to delineate stocks and populations that are important from a conservation point of view. Besides, genome scans may also reveal unusual outlier patterns that are difficult to relate to a clearly identified evolutionary mechanism. The shift to using selected and hitchhiker loci will probably open this can of worms, irrespective to their utility to assess connectivity in the marine realm.
Acknowledgments
This study was supported by the Marine French Connection research group GDR CNRS-Ifremer 3445 MarCo and the ANR grant Labrad-Seq 11-PDOC-009-01. The authors thank the Associate Editor Craig Primmer, Arnaud Estoup, Robin Waples, and two anonymous reviewers for their constructive comments. This is ISEM publication 2015-116.
Glossary
- Connectivity
The exchange of individuals among populations or subpopulations. Lowe and Allendorf (2010) interestingly distinguished demographic connectivity and genetic connectivity
- Demographic connectivity
The relative contribution of net immigration and local recruitment to the population growth rate of a population. Depends both on intrinsic characteristics (survival, reproduction, emigration) of the focal population and the extrinsic contribution of dispersal from other populations
- Genetic connectivity
The absolute number of individuals coming into the focal population through immigration from other populations, as measured with genetic data; this may be a measure of individual movement or of gene flow according to the approach used
- Dispersal/migration
The movement of individuals between populations
- Dispersal/migration rate
The probability of a randomly sampled individual being an immigrant
- Genomic islands of differentiation
A region of the genome where genetic differentiation increases above its genomewide average due to the presence of a genetic barrier to gene flow
- Hybrid zone
A region where genetically distinct populations are in contact and interbreed
- Introgression
The movement of genes between populations or species due to repeated backcrossing
- Local adaptation
Higher performance of individuals in the habitat where they were born compared to immigrants
- Metapopulation
A group of subpopulations exchanging migrants
- Next-generation Sequencing (NGS)
High-throughput sequencing techniques (e.g. Illumina sequencing) in contrast to Sanger-based sequencing
- Outlier loci
Loci with atypical patterns of genetic differentiation indicative of direct or indirect selection processes
- Partially reproductively isolated species
Species that still exchange genes through introgressive hybridization
- Population
A group of individuals living in the same habitat and reproducing with each other
- Species
A group of individuals which are not interbreeding with other such groups (i.e. sensu biological species definition)
- Subpopulation, deme
A group of individuals within a population that mate randomly and exchange migrants with other such groups
Literature cited
- Addison JA, Ort BS, Mesa KA. Pogson GH. Range-wide genetic homogeneity in the California sea mussel (Mytilus californianus): a comparison of allozymes, nuclear DNA markers, and mitochondrial DNA sequences. Molecular Ecology. 2008;17:4222–4232. doi: 10.1111/j.1365-294x.2008.03905.x. [DOI] [PubMed] [Google Scholar]
- Allendorf FW, Hohenlohe PA. Luikart G. Genomics and the future of conservation genetics. Nature Reviews Genetics. 2010;11:697–709. doi: 10.1038/nrg2844. [DOI] [PubMed] [Google Scholar]
- Almany GR, Berumen ML, Thorrold SR, Planes S. Jones GP. Local replenishment of coral reef fish populations in a marine reserve. Science. 2007;316:742–744. doi: 10.1126/science.1140597. [DOI] [PubMed] [Google Scholar]
- Almany GR, Hamilton RJ, Bode M, Matawai M, Potuku T, Saenz-Agudelo P, Planes S, et al. Dispersal of grouper larvae drives local resource sharing in a coral reef fishery. Current Biology. 2013;23:626–630. doi: 10.1016/j.cub.2013.03.006. [DOI] [PubMed] [Google Scholar]
- Ansmann IC, Parra GJ, Lanyon JM. Seddon JM. Fine-scale genetic population structure in a mobile marine mammal: inshore bottlenose dolphins in Moreton Bay, Australia. Molecular Ecology. 2012;21:4472–4485. doi: 10.1111/j.1365-294X.2012.05722.x. [DOI] [PubMed] [Google Scholar]
- Aurelle D. Ledoux J-B. Interplay between isolation by distance and genetic clusters in the red coral Corallium rubrum: insights from simulated and empirical data. Conservation Genetics. 2013;14:705–716. [Google Scholar]
- Barton NH. The dynamics of hybrid zones. Heredity. 1979a;43:341–359. [Google Scholar]
- Barton NH. Gene flow past a cline. Heredity. 1979b;43:333–339. [Google Scholar]
- Barton NH. Multilocus clines. Evolution. 1983;37:454–471. doi: 10.1111/j.1558-5646.1983.tb05563.x. [DOI] [PubMed] [Google Scholar]
- Barton NH. Gale KS. Genetic analysis of hybrid zones. In: Harrison RG, editor; Hybrid Zones and the Evolutionary Process. New York: Oxford University Press; 1993. pp. 13–45. [Google Scholar]
- Bergland AO, Tobler R, Gonzalez J, Schmidt P. Petrov D. Secondary contact and local adaptation contribute to genome-wide patterns of clinal variation in Drosophila melanogaster. bioRxiv. 2015 doi: 10.1111/mec.13455. doi: 10.1101/009084. [DOI] [PMC free article] [PubMed] [Google Scholar]
- Berry A. Kreitman M. Molecular analysis of an allozyme cline: alcohol dehydrogenase in Drosophila melanogaster on the east coast of North America. Genetics. 1993;134:869–893. doi: 10.1093/genetics/134.3.869. [DOI] [PMC free article] [PubMed] [Google Scholar]
- Bierne N. The distinctive footprints of local hitchhiking in a varied environment and global hitchhiking in a subdivided population. Evolution. 2010;64:3254–3272. doi: 10.1111/j.1558-5646.2010.01050.x. [DOI] [PubMed] [Google Scholar]
- Bierne N, Borsa P, Daguin C, Jollivet D, Viard F, Bonhomme F. David P. Introgression patterns in the mosaic hybrid zone between Mytilus edulis and M. galloprovincialis. Molecular Ecology. 2003;12:447–461. doi: 10.1046/j.1365-294x.2003.01730.x. [DOI] [PubMed] [Google Scholar]
- Bierne N, Welch J, Loire E, Bonhomme F. David P. The coupling hypothesis: why genome scans may fail to map local adaptation genes. Molecular Ecology. 2011;20:2044–2072. doi: 10.1111/j.1365-294X.2011.05080.x. [DOI] [PubMed] [Google Scholar]
- Bierne N, Roze D. Welch JJ. Pervasive selection or is it…? why are FST outliers sometimes so frequent? Molecular Ecology. 2013;22:2061–2064. doi: 10.1111/mec.12241. [DOI] [PubMed] [Google Scholar]
- Blair C, Weigel DE, Balazik M, Keeley ATH, Walker FM, Landguth E, Cushman SAM, et al. A simulation-based evaluation of methods for inferring linear barriers to gene flow. Molecular Ecology Resources. 2012;12:822–833. doi: 10.1111/j.1755-0998.2012.03151.x. [DOI] [PubMed] [Google Scholar]
- Bonhomme M, Chevalet C, Servin B, Boitard S, Abdallah J, Blott S. SanCristobal M. Detecting selection in population trees: the Lewontin and Krakauer test extended. Genetics. 2010;186:241–262. doi: 10.1534/genetics.110.117275. [DOI] [PMC free article] [PubMed] [Google Scholar]
- Bradbury IR, Hubert S, Higgins B, Borza T, Bowman S, Paterson IG, Snelgrove PVR, et al. Parallel adaptive evolution of Atlantic cod on both sides of the Atlantic Ocean in response to temperature. Proceedings of the Royal Society B: Biological Sciences. 2010;277:3725–3734. doi: 10.1098/rspb.2010.0985. [DOI] [PMC free article] [PubMed] [Google Scholar]
- Broquet T. Petit EJ. Molecular estimation of dispersal for ecology and population genetics. Annual Review of Ecology, Evolution, and Systematics. 2009;40:193–216. [Google Scholar]
- Broquet T, Yearsley J, Hirzel AH, Goudet J. Perrin N. Inferring recent migration rates from individual genotypes. Molecular Ecology. 2009;18:1048–1060. doi: 10.1111/j.1365-294X.2008.04058.x. [DOI] [PubMed] [Google Scholar]
- Charlesworth B, Morgan M. Charlesworth D. The effect of deleterious mutations on neutral molecular variation. Genetics. 1993;134:1289–1303. doi: 10.1093/genetics/134.4.1289. [DOI] [PMC free article] [PubMed] [Google Scholar]
- Charlesworth B, Nordborg M. Charlesworth D. The effects of local selection, balanced polymorphism and background selection on equilibrium patterns of genetic diversity in subdivided populations. Genetical research. 1997;70:155–174. doi: 10.1017/s0016672397002954. [DOI] [PubMed] [Google Scholar]
- Christie MR, Tissot BN, Albins MA, Beets JP, Jia Y, Ortiz DM, Thompson SE, et al. Larval connectivity in an effective network of marine protected areas. PLoS ONE. 2010;5:e15715. doi: 10.1371/journal.pone.0015715. [DOI] [PMC free article] [PubMed] [Google Scholar]
- Clobert J, Baguette M, Benton TG, Bullock JM. Ducatez S. Dispersal Ecology and Evolution. Oxford: Oxford University Press; 2012. [Google Scholar]
- Colbeck GJ, Turgeon J, Sirois P. Dodson JJ. Historical introgression and the role of selective vs. neutral processes in structuring nuclear genetic variation (AFLP) in a circumpolar marine fish, the capelin (Mallotus villosus. Molecular Ecology. 2011;20:1976–1987. doi: 10.1111/j.1365-294X.2011.05069.x. [DOI] [PubMed] [Google Scholar]
- Corander J, Waldmann P. Sillanpää MJ. Bayesian analysis of genetic differentiation between Populations. Genetics. 2003;163:367–374. doi: 10.1093/genetics/163.1.367. [DOI] [PMC free article] [PubMed] [Google Scholar]
- Cullingham CI, Cooke JE. Coltman DW. Effects of introgression on the genetic population structure of two ecologically and economically important conifer species: lodgepole pine (Pinus contorta var. latifolia) and jack pine (Pinus banksiana. Genome. 2013;56:577–585. doi: 10.1139/gen-2013-0071. [DOI] [PubMed] [Google Scholar]
- Davey JW, Hohenlohe PA, Etter PD, Boone JQ, Catchen JM. Blaxter ML. Genome-wide genetic marker discovery and genotyping using next-generation sequencing. Nature Reviews Genetics. 2011;12:499–510. doi: 10.1038/nrg3012. [DOI] [PubMed] [Google Scholar]
- De Mita S, Thuillet A-C, Gay L, Ahmadi N, Manel S, Ronfort J. Vigouroux Y. Detecting selection along environmental gradients: analysis of eight methods and their effectiveness for outbreeding and selfing populations. Molecular Ecology. 2013;22:1383–1399. doi: 10.1111/mec.12182. [DOI] [PubMed] [Google Scholar]
- De Villemereuil P, Frichot E, Bazin E, François O. Gaggiotti O. Genome scan methods against more complex models: when and how much should we trust them? Molecular Ecology. 2014;23:2006–2019. doi: 10.1111/mec.12705. [DOI] [PubMed] [Google Scholar]
- Derryberry EP, Derryberry GE, Maley JM. Brumfield RT. HZAR: hybrid zone analysis using an R software package. Molecular Ecology Resources. 2014;14:652–663. doi: 10.1111/1755-0998.12209. [DOI] [PubMed] [Google Scholar]
- DeWoody JA. Avise JC. Microsatellite variation in marine, freshwater and anadromous fishes compared with other animals. Journal of Fish Biology. 2000;56:461–473. [Google Scholar]
- Duforet-Frebourg N, Bazin E. Blum MG. Genome scans for detecting footprints of local adaptation using a Bayesian factor model. Molecular Biology and Evolution. 2014;31:2483–2495. doi: 10.1093/molbev/msu182. [DOI] [PMC free article] [PubMed] [Google Scholar]
- Duggins CF, Karlin AA, Mousseau TA. Relyea KG. Analysis of a hybrid zone in Fundulus majalis in a northeastern Florida ecotone. Heredity. 1995;74:117–128. [Google Scholar]
- Durand E, Jay F, Gaggiotti OE. François O. Spatial inference of admixture proportions and secondary contact zones. Molecular Biology and Evolution. 2009;26:1963–1973. doi: 10.1093/molbev/msp106. [DOI] [PubMed] [Google Scholar]
- Endler JA. Geographic Variation, Speciation, and Clines. Princeton: Princeton University Press; 1977. [PubMed] [Google Scholar]
- Excoffier L, Hofer T. Foll M. Detecting loci under selection in a hierarchically structured population. Heredity. 2009;103:285–298. doi: 10.1038/hdy.2009.74. [DOI] [PubMed] [Google Scholar]
- Fabian DK, Kapun M, Nolte V, Kofler R, Schmidt PS, Schlötterer C. Flatt T. Genome-wide patterns of latitudinal differentiation among populations of Drosophila melanogaster from North America. Molecular Ecology. 2012;21:4748–4769. doi: 10.1111/j.1365-294X.2012.05731.x. [DOI] [PMC free article] [PubMed] [Google Scholar]
- Faure MF, David P, Bonhomme F. Bierne N. Genetic hitchhiking in a subdivided population of Mytilus edulis. BMC Evolutionary Biology. 2008;8:164. doi: 10.1186/1471-2148-8-164. [DOI] [PMC free article] [PubMed] [Google Scholar]
- Foll M, Gaggiotti OE, Daub JT, Vatsiou A. Excoffier L. Widespread signals of convergent adaptation to high altitude in Asia and America. The American Journal of Human Genetics. 2014;95:394–407. doi: 10.1016/j.ajhg.2014.09.002. [DOI] [PMC free article] [PubMed] [Google Scholar]
- Fourcade Y, Chaput-Bardy A, Secondi J, Fleurant C. Lemaire C. Is local selection so widespread in river organisms? Fractal geometry of river networks leads to high bias in outlier detection. Molecular Ecology. 2013;22:2065–2073. doi: 10.1111/mec.12158. [DOI] [PubMed] [Google Scholar]
- Fraïsse C, Roux C, Welch JJ. Bierne N. Gene-flow in a mosaic hybrid zone: is local introgression adaptive? Genetics. 2014;197:939–951. doi: 10.1534/genetics.114.161380. [DOI] [PMC free article] [PubMed] [Google Scholar]
- Fraïsse C, Belkhir K, Welch JJ. Bierne N. Local inter-species introgression is the main cause of outlying levels of intra-specific differentiation in mussels. Molecular Ecology. 2015 doi: 10.1111/mec.13299. [in press] [DOI] [PubMed] [Google Scholar]
- François O. Durand E. Spatially explicit Bayesian clustering models in population genetics. Molecular Ecology Resources. 2010;10:773–784. doi: 10.1111/j.1755-0998.2010.02868.x. [DOI] [PubMed] [Google Scholar]
- Funk WC, McKay JK, Hohenlohe PA. Allendorf FW. Harnessing genomics for delineating conservation units. Trends in Ecology & Evolution. 2012;27:489–496. doi: 10.1016/j.tree.2012.05.012. [DOI] [PMC free article] [PubMed] [Google Scholar]
- Gaggiotti OE, Jones F, Lee WM, Amos W, Harwood J. Nichols RA. Patterns of colonization in a metapopulation of grey seals. Nature. 2002;416:424–427. doi: 10.1038/416424a. [DOI] [PubMed] [Google Scholar]
- Gagnaire P-A, Minegishi Y, Zenboudji S, Valade P, Aoyama J. Berrebi P. Within-population structure highlighted by differential introgression across semipermeable barriers to gene flow in Anguilla marmorata. Evolution. 2011;65:3413–3427. doi: 10.1111/j.1558-5646.2011.01404.x. [DOI] [PubMed] [Google Scholar]
- Gagnaire P-A, Normandeau E, Côté C, Hansen MM. Bernatchez L. The genetic consequences of spatially varying selection in the panmictic American eel (Anguilla rostrata. Genetics. 2012;190:725–736. doi: 10.1534/genetics.111.134825. [DOI] [PMC free article] [PubMed] [Google Scholar]
- Gao H, Williamson S. Bustamante CD. A Marko Chain Monte Carlo approach for joint inference of population structure and inbreeding rates from multilocus genotype data. Genetics. 2007;76:1635–1651. doi: 10.1534/genetics.107.072371. [DOI] [PMC free article] [PubMed] [Google Scholar]
- Gilg MR. Hilbish TJ. The geography of marine larval dispersal: coupling genetics with fine-scale physical oceanography. Ecology. 2003;84:2989–2998. [Google Scholar]
- Gompert Z. Buerkle CA. Analyses of genetic ancestry enable key insights for molecular ecology. Molecular Ecology. 2013;22:5278–5294. doi: 10.1111/mec.12488. [DOI] [PubMed] [Google Scholar]
- Gore MA, Chia JM, Elshire RJ, Sun Q, Ersoz ES, Hurwitz BL, Peiffer JA, et al. A first-generation haplotype map of maize. Science. 2009;326:1115–1117. doi: 10.1126/science.1177837. [DOI] [PubMed] [Google Scholar]
- Gosset CC. Bierne N. Differential introgression from a sister species explains high FST outlier loci within a mussel species. Journal of Evolutionary Biology. 2013;26:14–26. doi: 10.1111/jeb.12046. [DOI] [PubMed] [Google Scholar]
- Gosset CC, Do Nascimento J, Augé MT. Bierne N. Evidence for adaptation from standing genetic variation on an antimicrobial peptide gene in the mussel Mytilus edulis. Molecular Ecology. 2014;23:3000–3012. doi: 10.1111/mec.12784. [DOI] [PubMed] [Google Scholar]
- Gravel S. Population genetics models of local ancestry. Genetics. 2012;191:607–619. doi: 10.1534/genetics.112.139808. [DOI] [PMC free article] [PubMed] [Google Scholar]
- Hedgecock D, Barber PH. Edmands S. Genetic approaches to measuring connectivity. Oceanography. 2007;20:70–79. [Google Scholar]
- Hellberg ME. Gene flow and isolation among populations of marine animals. Annual Review of Ecology, Evolution, and Systematics. 2009;40:291–310. [Google Scholar]
- Hemmer-Hansen J, Nielsen EE, Therkildsen NO, Taylor MI, Ogden R, Geffen AJ, Bekkevold D, et al. A genomic island linked to ecotype divergence in Atlantic cod. Molecular Ecology. 2013;22:2653–2667. doi: 10.1111/mec.12284. [DOI] [PubMed] [Google Scholar]
- Jones GP, Planes S. Thorrold SR. Coral reef fish larvae settle close to home. Current Biology. 2005;15:1314–1318. doi: 10.1016/j.cub.2005.06.061. [DOI] [PubMed] [Google Scholar]
- Jost LOU. GST and its relatives do not measure differentiation. Molecular Ecology. 2008;17:4015–4026. doi: 10.1111/j.1365-294x.2008.03887.x. [DOI] [PubMed] [Google Scholar]
- Jovelin R, Comstock JS, Cutter AD. Phillips PC. A recent global selective sweep on the age-1 phosphatidylinositol 3-OH kinase regulator of the insulin-like signaling pathway within Caenorhabditis remanei. G3: Genes ¦ Genomes ¦ Genetics. 2014;4:1123–1133. doi: 10.1534/g3.114.010629. [DOI] [PMC free article] [PubMed] [Google Scholar]
- Karlsen BO, Klingan K, Emblem A, Jørgensen TE, Jueterbock A, Furmanek T, Hoarau G, et al. Genomic divergence between the migratory and stationary ecotypes of Atlantic cod. Molecular Ecology. 2013;22:5098–5111. doi: 10.1111/mec.12454. [DOI] [PubMed] [Google Scholar]
- Koehn RK, Newell RI. Immermann F. Maintenance of an aminopeptidase allele frequency cline by natural selection. Proceedings of the National Academy of Sciences. 1980;77:5385–5389. doi: 10.1073/pnas.77.9.5385. [DOI] [PMC free article] [PubMed] [Google Scholar]
- Kruuk LEB, Baird SJE, Gale KS. Barton NH. A comparison of multilocus clines maintained by environmental adaptation or by selection against hybrids. Genetics. 1999;153:1959–1971. doi: 10.1093/genetics/153.4.1959. [DOI] [PMC free article] [PubMed] [Google Scholar]
- Lamichhaney S, Barrio AM, Rafati N, Sundström G, Rubin C-J, Gilbert ER, Berglund J, et al. Population-scale sequencing reveals genetic differentiation due to local adaptation in Atlantic herring. Proceedings of the National Academy of Sciences. 2012;109:19345–19350. doi: 10.1073/pnas.1216128109. [DOI] [PMC free article] [PubMed] [Google Scholar]
- Langley CH, Stevens K, Cardeno C, Lee YCG, Schrider DR, Pool JE, Langley SA, et al. Genomic variation in natural populations of Drosophila melanogaster. Genetics. 2012;192:533–598. doi: 10.1534/genetics.112.142018. [DOI] [PMC free article] [PubMed] [Google Scholar]
- Lassen HH. Turano FJ. Clinal variation and heterozygote deficit at the Lap-locus in Mytilus edulis. Marine Biology. 1978;49:245–254. [Google Scholar]
- Latch EK, Dharmarajan G, Glaubitz JC. Rhodes OE., Jr Relative performance of Bayesian clustering software for inferring population substructure and individual assignment at low levels of population differentiation. Conservation Genetics. 2006;7:295–302. [Google Scholar]
- Le Corre V. Kremer A. The genetic differentiation at quantitative trait loci under local adaptation. Molecular Ecology. 2012;21:1548–1566. doi: 10.1111/j.1365-294X.2012.05479.x. [DOI] [PubMed] [Google Scholar]
- Ledoux JB, Garrabou J, Bianchimani O, Drap P, Féral JP. Aurelle D. Fine-scale genetic structure and inferences on population biology in the threatened Mediterranean red coral, Corallium rubrum. Molecular Ecology. 2010;19:4204–4216. doi: 10.1111/j.1365-294X.2010.04814.x. [DOI] [PubMed] [Google Scholar]
- Lenormand T, Guillemaud T, Bourguet D. Raymond M. Evaluating gene flow using selected markers: a case study. Genetics. 1998;149:1383–1392. doi: 10.1093/genetics/149.3.1383. [DOI] [PMC free article] [PubMed] [Google Scholar]
- Levene H. Genetic equilibrium when more than one ecological niche is available. The American Naturalist. 1953;87:331–333. [Google Scholar]
- Liang M. Nielsen R. The lengths of admixture tracts. Genetics. 2014;197:953–967. doi: 10.1534/genetics.114.162362. [DOI] [PMC free article] [PubMed] [Google Scholar]
- Limborg MT, Helyar SJ, De Bruyn M, Taylor MI, Nielsen EE, Ogden ROB, Carvalho GR, et al. Environmental selection on transcriptome-derived SNPs in a high gene flow marine fish, the Atlantic herring (Clupea harengus. Molecular Ecology. 2012;21:3686–3703. doi: 10.1111/j.1365-294X.2012.05639.x. [DOI] [PubMed] [Google Scholar]
- Lotterhos K. Whitlock M. Evaluation of demographic history and neutral parameterization on the performance of FST outlier tests. Molecular Ecology. 2014;23:2178–2192. doi: 10.1111/mec.12725. [DOI] [PMC free article] [PubMed] [Google Scholar]
- Lowe WH. Allendorf FW. What can genetics tell us about population connectivity? Molecular Ecology. 2010;19:3038–3051. doi: 10.1111/j.1365-294X.2010.04688.x. [DOI] [PubMed] [Google Scholar]
- Luikart G, England PR, Tallmon D, Jordan S. Taberlet P. The power and promise of population genomics: from genotyping to genome typing. Nature Reviews Genetics. 2003;4:981–994. doi: 10.1038/nrg1226. [DOI] [PubMed] [Google Scholar]
- Lukoschek V. Shine R. Sea snakes rarely venture far from home. Ecology and Evolution. 2012;2:1113–1121. doi: 10.1002/ece3.256. [DOI] [PMC free article] [PubMed] [Google Scholar]
- Marko PB. Hart MW. The complex analytical landscape of gene flow inference. Trends in Ecology & Evolution. 2011;26:448–456. doi: 10.1016/j.tree.2011.05.007. [DOI] [PubMed] [Google Scholar]
- Maynard Smith J. Haigh J. The hitch-hiking effect of a favourable gene. Genetical Research. 1974;23:23–35. [PubMed] [Google Scholar]
- McCusker MR. Bentzen P. Positive relationships between genetic diversity and abundance in fishes. Molecular Ecology. 2010;19:4852–4862. doi: 10.1111/j.1365-294X.2010.04822.x. [DOI] [PubMed] [Google Scholar]
- van der Meer MH, Hobbs J-PA, Jones GP. van Herwerden L. Genetic connectivity among and self-replenishment within island populations of a restricted range subtropical reef fish. PLoS ONE. 2012;7:e49660. doi: 10.1371/journal.pone.0049660. [DOI] [PMC free article] [PubMed] [Google Scholar]
- Meirmans PG. The trouble with isolation by distance. Molecular Ecology. 2012;21:2839–2846. doi: 10.1111/j.1365-294X.2012.05578.x. [DOI] [PubMed] [Google Scholar]
- Meirmans PG. Hedrick PW. Assessing population structure: FST and related measures. Molecular Ecology Resources. 2011;11:5–18. doi: 10.1111/j.1755-0998.2010.02927.x. [DOI] [PubMed] [Google Scholar]
- Mokhtar-Jamaï K, Pascual M, Ledoux JB, Coma R, Féral JP, Garrabou J. Aurelle D. From global to local genetic structuring in the red gorgonian Paramuricea clavata: the interplay between oceanographic conditions and limited larval dispersal. Molecular Ecology. 2011;20:3291–3305. doi: 10.1111/j.1365-294X.2011.05176.x. [DOI] [PubMed] [Google Scholar]
- Murray MC. Hare MP. A genomic scan for divergent selection in a secondary contact zone between Atlantic and Gulf of Mexico oysters, Crassostrea virginica. Molecular Ecology. 2006;15:4229–4242. doi: 10.1111/j.1365-294X.2006.03060.x. [DOI] [PubMed] [Google Scholar]
- Nagylaki T. Conditions for the existence of clines. Genetics. 1975;80:595–615. doi: 10.1093/genetics/80.3.595. [DOI] [PMC free article] [PubMed] [Google Scholar]
- Narum SR. Hess JE. Comparison of FST outlier tests for SNP loci under selection. Molecular Ecology Resources. 2011;11(Suppl. 1):184–194. doi: 10.1111/j.1755-0998.2011.02987.x. [DOI] [PubMed] [Google Scholar]
- Nielsen EE, Hemmer-Hansenn J, Larsen PF. Bekkevold D. Population genomics of marine fishes: identifying adaptive variation in space and time. Molecular Ecology. 2009;18:3128–3150. doi: 10.1111/j.1365-294X.2009.04272.x. [DOI] [PubMed] [Google Scholar]
- Nielsen EE, Cariani A, Mac Aoidh E, Maes GE, Milano I, Ogden R, Taylor M, et al. Gene-associated markers provide tools for tackling illegal fishing and false eco-certification. Nature Communications. 2012;3:851. doi: 10.1038/ncomms1845. [DOI] [PubMed] [Google Scholar]
- Novembre J, Johnson T, Bryc K, Kutalik Z, Boyko AR, Auton A, Indap A, et al. Genes mirror geography within Europe. Nature. 2008;456:98–101. doi: 10.1038/nature07331. [DOI] [PMC free article] [PubMed] [Google Scholar]
- O'Connor TD, Fu W NHLBI GO Exome Sequencing Project; ESP Population Genetics and Statistical Analysis Working Group. Turner E, Mychaleckyj JC, Logsdon B, et al. Rare variation facilitates inferences of fine-scale population structure in humans. Molecular Biology and Evolution. 2014;32:653–660. doi: 10.1093/molbev/msu326. [DOI] [PMC free article] [PubMed] [Google Scholar]
- Paetkau D, Slade R, Burden M. Estoup A. Genetic assignment methods for the direct, real-time estimation of migration rate: a simulation-based exploration of accuracy and power. Molecular Ecology. 2004;13:55–65. doi: 10.1046/j.1365-294x.2004.02008.x. [DOI] [PubMed] [Google Scholar]
- Palamara PF. Pe'er I. Inference of historical migration rates via haplotype sharing. Bioinformatics. 2013;29:i180–i188. doi: 10.1093/bioinformatics/btt239. [DOI] [PMC free article] [PubMed] [Google Scholar]
- Palumbi SR. Genetic divergence, reproductive isolation, and marine speciation. Annual Review of Ecology and Systematics. 1994;25:547–572. [Google Scholar]
- Palumbi SR. Population genetics, demographic connectivity, and the design of marine reserves. Ecological Applications. 2003;13:S146–S158. [Google Scholar]
- Patterson N, Price AL. Reich D. Population structure and eigenanalysis. PLoS Genetics. 2006;2:e190. doi: 10.1371/journal.pgen.0020190. [DOI] [PMC free article] [PubMed] [Google Scholar]
- Perrier C, Guyomard R, Bagliniere J-L. Evanno G. Determinants of hierarchical genetic structure in Atlantic salmon populations: environmental factors vs. anthropogenic influences. Molecular Ecology. 2011;20:4231–4245. doi: 10.1111/j.1365-294X.2011.05266.x. [DOI] [PubMed] [Google Scholar]
- Pinsky ML, Montes HR., Jr Palumbi SR. Using isolation by distance and effective density to estimate dispersal scales in anemonefish. Evolution. 2010;64:2688–2700. doi: 10.1111/j.1558-5646.2010.01003.x. [DOI] [PubMed] [Google Scholar]
- Planes S, Jones GP. Thorrold SR. Larval dispersal connects fish populations in a network of marine protected areas. Proceedings of the National Academy of Sciences. 2009;106:5693–5697. doi: 10.1073/pnas.0808007106. [DOI] [PMC free article] [PubMed] [Google Scholar]
- Pogson GH, Taggart CT, Mesa KA. Boutilier RG. Isolation by distance in the Atlantic cod, Gadus morhua, at large and small geographic scales. Evolution. 2001;55:131–146. doi: 10.1111/j.0014-3820.2001.tb01279.x. [DOI] [PubMed] [Google Scholar]
- Pool JE. Nielsen R. Inference of historical changes in migration rate from the lengths of migrant tracts. Genetics. 2009;181:711–719. doi: 10.1534/genetics.108.098095. [DOI] [PMC free article] [PubMed] [Google Scholar]
- Popescu A-A, Harper AL, Trick M, Bancroft I. Huber KT. A novel and fast approach for population structure inference using kernel-PCA and optimization (PSIKO) Genetics. 2014;114:171314. doi: 10.1534/genetics.114.171314. [DOI] [PMC free article] [PubMed] [Google Scholar]
- Powers DA. Place AR. Biochemical genetics of Fundulus heteroclitus (L.). I. Temporal and spatial variation in gene frequencies of Ldh-B, Mdh-A, Gpi-B, and Pgm-A. Biochemical Genetics. 1978;16:593–607. doi: 10.1007/BF00484222. [DOI] [PubMed] [Google Scholar]
- Pritchard JK. Di Rienzo A. Adaptation – not by sweeps alone. Nature Reviews Genetics. 2010;11:665–667. doi: 10.1038/nrg2880. [DOI] [PMC free article] [PubMed] [Google Scholar]
- Pritchard JK, Stephens M. Donnelly P. Inference of population structure using multilocus genotype data. Genetics. 2000;155:945–959. doi: 10.1093/genetics/155.2.945. [DOI] [PMC free article] [PubMed] [Google Scholar]
- Puebla O, Bermingham E. Guichard F. Estimating dispersal from genetic isolation by distance in a coral reef fish (Hypoplectrus puella. Ecology. 2009;90:3087–3098. doi: 10.1890/08-0859.1. [DOI] [PubMed] [Google Scholar]
- Puebla O, Bermingham E. McMillan WO. On the spatial scale of dispersal in coral reef fishes. Molecular Ecology. 2012;21:5675–5688. doi: 10.1111/j.1365-294X.2012.05734.x. [DOI] [PubMed] [Google Scholar]
- Raj A, Stephens M. Pritchard JK. Variational inference of population structure in large SNP datasets. Genetics. 2014;114:164350. doi: 10.1534/genetics.114.164350. [DOI] [PMC free article] [PubMed] [Google Scholar]
- Ralph P. Coop G. Parallel adaptation: one or many waves of advance of an advantageous allele? Genetics. 2010;186:647–668. doi: 10.1534/genetics.110.119594. [DOI] [PMC free article] [PubMed] [Google Scholar]
- Roesti M, Hendry AP, Salzburger W. Berner D. Genome divergence during evolutionary diversification as revealed in replicate lake–stream stickleback population pairs. Molecular Ecology. 2012;21:2852–2862. doi: 10.1111/j.1365-294X.2012.05509.x. [DOI] [PubMed] [Google Scholar]
- Roesti M, Gavrilets S, Hendry AP, Salzburger W. Berner D. The genomic signature of parallel adaptation from shared genetic variation. Molecular Ecology. 2014;23:3944–3956. doi: 10.1111/mec.12720. [DOI] [PMC free article] [PubMed] [Google Scholar]
- Rose CG, Paynter KT. Hare MP. Isolation by distance in the eastern oyster, Crassostrea virginica, in Chesapeake Bay. Journal of Heredity. 2006;97:158–170. doi: 10.1093/jhered/esj019. [DOI] [PubMed] [Google Scholar]
- Rousset F. Genetic differentiation and estimation of gene flow from F-statistics under isolation by distance. Genetics. 1997;145:1219–1228. doi: 10.1093/genetics/145.4.1219. [DOI] [PMC free article] [PubMed] [Google Scholar]
- Rousset F. Genetic differentiation between individuals. Journal of Evolutionary Biology. 2000;13:58–62. [Google Scholar]
- Rousset F. Genetic Structure and Selection in Subdivided Populations. Vol. 40. Princeton: Princeton University Press; 2004. [Google Scholar]
- Saenz-Agudelo P, Jones GP, Thorrold SR. Planes S. Connectivity dominates larval replenishment in a coastal reef fish metapopulation. Proceedings of the Royal Society B: Biological Sciences. 2011;278:2954–2961. doi: 10.1098/rspb.2010.2780. [DOI] [PMC free article] [PubMed] [Google Scholar]
- Schmidt PS, Serrão EA, Pearson GA, Riginos C, Rawson PD, Hilbish TJ, Brawley SH, et al. Ecological genetics in the North Atlantic: environmental gradients and adaptation at specific loci. Ecology. 2008;89(sp11):S91–S107. doi: 10.1890/07-1162.1. [DOI] [PubMed] [Google Scholar]
- Schrider DR, Mendes FK, Hahn MW. Kern AD. Soft shoulders ahead: spurious signatures of soft and partial selective sweeps result from linked hard sweeps. Genetics. 2015;200:267–284. doi: 10.1534/genetics.115.174912. [DOI] [PMC free article] [PubMed] [Google Scholar]
- Schwartz MK. McKelvey KS. Why sampling scheme matters: the effect of sampling scheme on landscape genetic results. Conservation Genetics. 2009;10:441–452. [Google Scholar]
- Selkoe KA. Toonen RJ. Marine connectivity: a new look at pelagic larval duration and genetic metrics of dispersal. Marine Ecology Progress Series. 2011;436:291–305. [Google Scholar]
- Selkoe KA, Watson JR, White C, Horin TB, Iacchei M, Mitarai S, Siegel DA, et al. Taking the chaos out of genetic patchiness: seascape genetics reveals ecological and oceanographic drivers of genetic patterns in three temperate reef species. Molecular Ecology. 2010;19:3708–3726. doi: 10.1111/j.1365-294X.2010.04658.x. [DOI] [PubMed] [Google Scholar]
- Slatkin M. Gene flow and selection in a cline. Genetics. 1973;75:733–756. doi: 10.1093/genetics/75.4.733. [DOI] [PMC free article] [PubMed] [Google Scholar]
- Sotka EE. Palumbi SR. The use of genetic clines to estimate dispersal distances of marine larvae. Ecology. 2006;87:1094–1103. doi: 10.1890/0012-9658(2006)87[1094:tuogct]2.0.co;2. [DOI] [PubMed] [Google Scholar]
- Sotka EE, Wares JP, Barth JA, Grosberg RK. Palumbi SR. Strong genetic clines and geographical variation in gene flow in the rocky intertidal barnacle Balanus glandula. Molecular Ecology. 2004;13:2143–2156. doi: 10.1111/j.1365-294X.2004.02225.x. [DOI] [PubMed] [Google Scholar]
- Stapley J, Reger J, Feulner PGD, Smadja C, Galindo J, Ekblom R, Bennison C, et al. Adaptation genomics: the next generation. Trends in Ecology and Evolution. 2010;25:705–712. doi: 10.1016/j.tree.2010.09.002. [DOI] [PubMed] [Google Scholar]
- Storz JF. Using genome scans of DNA polymorphism to infer adaptive population divergence. Molecular Ecology. 2005;14:671–688. doi: 10.1111/j.1365-294X.2005.02437.x. [DOI] [PubMed] [Google Scholar]
- Stumpf MP. McVean GA. Estimating recombination rates from population-genetic data. Nature reviews. Genetics. 2003;4:959–968. doi: 10.1038/nrg1227. [DOI] [PubMed] [Google Scholar]
- Swearer SE, Shima JS, Hellberg ME, Thorrold SR, Jones GP, Robertson DR, Morgan SG, et al. Evidence of self-recruitment in demersal marine populations. Bulletin of Marine Science. 2002;70(Suppl. 1):251–271. [Google Scholar]
- Szymura JM. Barton NH. Genetic analysis of a hybrid zone between the fire-bellied toads, Bombina bombina and B. variegata, Near Cracow in Southern Poland. Evolution. 1986;40:1141–1159. doi: 10.1111/j.1558-5646.1986.tb05740.x. [DOI] [PubMed] [Google Scholar]
- Tine M, Kuhl H, Gagnaire P-A, Louro B, Desmarais E, Martins RST, Hecht J, et al. European sea bass genome and its variation provide insights into adaptation to euryhalinity and speciation. Nature Communications. 2014;5:5770. doi: 10.1038/ncomms6770. [DOI] [PMC free article] [PubMed] [Google Scholar]
- Underwood JN, Smith LD, Van Oppen MJH. Gilmour JP. Multiple scales of genetic connectivity in a brooding coral on isolated reefs following catastrophic bleaching. Molecular Ecology. 2007;16:771–784. doi: 10.1111/j.1365-294X.2006.03187.x. [DOI] [PubMed] [Google Scholar]
- Väinölä R. Hvilsom MM. Genetic divergence and a hybrid zone between Baltic and North Sea Mytilus populations (Mytilidae: Mollusca) Biological Journal of the Linnean Society. 1991;43:127–148. [Google Scholar]
- Visscher PM, Hill WG. Wray NR. Heritability in the genomics era – concepts and misconceptions. Nature Reviews Genetics. 2008;9:255–266. doi: 10.1038/nrg2322. [DOI] [PubMed] [Google Scholar]
- Waples RS. Separating the wheat from the chaff: patterns of genetic differentiation in high gene flow species. Journal of Heredity. 1998;89:438–450. [Google Scholar]
- Waples RS. Testing for Hardy-Weinberg proportions: have we lost the plot? Journal of Heredity. 2015;106:1–19. doi: 10.1093/jhered/esu062. [DOI] [PubMed] [Google Scholar]
- Waples RS. Gaggiotti O. What is a population? An empirical evaluation of some genetic methods for identifying the number of gene pools and their degree of connectivity. Molecular Ecology. 2006;15:1419–1439. doi: 10.1111/j.1365-294X.2006.02890.x. [DOI] [PubMed] [Google Scholar]
- Waples RS, Punt AE. Cope JM. Integrating genetic data into management of marine resources: how can we do it better? Fish and Fisheries. 2008;9:423–449. [Google Scholar]
- Ward RD, Woodwark M. Skibinski DOF. A comparison of genetic diversity levels in marine, freshwater, and anadromous fishes. Journal of Fish Biology. 1994;44:213–232. [Google Scholar]
- Whitlock MC. McCauley DE. Indirect measures of gene flow and migration: FST≠1/(4Nm+1) Heredity. 1999;82:117–125. doi: 10.1038/sj.hdy.6884960. [DOI] [PubMed] [Google Scholar]
- Wilson AB. Eigenmann Veraguth I. The impact of Pleistocene glaciation across the range of a widespread European coastal species. Molecular Ecology. 2010;19:4535–4553. doi: 10.1111/j.1365-294X.2010.04811.x. [DOI] [PubMed] [Google Scholar]
- Wright S. The genetical structure of populations. Annals of Eugenics. 1951;15:323–354. doi: 10.1111/j.1469-1809.1949.tb02451.x. [DOI] [PubMed] [Google Scholar]
- Zbawicka M, Sanko T, Strand J. Wenne R. New SNP markers reveal largely concordant clinal variation across the hybrid zone between Mytilus spp. in the Baltic Sea. Aquatic Biology. 2014;21:25–36. [Google Scholar]