

Abstract
Oil sands are surface exposed in river valley outcrops in northeastern Alberta, where flat slabs (tablets) of weathered, bitumen-saturated sandstone can be retrieved from outcrop cliffs or from riverbeds. Although the average yearly surface temperature of this region is low (0.7°C), we found that the temperatures of the exposed surfaces of outcrop cliffs reached 55 to 60°C on sunny summer days, with daily maxima being 27 to 31°C. Analysis of the cooccurrence of taxa derived from pyrosequencing of 16S/18S rRNA genes indicated that an aerobic microbial network of fungi and hydrocarbon-, methane-, or acetate-oxidizing heterotrophic bacteria was present in all cliff tablets. Metagenomic analyses indicated an elevated presence of fungal cytochrome P450 monooxygenases in these samples. This network was distinct from the heterotrophic community found in riverbeds, which included fewer fungi. A subset of cliff tablets had a network of anaerobic and/or thermophilic taxa, including methanogens, Firmicutes, and Thermotogae, in the center. Long-term aerobic incubation of outcrop samples at 55°C gave a thermophilic microbial community. Analysis of residual bitumen with a Fourier transform ion cyclotron resonance mass spectrometer indicated that aerobic degradation proceeded at 55°C but not at 4°C. Little anaerobic degradation was observed. These results indicate that bitumen degradation on outcrop surfaces is a largely aerobic process with a minor anaerobic contribution and is catalyzed by a consortium of bacteria and fungi. Bitumen degradation is stimulated by periodic high temperatures on outcrop cliffs, which cause significant decreases in bitumen viscosity.
INTRODUCTION
The world's largest oil sands deposit, located in western Canada, is contained in Lower Cretaceous sandstone formations in the Western Canadian Sedimentary Basin at depths of 0 to 800 m below the surface (mbs) (1, 2). Surface oil sands deposits are found in river valley outcrops (Fig. 1), where they are further changed by oxidative biodegradation and weathering.
FIG 1.

(A) Horse River outcrop near Fort McMurray, Alberta, showing the cliff and river below; (B and C) bituminous sandstone tablet retrieved from the cliff (B) and the river (C); (D) cross section of a tablet retrieved from the cliff; (E) natural oil contamination of Saline Creek near Fort McMurray, Alberta. Bars, approximately 1 m (foreground in panel A) and 10 cm (B to E).
Oil sands hydrocarbon formed 84 million to 55 million years ago in tide-controlled river and estuarine sediment source rock, from where it migrated upwards and eastwards to accumulate at the northeastern margins of the basin centered around Fort McMurray, Alberta, Canada (2–4). The oil became severely biodegraded during this journey and following its placement at low depth and low temperature in the Athabasca, Cold Lake, and Peace River oil sands deposits that exist today. Biodegradation of low-molecular-weight components caused the oil to become more viscous, with the viscosity ranging from 1 cP for initially formed nondegraded light oil to 106 cP for heavily biodegraded, eastern Athabasca oil sands bitumen, which is currently in place (5–11). Bitumen is therefore depleted of low-molecular-weight aliphatic and aromatic hydrocarbons and enriched in polyaromatic hydrocarbons (PAHs), including alkylnaphthalenes or alkylphenanthrenes, as well as in naphthenic acids (NAs), resins, and asphaltenes (12–14). The fraction of heteroatom (S, O, and N)-containing organic compounds increases from about 25% (wt/wt) in the Peace River oil sands to nearly 60% (wt/wt) in parts of the Athabasca oil sands.
These high-molecular-weight (HMW) components are structurally diverse, causing individual compounds to be present at low concentrations, which compromises their biodegradation. The synthesis of specific enzymes requires an energy investment, which can be recouped only if a sufficient concentration of substrate molecules is present. The action of specific enzymes also suffers if structurally similar compounds act as competitive inhibitors. Hence, although microorganisms which can grow by degrading specific NAs (15, 16) or PAHs (17) have been isolated, these substrates degrade more slowly when present at ultralow concentrations in a bitumen mixture. For example, NA mixtures representing 103 to 104 compounds from oil sands bitumen end up in tailings ponds at concentrations of up to 100 mg/liter (18). Because NAs make tailings pond waters toxic to aquatic life, their degradation has been studied extensively. Degradation in ponds has been found to be slow. It is promoted by random oxidation (e.g., chemical ozonation), in which reactive oxygen species generate smaller, less diverse substrates for subsequent biodegradation (19–21).
The oil sands are naturally exposed to the surface in outcrop sections along the Athabasca-Clearwater River drainage networks. A comprehensive characterization of 78 outcrop sections focused on geologic setting, sedimentology, and facies analyses has been published (22). These outcrops range from being very remote to easily accessible, like those along the Horse River and Saline Creek near Fort McMurray, Alberta (Fig. 1A). Bituminous sandstone tablets can be retrieved from outcrop slopes (Fig. 1B) or from the river or creek beds (Fig. 1C). These can easily be broken to show the presence of black bituminous sands (Fig. 1D). River water in contact with outcrop slopes often shows the presence of extracted surface oil (Fig. 1E).
Bituminous sands are exposed to air at these outcrops, and degradation may involve both oxic and anoxic processes (13). In early work, the bitumen in sands in contact with Athabasca River sediment was found to biodegrade faster than the bitumen exposed to river sediments that had no prior contact with oil sands, indicating the importance of local outcrop microbial communities (23). Since then there has been a significant effort in studying the microbial communities involved in the biodegradation of oil sands components (especially NAs), with a focus on oil sands tailings ponds (10, 11, 14–16, 18–21, 24). However, the microbial communities found in natural oil sands outcrops and the mechanisms through which these deal with the diversity of hydrocarbon components in bitumen have not received much attention. These are therefore the focus of the current contribution.
MATERIALS AND METHODS
Sample collection and site temperature measurement.
Samples were collected from natural oil sands outcrop sections along the Horse River (H) and Saline Creek (S) in the vicinity of Fort McMurray, Alberta, Canada. Samples collected in 2007 were mostly from outcrop cliffs (OC2007; a total of 2 kg). These were broken aseptically into small pieces (∼0.5 g) in the laboratory and were then mixed in Ziploc bags in lots of 100 g prior to freezing. Samples collected in 2011 were bitumen tablets both from the Horse River and Saline Creek outcrop cliffs (samples HC and SC, respectively) and from the river or creek bed (samples HR and SR, respectively; here samples from the river or creek bed are called river samples), as indicated in Table 1. These were stored individually in Ziploc bags. Ten of these (Table 1, samples HC1, HC2, HC3, SC1, SC2, SC3, HR1, HR2, SR1, and SR2) were used for further analysis. Samples were kept at ambient temperature until arrival in the laboratory, where the collected materials were processed and stored at −80°C. Freezing is not expected to affect the natural populations, as these are subject to multiple cycles of freezing and thawing in the course of a year. Because analyses of samples collected in 2007 indicated the unexpected presence of thermophiles, temperatures at the collection sites were measured in September 2011 using an Omegaette HH303 type K thermometer with two stainless steel thermoprobes of 6 in. (15.2 cm) in length and 1/16 in. (0.16 cm) in diameter. These were calibrated using constant-temperature water baths at 4 and 60°C. Temperatures were recorded with the probes either touching the outcrop surface or being suspended in the air approximately 5 cm above the surface. The average temperature was obtained from three independent readings.
TABLE 1.
Metadata for samples collected from Saline Creek and Horse River outcrop sections
| Sample name | Date of collection (day mo yr) | Sample description and/or sample size | Subsample(s) for DNA extractiond |
|---|---|---|---|
| Mixed outcrop samplea | 15–17 Aug 2007 | 2,000 g | OC2007 |
| Saline Creek cliff (SC1)b | 06 Sep 2011 | Tablet of 415 g | SC1_C, SC1_S |
| Saline Creek cliff (SC2)b | 06 Sep 2011 | Tablet of 333 g | SC2_C, SC2_S |
| Saline Creek cliff (SC3)b | 06 Sep 2011 | Tablet of 379 g | SC3_C, SC3_S |
| Saline Creek water (SR1)b | 06 Sep 2011 | Tablet of 233 g | SR1_C, SR1_S |
| Saline Creek water (SR2)b | 06 Sep 2011 | Tablet of 248 g | SR2_C, SR2_S |
| Horse River cliff (HC1)c | 07 Sep 2011 | Tablet of 294 g | HC1_C, HC1_S |
| Horse River cliff (HC2)c | 07 Sep 2011 | Tablet of 523 g | HC2_C, HC2_S |
| Horse River cliff (HC3)c | 07 Sep 2011 | Tablet of 365 g | HC3_C, HC3_S |
| Horse River cliff mixturec | 07 Sep 2011 | HC1 and HC3, all parts | HC_M |
| Horse River water (HR1)c | 07 Sep 2011 | Tablet of 585 g | HR1_C, HR1_S |
| Horse River water (HR2)c | 07 Sep 2011 | Tablet of 157 g | HR2_C, HR2_S |
| Horse River water mixturec | 07 Sep 2011 | HR1, all parts | HR_M |
Collected from Saline Creek and Horse River outcrop cliff and river sites.
Located at 56°41.677′N, 111°20.863′W.
Located at 56°42.379′N, 111°23.511′W.
Samples identified by the suffixes _C and _S were taken from the center and surface of bitumen tablets, respectively, as described in the text.
DNA extraction.
DNA was isolated from the combined OC2007 sample and from 10 individual tablets collected in 2011 (Table 1). The latter were cleaved so that they appeared like the tablet shown in Fig. 1D, and 0.5-g portions were taken aseptically, using a sterilized spatula, from the surface (depth, 0 to 0.5 cm) and the center (depth, 1 to 2 cm) parts for DNA extraction, resulting in a total of 23 samples (Table 2). This included sample mixtures HC_M (HC1 and HC3, all parts) and HR_M (HR1, all parts), which were used for metagenomic sequencing. The contents of four 2.0-ml microcentrifuge tubes each containing 0.5 g of a single sample were mixed with 978 μl of sodium phosphate buffer and 122 μl of MT buffer from a FastDNA spin kit for soil (MP Biomedicals). The tube contents were homogenized in the FastPrep instrument for 40 s at a speed setting of 6.0 m/s. They were centrifuged at 14,000 rpm (which was used throughout the study) for 10 min to pellet the debris, and the supernatants were transferred to fresh 2.0-ml microcentrifuge tubes and mixed with 250 μl protein precipitation solution by shaking the tubes by hand 10 times. Following centrifugation for 5 min, the four supernatants for the same sample were combined in a single 15-ml Falcon tube with 500 μl silica binding matrix and 500 μl 5.5 M guanidine thiocyanate (GTC). The contents of the Falcon tubes were then mixed by rotation end over end for 2 min on a rotating wheel to allow binding of DNA. Subsequently, the tubes were placed in a rack for 3 min to allow settling of the silica matrix; 500 μl of the supernatant was removed and discarded. Silica matrices were then resuspended, and 600 μl of the suspensions was transferred to spin filters. The spin filters were centrifuged for 1 min, and the catch tubes were emptied. This process was repeated until all of the silica matrix had passed through the spin filters. The silica binding matrices were then washed by treatment with 600 μl GTC solution, resuspension, and centrifugation. This process was repeated until the matrices regained their original color. The SEWS-M solution (500 μl) from the FastDNA spin kit was added to the pellets in spin filters, and these were resuspended by pipetting up and down. The tubes were centrifuged for 1 min, and the matrices were dried by centrifugation for 2 min. Subsequently, the spin filters were allowed to air dry for 5 min at room temperature. The binding matrices were resuspended in 100 μl of DNase- and pyrogen-free water (DEX) and incubated at 55°C in a heat block for 5 min. Finally, the DNA was eluted into 1.5-ml microcentrifuge tubes by centrifugation for 1 min. The DNA concentration was determined with a Qubit fluorometer using a Quant-iT double-stranded DNA HS assay kit (Invitrogen). The DNA was stored at −20°C for future use.
TABLE 2.
Summary of 16S/18S rRNA amplicon sequence data and derived diversity parameters for 23 oil sands outcrop samples and 4 enrichments
| Samplea | SRR accession no. | No. of quality control reads | % |
No. of quality control reads for prokaryotes | No. of OTUs |
Shannon's H indexb | Good's coverage (%) | No. of prokaryotic taxa | |||
|---|---|---|---|---|---|---|---|---|---|---|---|
| Archaea | Bacteria | Eukaryota | Prokaryotes (5% cutoff) | Total (Chao1 indexb) | |||||||
| HR_M | 1784302 | 8,797 | 0.54 | 97.25 | 2.23 | 8,601 | 952 | 875 | 4.72 | 95 | 310 |
| SR2_C | 621492 | 8,594 | 1.57 | 96.90 | 1.56 | 8,460 | 823 | 677 | 4.16 | 95 | 297 |
| HR2_C | 621565 | 9,575 | 1.31 | 97.54 | 1.17 | 9,463 | 858 | 561 | 4.34 | 95 | 287 |
| SR1_C | 621490 | 6,207 | 0.11 | 97.56 | 2.29 | 6,065 | 623 | 535 | 4.50 | 95 | 221 |
| SR2_S | 621625 | 4,318 | 1.36 | 94.00 | 4.63 | 4,118 | 925 | 1,063 | 5.42 | 88 | 306 |
| SR1_S | 621491 | 6,980 | 0.46 | 98.76 | 0.76 | 6,927 | 672 | 682 | 4.41 | 95 | 200 |
| HR2_S | 621566 | 12,771 | 0.69 | 99.14 | 0.20 | 12,746 | 906 | 762 | 3.93 | 97 | 277 |
| HR1_S | 621563 | 10,923 | 1.02 | 97.74 | 1.25 | 10,787 | 877 | 755 | 4.30 | 96 | 291 |
| HR1_C | 621559 | 5,568 | 1.17 | 96.94 | 1.89 | 5,463 | 528 | 455 | 3.59 | 95 | 238 |
| OC2007 | 621597 | 5,524 | 2.51 | 95.99 | 1.47 | 5,443 | 674 | 757 | 4.52 | 94 | 282 |
| HC_M | 1784301 | 5,564 | 16.38 | 80.09 | 3.54 | 5,367 | 260 | 237 | 3.22 | 98 | 147 |
| SC3_C | 621629 | 3,974 | 0.23 | 70.93 | 28.84 | 2,828 | 353 | 458 | 4.03 | 94 | 148 |
| SC3_S | 621626 | 7,267 | 0.03 | 71.65 | 28.32 | 5,209 | 449 | 419 | 3.99 | 96 | 150 |
| SC2_S | 621628 | 6,217 | 0.03 | 79.84 | 20.12 | 4,966 | 232 | 354 | 2.74 | 98 | 112 |
| SC2_C | 621627 | 4,046 | 0 | 76.14 | 23.85 | 3,081 | 165 | 222 | 2.86 | 97 | 87 |
| HC1_C | 621560 | 3,349 | 1.46 | 82.01 | 16.54 | 2,795 | 188 | 209 | 3.30 | 97 | 108 |
| SC1_S | 621624 | 2,405 | 0.63 | 62.66 | 36.72 | 1,522 | 149 | 247 | 3.28 | 95 | 86 |
| HC2_S | 621561 | 5,672 | 0 | 86.49 | 13.50 | 4,906 | 285 | 269 | 3.37 | 97 | 90 |
| HC3_S | 621567 | 8,113 | 0.01 | 90.70 | 9.29 | 7,359 | 244 | 187 | 3.12 | 99 | 84 |
| HC1_S | 621562 | 8,663 | 0.04 | 86.86 | 13.09 | 7,529 | 302 | 186 | 3.35 | 98 | 115 |
| HC3_C | 629322 | 1,490 | 28.26 | 70.39 | 1.34 | 1,470 | 173 | 307 | 3.67 | 94 | 118 |
| HC2_C | 629219 | 6,498 | 10.05 | 85.90 | 4.03 | 6,236 | 376 | 369 | 4.21 | 98 | 226 |
| SC1_C | 629218 | 6,772 | 11.95 | 86.91 | 1.17 | 6,693 | 357 | 308 | 3.96 | 98 | 225 |
| Oxic_4 | 629342 | 2,002 | 0 | 92.00 | 7.99 | 1,842 | 243 | 390 | 3.87 | 93 | 124 |
| Oxic_55 | 631218 | 4,406 | 0.11 | 99.73 | 0.16 | 4,399 | 331 | 162 | 2.06 | 98 | 83 |
| Anoxic_23 | 631221 | 5,277 | 49.67 | 50.09 | 0.25 | 5,264 | 152 | 326 | 2.68 | 96 | 150 |
| Anoxic_60 | 631220 | 4,561 | 45.88 | 52.44 | 1.67 | 4,485 | 225 | 257 | 2.99 | 98 | 128 |
| Sum | 171,101 | 159,487 | |||||||||
| Total | 4,750 | 723 | |||||||||
| Avg | 6.31 | 85.48 | 8.20 | 96 | |||||||
The samples are described in Table 1; Oxic_4, Oxic_55, Anoxic_23, and Anoxic_60 are enrichments of OC2007 at the indicated temperatures (4, 55, 23, and 60°C, respectively) in air (oxic) or in H2-CO2 (anoxic). The samples are listed from top to bottom in the same order as the branches in the dendrogram in Fig. 3A.
Biodiversity indices were calculated using a normalized number of 1,490 reads (observed for HC3_C).
Pyrosequencing of small-subunit rRNA amplicons.
PCR was performed using 12.5 pmol of primers 926f (AAA CTY AAA KGA ATT GRC GG) and 1392r (ACG GGC GGT GTG TRC) per 50-μl reaction mixture containing 0.1 to 10 ng of DNA template as well as 2.5 units of Taq or TopTaq DNA polymerase and the other reagents prescribed by the manufacturer (either Fermentas or Qiagen). PCR was for 25 cycles of 30 s at 95°C, 45 s at 55°C, and 90 s at 72°C with a final elongation of 10 min at 72°C (11). The amplicons were purified by agarose gel electrophoresis, using SYBR green to stain the gels. A QIAquick gel extraction kit was used to extract amplicons from the gel. The purified amplicons (1 to 30 ng) were used for a second PCR with FLX Titanium primers 454T_RA_X and 454T_FwB for 10 cycles as described above for the first PCR. The PCR amplicons were purified with an EZ-10 spin column PCR purification kit (Bio Basic Inc.) and then with a QIAquick PCR purification kit (Qiagen). The final products were quantified with a Qubit fluorometer. The purified 16S/18S rRNA amplicons (typically, 300 ng in 30 μl) were sent to the McGill University and Genome Quebec Innovation Centre, Montreal, Quebec, Canada, for pyrosequencing.
Analysis of amplicon pyrosequencing data.
Processing of raw 16S/18S rRNA sequences with the Phoenix2 16S rRNA pyrotag pipeline (25) eliminated sequences that (i) did not perfectly match the adaptor and primer sequences, (ii) had ambiguous bases, (iii) had an average quality score below 27, (iv) contained homopolymer lengths greater than 8, (v) were shorter than 200 bp after primer removal, or (vi) represented chimeric sequences. Quality-controlled sequences were clustered into operational taxonomic units (OTUs) at a 5% distance. Rarefaction curves and additional alpha diversity indices were calculated for each amplicon library, including the number of OTUs estimated with the Chao1 index (26); Shannon's diversity (H) index (27); and Good's coverage (G; in percent), calculated as G = 100[1 − (n/N)], where n is the number of singleton phylotypes and N is the total number of sequences in the sample (Table 2). The Bray-Curtis index was used as a measure of dissimilarity between communities, clustered into Newick-formatted trees using the unweighted pair group method using average linkages (UPGMA) algorithm implemented in the mothur software package (28). The sample relation tree in Newick format was visualized using MEGA software (29). The OTUs were assigned to taxa in the SILVA small-subunit rRNA database, release 108, using the RDP classifier. For network analysis (30), 44 orders present in more than 12 samples were selected, and their percent abundances were used to calculate the correlation values among these orders using the otu.association function of the mothur software package, version 1.27. Networks of orders were then built using positive correlation thresholds ranging from 0 to 1. A threshold of 0.6 was used to extract positively correlated orders, and the corresponding network was visualized with the Cytoscape program, version 2.8.3 (65).
Shotgun metagenome sequencing and data analysis.
Samples HC_M and HC_R, used for metagenomic sequencing of Horse River cliff and Horse River water communities, respectively, were broken up and mixed well, after which samples of 143 and 16.5 g, respectively, were used for DNA extraction using the FastDNA spin kit for soil. The combined DNAs (2,782 and 4,661 ng, respectively) were then subjected to CsCl gradient centrifugation. This additional step was added because it resulted in increased read lengths. Purified DNAs were subjected to pyrosequencing with a Genome Sequencer FLX instrument and a GS FLX Titanium series kit XLR70 (Roche Diagnostics Corporation) at the McGill University and Genome Quebec Innovation Centre, Montreal, Quebec, Canada, as described elsewhere (11).
Quality control of shotgun metagenomic reads removed sequences that (i) had ambiguous bases, (ii) had an average quality score below 25, (iii) contained homopolymer lengths greater than 6, (iv) were shorter than 100 bp, and (v) had artificial duplicates generated during the 454 sequencing identified using the UCLUST algorithm (31) with −id 0.90−idprefix 5 options. Functional genes encoding proteins involved in hydrocarbon degradation and methane cycling were sought in the remaining high-quality metagenomic reads using hidden Markov models (HMMs) with the Frame Shirt Tolerance algorithm on a TimeLogic Decypher system (Active Motif, Inc.) and a cutoff E value of 1e−5. Where available, HMMs downloaded from the Pfam database (32) and FunGene functional gene pipeline and repository (33) were used to identify gene families. In-house HMMs were made for genes for which no Pfam models existed and for which a minimum of four representative sequences were available in GenBank by aligning amino acid sequences using the T-Coffee server and curating the alignments using the GeneDoc program (34). Edited alignments were used as input to HMMER software to create HMMs (35).
The Tera-Tblastn algorithm on the TimeLogic Decypher system was used to screen fungal cytochrome P450 (CYP), lignin peroxidase, and manganese peroxidase gene reference sequences obtained from the Fungal Cytochrome P450 Database (36) and the fungal peroxidase database (37) against the quality-controlled metagenome reads. The retrieved metagenome reads of each gene family were searched against the sequences in the RefSeq protein-coding database using the Diamond blastx program (38) and a cutoff E value of 1e−5. The generated sequence alignment/map (SAM) format search results were imported into the MEGAN program (39) to explore the taxonomic composition of the functional genes. The gene counts were normalized by the hits of the RNA polymerase rpoB housekeeping gene (FunGene HMM).
Incubations of outcrop sample OC2007.
Incubations of outcrop sample OC2007 were at either a low (4 or 23°C) or a high (55 or 60°C) temperature. The high temperatures were either just above or just below the maximum temperatures measured on outcrop slopes (Fig. 2). Aliquots (10 g) of sample OC2007 were combined with 50 ml modified CSBK medium (see Table S1 in the supplemental material for the composition of modified CSBK medium) in 160-ml serum bottles. These were given a headspace of air and incubated at 4 or 55°C for 4 months (incubations Oxic_4 and Oxic_55, respectively), a headspace of N2-CO2 and incubated at 23 or 55°C for 7 months (incubations Anoxic_23 and Anoxic_55, respectively), or a headspace of 80% (vol/vol) H2 and 20% CO2 (H2-CO2) and incubated at 23 or 60°C for 4 months (incubations Anoxic_23 and Anoxic_60, respectively). Incubations were in the dark without shaking. The headspace oxygen or methane concentrations were determined by gas chromatography (GC), as described in the supplemental material. At the end of the incubations, bituminous sands were subjected to vigorous manual shaking for 2 min. The aqueous phase was then transferred to a 250-ml centrifuge bottle. The remaining solids were shaken three more times with 25-ml aliquots of sterile medium, at which point this remained clear, yielding about 125 ml in total. Biomass was collected by centrifugation with a Sorvall RC-5B refrigerated superspeed centrifuge at 12,000 rpm and 4°C for 30 min. The collected biomass was used for DNA extraction for microbial community analysis. The remaining bituminous sands were used for oil extraction and Fourier transform ion cyclotron resonance (FTICR) mass spectrometry (MS) analysis (18, 40).
FIG 2.

Oil sands outcrop surface and air temperatures at a west-facing Saline Creek outcrop and a south-facing Horse River outcrop near Fort McMurray as a function of time recorded on 6 September 2011 and 7 September 2011, respectively. Error bars indicate the standard errors of three measurements and are smaller than the symbol, when not shown.
Characterization of bitumen with FTICR-MS.
The bitumen contents of the OC2007 outcrop sample and of incubations of this sample were measured by extracting 10 g of outcrop material with 93% (vol/vol) dichloromethane and 7% (vol/vol) methanol, using a combination of vortexing and ultrasonic treatments. Extractions were continued until the extract became colorless; 10% of the extract was then left in an aluminum bowl to dry and to be weighed. The bitumen content was expressed as the number of milligrams of bitumen per gram of sample. The remaining extracts were analyzed with a Bruker Apex 12 T Fourier transform ion cyclotron resonance mass spectrometer (12T FTICR-MS) without further separation using electrospray ionization (ESI) in negative-ion mode (ESI-N) or in positive-ion mode (ESI-P), as described elsewhere (40). The extracted bitumen samples were diluted with equal parts of toluene and methanol to become whole oils. Immediately prior to the analysis, whole oils were spiked with a known amount of formic acid for ESI-P or ammonium hydroxide for ESI-N, as well as with Agilent ES turning mix. A syringe pump set at a flow rate of 240 μl/h was employed to inject the samples into the ESI source and the mass spectrometer. The ions entered the vacuum chamber of the MS through a glass capillary and were deflected 90 degrees to continue through the instrument into the magnet and ion cyclotron resonance (ICR) cell by ion optics (skimmers, funnels, quadrupole, and optics). A broadband swept-frequency excitation was applied to excite the ions to a detectable cyclotron radius. The ICR signals from the orbiting ions were induced and recorded by the two opposed detection electrodes of the ICR trap; 200 scans per sample were collected in a typical run to improve the experimental signal-to-noise ratio. The mass range was set between 165.88 and 1,400.00 Da. A calibration was run daily, and internal standards were included in each sample suite to ensure accuracy. The mass-resolving power (m/∆m50%, in which ∆m50% denotes mass-spectral-peak full width at half height) was higher than 500,000 at 400 Da for all experiments, and the mass accuracy was sub-parts per million (typically, less than 200 ppb). The data were processed with Composer software (Sierra Analytics) by recalibration and assigned to chemical molecular formulas, mainly as CcHhNnSsOo compounds (where c, h, n, s, and o represent the numbers of C, H, N, S, and O atoms, respectively). Ragnarök software (Aphorist Inc.), a data processing tool for quantitation, visualization, and interpretation of multisample FTICR-MS data, was used for data analysis and visualization.
Nucleotide sequence accession numbers.
The raw 16S/18S rRNA amplicon sequences are available from the Sequence Read Archive (SRA) at NCBI under the accession numbers listed in Table 2. As well, further data have been deposited in the SRA under accession numbers SRX327733 and SRX327734.
RESULTS
Temperatures at oil sands outcrop collection sites.
Samples were collected from the Horse River and Saline Creek outcrop cliffs (samples HC and SC, respectively) and from the river or creek bed (samples HR and SR, respectively). The former are exposed to more variable conditions with respect to temperature and water exposure in the form of rain or snow. The maximum temperatures reported by Environment Canada for Fort McMurray on 6 and 7 September 2011 were 27.2 and 31.0°C, respectively. On those days, the highest temperatures recorded between 2 and 4 p.m. in the air immediately above the outcrop surface were 33 and 38°C, respectively, whereas those at the outcrop surface were 57°C (Fig. 2). These high temperatures indicate that the bitumen-containing outcrop surface has effective heat-absorbing properties not unlike those of asphalt roads (41). Because yearly minimum temperatures in the Fort McMurray area are below −40°C, surficial cliff microbial communities are subject to a 100°C temperature differential in the course of a year. In contrast, the typical late summer water temperature of both Horse River and Saline Creek is 15°C.
Hence, during the summer, oil sands outcrop cliffs can reach temperatures suitable for thermophilic microbial growth. Under these conditions, the bitumen viscosity is considerably decreased from in excess of 1 million cP at 20°C to on the order of 10,000 cP at 60°C (2), causing bitumen to be fluid. The flow patterns at the outcrop suggested past bitumen fluidity (Fig. 1A, arrow), and flowing bitumen may enter the river, causing sections of still water to be covered with a sheen of oil (Fig. 1E).
A suspension of outcrop cliff samples in a limited volume of water (1 g/ml) gave a pH of 3 to 4 under aerobic conditions. Bitumen oil sands tablets in the river and creek would not be at such a low pH, as these are continuously flushed with fresh river and creek water.
Microbial richness and diversity.
A total of 171,101 good pyrosequencing reads were obtained for the V6-V8 16S/18S rRNA variable regions of DNAs extracted from the samples (Table 2). This included reads for Archaea, Bacteria, and Eukarya, as indicated in Table 2. Higher fractions of reads for Eukarya were observed in amplicon libraries from cliff samples (on average, 16.4%, with 79.2% Bacteria and 4.4% Archaea) than in amplicon libraries from river samples (on average, 1.7%, with 97.3% Bacteria and 1.0% Archaea). The low fractions of Archaea were not caused by primer bias. The primer pair used detects large fractions of Archaea, when present (11).
A total of 159,487 reads for Archaea and Bacteria were grouped into 4,750 operational taxonomic units (OTUs) at a cutoff of 5% (Table 2). The average Good's coverage of 96% suggested that the majority of the phylotypes present in the samples were identified (Table 2). The estimated total number of normalized OTUs detected in the libraries of river samples ranged from 455 to 1,063, whereas that in the libraries of cliff samples ranged from 186 to 458. This indicates a higher prokaryotic community diversity in the river samples than in the cliff samples. The normalized Shannon diversity index was also higher for amplicon libraries from river samples (3.59 to 5.42) than for amplicon libraries from cliff samples (2.74 to 4.21). Amplicon libraries derived from the surface and the center parts of the bitumen tablets had similar diversity parameters (Table 2).
Intersample comparison of the 16S/18S rRNA amplicon libraries.
Comparison of the amplicon library compositions through the use of a dendrogram, generated using the UPGMA algorithm clustering method with a distance cutoff of 0.42, indicated that the libraries for river and cliff samples clustered separately (Fig. 3A). All 9 libraries for microbial communities from river samples clustered together in the River_1 cluster, while 13 libraries for microbial communities from cliff samples formed a major cluster (Cliff_3, 10 libraries) and a minor cluster (Cliff_4, 3 libraries). The amplicon library for the mixed outcrop sample OC2007 was distinct (Fig. 3A, OC2007). Microbial community compositions at the surface and in the center of a sample were similar in only two cases (Fig. 3A, samples SC2_S and SC2_C and samples SC3_S and SC3_C) but were otherwise distinct. In particular, all libraries for cliff center samples HC3_C, HC2_C, and SC1_C from Cliff_4 had a large fraction of Archaea/Euryarchaeota (Fig. 3D; Table 2, 10.0 to 28.3%), which were less represented at the surface (Table 2, 0 to 0.6%).
FIG 3.

Analysis of pyrosequencing data for 16S/18S rRNA amplicon libraries from the oil sands outcrop samples listed in Tables 1 and 2. (A) Newick-formatted dendrogram of community compositions obtained using the UPGMA algorithm implemented in mothur indicating the four major clusters identified by red circles numbered 1 to 4 and referred to in the text as River_1, OC2007_2, Cliff_3, and Cliff_4, respectively. Mixed samples retrieved from the Horse River (HR_M) and the Horse River cliff (HC-M) were used for metagenome analysis and are indicated ( ). The relative abundances of eukaryotic phyla (B), proteobacterial classes (C), and major phyla other than Proteobacteria (D) are also shown.
The distribution of pyrosequencing reads over the archaeal, bacterial, and eukaryal taxa in the amplicon libraries for the 23 field samples is indicated in Fig. 4, taxa 1 to 34. The phylogenetic affiliation of each taxon was determined up to the genus level by comparison with the sequences in the SILVA 108 16S/18S rRNA database. Amplicon libraries from River_1 communities had large fractions of taxa 4, 7, 8, 10, 19, 21, 24, 26, 27, 29, and 32, which included Chitinophagaceae, Rhodocyclaceae, Comamonadaceae, and Sphingomonadaceae. These taxa were much less represented in cliff communities. Amplicon libraries representing Cliff_3 communities had large fractions of taxa 1 to 3, 5, 6, 11 to 13, 15, 16, 18, 25, and 33, which included Acetobacteraceae, Methylobacterium, Fungi_Protomyces, Beijerinckiaceae, Mycobacterium, Fungi_Coniosporium, and Acidobacterium, which were much less represented in River_1 communities. Rhizobiales from taxon 14 were present in large fractions in both communities. Libraries representing Cliff_4 communities had large fractions of taxa 9, 20, 22, 28, 30, and 31, including Methanoculleus, Clostridia_Lachnospiraceae_Incertae_Sedis, and Methanosaeta. These had a much more anaerobic signature than those found in River_1 and Cliff_3.
FIG 4.

Survey of predominant taxa in amplicon libraries of field samples displayed in the same order as in the dendrogram shown in Fig. 3. Taxa are ranked according to the average fraction of pyrosequencing reads (in percent). Only taxa with an average fraction in excess of 0.5% are shown. Fractions in excess of 1% are color coded according to clusters defined in Fig. 3 (green, River_1 cluster; yellow, OC2007_2 cluster; purple, Cliff_3 cluster; blue, Cliff_4 cluster). The sum of the numbers in each column is the fraction of the amplicon library that is represented.
The amplicon library for the OC2007 sample indicated a large fraction of the anaerobic thermophilic fermentative bacterium Clostridia_Thermoanaerobacter (Fig. 4, taxon 34). Other taxa with the term “thermo-” in their phylogenetic description and found in OC2007_2 included Caldanaerobacter, Methanothermobacter, Thermotoga, Thermomonas, Caldimicrobium, and Thermanaeromonas (see Table S2 in the supplemental material). Cliff_4 samples HC3_C, HC2_C, and SC1_C also had significant fractions (but smaller amounts than OC2007) of these thermophilic taxa (see Table S2 in the supplemental material), likely due to the high temperatures experienced on outcrop slopes (Fig. 2).
Cooccurrence analysis (30) indicated the presence of two distinct networks in cliff tablets (Fig. 5). Network I included 28 orders mainly consisting of aerobic hydrocarbon degraders (Burkholderiales, Flavobacteriales, Pseudomonadales, and Sphingomonadales), as well as anaerobic methanogens (Methanomicrobiales, Methanosarcinales, and Methanobacteriales), Clostridiales, and syntrophs (Syntrophobacterales and Anaerolineales). Network II included 12 aerobic orders, including the Eukaryota Dothideales, Erythrobasidiales, Microthamniales, Russulales, Sporadotrichida, Sporidiobolales, and Taphrinales, as well as the hydrocarbon-, C2-, or C1-oxidizing bacteria Rhizobiales (Beijerinckiaceae and Methylobacterium) and Rhodospirillales (Acetobacteraceae). Network II was widely distributed in cliff tablets, whereas network I was present in river samples and in the center of a subset of cliff samples represented by Cliff_4 (Fig. 6, samples HC2_C, HC3_C, and SC1_C). The surface of the tablets in this subset was still dominated by network II (Fig. 6).
FIG 5.

Compositions of networks I and II found by cooccurrence analysis of 44 orders in the amplicon libraries of oil sands samples (30). The nodes of the networks represent orders, whereas the edges (connections) indicate strong and significant correlations between nodes. The nodes and edges are mapped with different colors on the basis of the numbers of samples where orders (nodes) were detected and the degree of correlation, respectively. The orders Actinomycetales, Alteromonadales, Caulobacterales, and Planctomycetales did not show significant correlations with the indicated orders from the two networks.
FIG 6.

Percent distribution of networks I (blue bars) and II (red bars) shown in Fig. 5 in outcrop tablets representing the River_1, Cliff_3, or Cliff_4 cluster, as indicated in Fig. 3. Data are presented for samples from the surface (which have an _S suffix) or from the center (which have a _C suffix) of each tablet.
Shotgun metagenomic analysis.
The metabolic potentials of the microbial communities in the river and cliff samples were investigated using mixed river (HR_M) and cliff (HC_M) samples collected at Horse River in 2011. The average concentration of DNA extracted from HR_M samples (282 ± 117 ng/g; n = 2) was higher than that of DNA extracted from HC_M samples (19.5 ± 13.3 ng/g; n = 15). The 16S/18S rRNA pyrotag results showed that the microbial communities of samples HR_M and HC_M clustered with the River_1 and Cliff_3 communities, respectively (Fig. 3A), indicating that these are representative of the microbial communities in river and cliff samples.
A total of 548,460 and 436,518 quality-controlled reads were obtained from samples HC_M and HR_M, respectively, and their average lengths were 773 and 779 bp, respectively (Table 3). The 420 and 278 16S rRNA gene sequences identified in HC_M and HR_M, respectively, mostly represented Bacteria. For the 18S rRNA genes, a total of 139 and 15 sequences were detected in HC_M and HR_M, respectively, of which 64% and 13%, respectively, represented fungal sequences. This confirmed the elevated presence of fungi in cliff samples. At the order level, the microbial community compositions indicated by the amplicon and metagenomic data were similar for HR_M but not for HC_M, which had a higher proportion of orders from network II and a lower proportion of orders from network I in the metagenomic composition data (see Table S4 in the supplemental material).
TABLE 3.
Statistical summary of oil sands outcrop metagenomes for cliff (HC_M) and river water (HC_R) samples and summary of sequence counts for key metabolic genes relative to rpoBa
| Feature | Database searchb | Result for sample: |
|
|---|---|---|---|
| HC_M | HR_M | ||
| SRA accession no. | SRX327733 | SRX327734 | |
| No. of base pairs sequenced after quality control | 423,985,802 | 340,253,804 | |
| No. of reads after quality control | 548,460 | 436,518 | |
| Average read length (bp) | 773 | 779 | |
| No. of 16S rRNA gene reads | 420 | 278 | |
| Bacteria (%) | 94.52 | 99.28 | |
| Archaea (%) | 0.24 | 0 | |
| No. of 18S rRNA gene reads | 139 | 15 | |
| Fungi (%) | 63.59 | 13.33 | |
| Other eukaryotes (%) | 35.25 | 86.67 | |
| Pathway or enzyme class | |||
| Dioxygenases | |||
| Dioxygenase | PF00775 | 2.95 | 2.33 |
| Catechol dioxygenase | PF04444 | 1.42 | 0.8 |
| Protocatechuate 3,4-dioxygenase | PF12391 | 1.15 | 0.36 |
| Cytochrome P450 monooxygenases | |||
| CYP52 | FCPD | 13.2 | 4.08 |
| CYP53 | FCPD | 15.82 | 4.52 |
| CYP504 | FCPD | 10.42 | 4.52 |
| Manganese peroxidases | fPoxDB | 0.44 | 0.51 |
| Laccases | blast | 9.82 | 8.09 |
| Anaerobic degradation of aromatics | |||
| Benzylsuccinate synthase (bssABCDEF) | HMM | 0 | 0.07 |
| Ethylbenzene dehydrogenase (EB_dh) | PF09459 | 0 | 0.22 |
| Class I Benzoyl-CoA reductase (brcABCD) | HMM | 0 | 0.29 |
| Class II Benzoyl-CoA reductase (bamBCDEFGHI) | HMM | 0 | 0.22 |
| CH4 cyclec | |||
| Particulate methane monooxygenase (pmoA) | PF14100 | 0.38 | 0.73 |
| Soluble methane monooxygenase (mmoX) | FunGene | 0.05 | 0 |
| Sulfur oxidation and assimilation | |||
| soxY | PF13501 | 1.04 | 1.53 |
| soxZ | PF08770 | 0.93 | 0.66 |
A total of 1,833 and 1,372 hits of the rpoB gene were obtained for HC_M and HR_M, respectively.
Abbreviations for database searches: PF, HMM search against the Pfam seed database; FunGene, HMM search against FunGene database; HMM, HMM search against customer-created functional gene HMM; FCPD, blast search against the Fungal Cytochrome P450 Database; fPoxDB, blast search against the Fungal Peroxidase Database; blast, blast search against customer-created functional gene database. PF numbers, Pfam protein accession numbers.
No genes for methanogenesis (e.g., mcrA) were found.
Genes for aromatic di- and mono-oxygenases, which incorporate both oxygen atoms or one oxygen atom from O2 into mono- or polyaromatic hydrocarbons (42), and for protocatechuate 3,4-dioxygenase were found in both metagenomic libraries, with a higher relative abundance of monooxygenases and of protocatechuate 3,4-dioxygenases being found in HC_M (Table 3). Taxonomic assignment indicated that all were of bacterial origin (see Table S5 in the supplemental material). Fungi attack PAHs with cytochrome P450 (P450) monooxygenases and with soluble extracellular enzymes, including lignin peroxidase, manganese peroxidase, and laccase (43). Of these, the CYP52, CYP53, and CYP504 P450s, known to be involved in hydrocarbon degradation (44), had higher relative abundances in HC_M than in HR_M (Table 3). Fungal manganese peroxidases and laccases were detected with similar abundances in both metagenomes (Table 3).
Under anoxic conditions aromatic compounds are metabolized through alternate pathways, including fumarate addition, O2-independent hydroxylation, and carboxylation. Genes for benzylsuccinate synthase (bssABCDE), ethylbenzene dehydrogenase (EB_dh), ATP-dependent class I benzoyl coenzyme A (CoA) reductase (brcABCD), and ATP-independent class II benzoyl-CoA reductase (bamBCDEFGHI) were found in HR_M at low frequencies but not in HC_M (Table 3). We did not find sequences for key metabolic genes involved in methanogenesis (e.g., mcrA) in either of the metagenome libraries. However, genes for particulate methane monooxygenase (pmoA) were found in both metagenomes (Table 3). The presence of genes for sulfur oxidation enzymes (soxY and soxZ) in both metagenomic libraries may explain the low pH (3 to 4) of suspensions of outcrop cliff samples in water as being caused by the oxidation of reduced sulfur minerals (e.g., sulfides) to sulfuric acid by these enzymes. Low-pH conditions would stimulate acidophilic Acetobacteraceae and Acidobacteria (Fig. 4, taxa 1, 3, 13, 16, and 27) (45, 46), which were highly represented, especially in Cliff_3 communities.
Microbial communities in low- and high-temperature incubations.
Because of the presence of potentially thermophilic taxa (Fig. 4; see also Table S2 in the supplemental material), OC2007 was tested for community shifts at a low or high temperature. Incubations of 10 g of OC2007 in 50 ml CSBK medium at 4 and 55°C (incubations Oxic_4 and Oxic_55, respectively) were flushed with air every 2 weeks, and following 4 months of incubation, bitumen degradation was evaluated by FTICR-MS. Determination of headspace oxygen concentrations (see the supplemental material) indicated that these incubations did not become oxygen depleted (results not shown). Duplicate anoxic incubations with a headspace of N2-CO2 at either 23 or 55°C were monitored for the production of headspace methane for 7 months, but none was found. Duplicate incubations were therefore also done with a headspace of H2-CO2 at 23 and 60°C (incubations Anoxic_23 and Anoxic_60, respectively). After 4 months, the Anoxic_23 incubations had 54 and 13 μmol/liter of methane. The Anoxic_60 incubations had 2.1 and 1.4 μmol/liter of methane, similar to the values observed in controls without added OC2007.
The microbial community data obtained from pyrosequencing of the 16S rRNA amplicons at the end of the 4-month incubation period are summarized in Table S3 in the supplemental material. Both incubations of Oxic_55 had large fractions of Pedomicrobium, Anoxybacillus, Thermaerobacter, and Geobacillus. Of these, Anoxybacillus, Thermaerobacter, and Geobacillus are described to be strictly aerobic, obligate thermophiles, consistent with their presence in high-temperature oxic incubations. The low-temperature anoxic incubations shared large fractions of Geobacter, Micrococcineae, Burkholderia, Syntrophobacter, Sphingomonas, and Massilia. Only one of these incubations (Anoxic_23_1) had a large fraction of the methanogen Methanosarcina (50%; see Table S3 in the supplemental material), which likely contributed to the production of 54 μmol/liter of methane in the headspace of this incubation. The high-temperature incubations Anoxic_60_1 and Anoxic_60_2 had large fractions of Ralstonia, Methanosaeta, Sphingomonas, Burkholderia, Methanoculleus, Sediminibacterium, and Methanobacterium (see Table S3 in the supplemental material). Hence, methanogens were present despite the lack of significant net methane production. Sphingomonas and the methanogenic genera Methanoculleus and Methanobacterium have previously been described in high-temperature oil reservoirs (47).
Bitumen transformation in incubations monitored by FTICR-MS.
The bitumen extraction yield of the OC2007 outcrop and its incubated subsamples was 9.7% ± 1.6% (wt/wt; n = 9). Significant changes in bitumen composition were observed in the acidic fraction measured in the ESI-N mode for Oxic_55_1 and Oxic_55_2 incubated for 4 months at 55°C, but not for Oxic_4_1 and Oxic_4_2 incubated at 4°C (Fig. 7, O55_1, O55_2, O4_1, and O4_2, respectively). The last two had double-bond-equivalent (DBE) distribution patterns, which were nearly identical to those observed for the original bitumen for all compound classes, indicating low, if any, biodegradation activity.
FIG 7.

FTICR-MS analysis of bitumen extracted from oxic incubations. The distributions of O1 (A), O2 (B), O3 (C), and O4 (D) heteroatom class compounds, likely representing alkylated alcohols (A), carboxylic acids (B), hydroxy-carboxylic acids (C), and dicarboxylic acids and/or dihydroxy-carboxylic acids (D), respectively, are shown. Compounds are sorted as groups of species with common double bond equivalents (DBEs), which are and plotted versus the fraction of the heteroatom class ion response of each DBE compound group (18, 40). The sum of intensities of all DBE groups of the heteroatom class was set equal to 1. The spectra shown are for extracts of the original bitumen and of residual bitumen after incubation for 4 months at 4°C (O4_1 and O4_2, respectively) or at 55°C (O55_1 and O55_2, respectively).
For both O55_1 and O55_2, significant compositional changes were observed in the O1 class, indicating an increase in bi- to tetracyclic alcohols, as well as in the O2 class, mainly of species of the DBE3 group (Fig. 7A and B). These could represent bicyclic naphthenic acids (NAs), which are more resistant to biodegradation than most other saturated hydrocarbons (48, 49), resulting in their enrichment in severely biodegraded hydrocarbon deposits like those found in the oil sands outcrops. O55_1 and O55_2 also had increases in the DBE2 and DBE3 groups of species of the O3 class, likely representing hydroxy-carboxylic acids, and of DBE3 and DBE4 groups of species of the O4 class, likely consisting of dihydroxy-carboxylic acids and/or dicarboxylic acids (Fig. 7C and D).
Incubations under anaerobic conditions showed only minor, if any, compositional changes of oxygen-containing compound classes (see Fig. S1 in the supplemental material). Neither of the replicates incubated at 23 or at 60°C showed any DBE group distribution changes for the O1 and O3 compound classes, whereas minor changes in the DBE group distribution were observed for the O2 compound class. Species of the DBE3 group were slightly enriched compared to their numbers in the original bitumen sample (see Fig. S1B in the supplemental material), as shown in more detail in Fig. S1D in the supplemental material.
Hence, samples incubated under oxic conditions at 55°C showed the most significant oxidation, while incubations under oxic conditions at 4°C or under anoxic conditions at 23 or at 60°C showed no or only minor changes.
DISCUSSION
In situ biodegradation of bitumen in the Alberta oil sands is slow because of its high viscosity and its composition. Bitumen viscosity is strongly dependent on temperature, with values in excess of 106 cP being expected at 10°C, the resident temperature at depths of 200 to 300 mbs, where most bitumen is located (1–3, 5). The recalcitrance of bitumen to continued biodegradation due to the near absence of low-molecular-weight components and the high structural diversity of its HMW components has already been mentioned (1–21). Biodegradation may increase in oil field outcrops, which offer two distinct degradation scenarios for bitumen-containing oil sands tablets on the cliffs and in the rivers (Fig. 1). Tablets on the cliffs are subject to variable conditions with respect to temperature (−40 to +60°C), water availability, and pH, whereas these conditions are expected to be less variable in the rivers. The harsher conditions cause the microbial populations in the cliffs to be smaller than those in the rivers, as indicated by average concentrations of extracted DNA of 19.5 ± 13.3 ng/g and 282 ± 117 ng/g, respectively. Both of these concentrations are higher than those extracted from oil sands cores retrieved from 200 to 300 mbs, which yielded 1 ng/g (11). At an assumed average genome size of 3 × 10⁶ bp, these values translate into microbial numbers of approximately 6 × 10⁶/g and 8 × 10⁷/g for cliff and river bitumen tablets, respectively, and 3 × 10⁵/g for subsurface cores. These estimates ignore potential differences in DNA extraction efficiency, which are unknown.
Analysis of 16S rRNA genes indicated that network I was found at the surface and in the center of all (4/4) river tablets. Network I includes orders of aerobic hydrocarbon degraders and anaerobic methanogens and syntrophs, with the latter being scarce in river tablets. Network II, which includes aerobic bacteria and fungi but which lacks orders of anaerobic organisms, was found at the surface of all tablets and in the center of 3 of 6 cliff tablets (Fig. 3 to 6; Table 2). The other 3 of 6 cliff tablets had a center that was dominated by the anaerobic component of network I, as indicated schematically in Fig. 8. The implication of these findings is that bitumen degradation on outcrop cliffs is a predominantly aerobic process with a minor anaerobic contribution. Bitumen degradation in this environment may be initiated by fungi, which randomly attack the diversity of bitumen hydrocarbons through cytochrome P450 monooxygenases and other oxidative enzymes, yielding products which are also metabolized through the action of bacterial dioxygenases (Table 3). Bitumen degradation in the river is also a predominantly aerobic process with a potentially smaller involvement of fungi. The low counts of genes for enzymes involved in anaerobic hydrocarbon degradation (Table 3) also indicate that, in comparison to the prevalence of aerobic degradation, this is not a prevalent process in oil sands outcrops.
FIG 8.
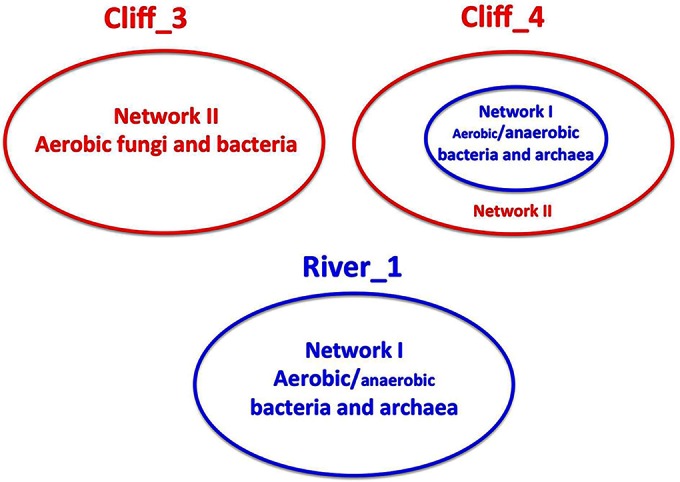
Schematic representation of microbial community compositions in outcrop bitumen tablets. The predominance of aerobic or anaerobic Bacteria and Archaea in cliff tablets is indicated by different font sizes.
There is good evidence in the literature that the biodegradation of HMW hydrocarbons is promoted by consortia of fungi and bacteria. Although pure cultures of Mycobacterium, Rhodococcus, Burkholderia, Stenotrophomonas, and Sphingomonas can degrade HMW PAHs such as pyrene, benzo[b]fluorene, and benz[a]anthracene (13, 17, 43, 50), biodegradation rates were significantly increased in fungal-bacterial cocultures (51). The role of fungi in these cocultures is thought to be the catalysis of extracellular oxidative reactions through enzymes similar to those used in lignin degradation (51–56), including fungal P450 monooxygenases (55). Random microbial preoxidation is a necessary prerequisite comparable to the chemical preoxidation (ozonation) required for the more effective metabolism of the high diversity of naturally occurring NAs (19–21). The involvement of oxidative exoenzymes of the fungus Pestalotiopsis in the biotransformation of extra-heavy crude oil has been demonstrated (63), and this organism has also been shown to be involved in the enhanced biodegradation of asphalt (64). The split of the bioenergetic benefits of bitumen degradation between the two main consortium components, fungi and bacteria, is not yet understood. We cannot derive this from the relative fractions of fungi and bacteria obtained from pyrosequencing surveys, because bitumen may not be the only carbon and energy source available in oil sands outcrops. Photosynthesis-derived carbohydrates may also feed these communities.
The 100-fold decrease in bitumen viscosity from 106 cP at 20°C to 104 cP at 60°C (2) offers a strong incentive for thermophilic bitumen biodegradation. Indeed, oxidation of bitumen components was demonstrated by FTICR-MS in 4-month aerobic laboratory incubations at 55°C but not at 4°C (Fig. 7). The thermophilic Bacteria potentially responsible for these oxidations were identified (see Table S3 in the supplemental material). Significant fractions of thermophilic Archaea or Eukaryota were not found, indicating that fungi may not have contributed to these high-temperature oxidations. Increased aerobic degradation at higher temperatures may deplete oxygen from the center of bitumen-containing sandstone tablets, giving these a more anaerobic microbial signature, as in the Cliff_4 communities (Fig. 3, 6, and 8). Anaerobic Firmicutes and Thermotogae, together with thermophilic methanogens (Methanothermobacter), may then initiate water-mediated hydrocarbon degradation under these conditions, as previously described for consortia of syntrophs and methanogens in mesophilic environments (8, 59). Unfortunately, we have not been able to demonstrate significant methane formation from bitumen at either 23°C or 55°C in incubations with an N2-CO2 atmosphere. If methane is formed in the center of a bitumen sandstone tablet under in situ conditions, it may be reoxidized at the surface by methane-oxidizing Beijerinckiaceae (Fig. 4, taxon 6) and methanol-oxidizing Methylobacterium (Fig. 4, taxon 2) (57, 58). High-temperature conditions are experienced in outcrops for only a limited amount of time each summer, after which thermophiles remain dormant for the remainder of the year. The long-term dormancy of thermophiles has been demonstrated in other environments, e.g., in arctic marine sediments (60).
Microbial communities in oil sands outcrops are part of a unique ecosystem of which the functioning is still poorly understood. Other ecosystems that contain comparable highly diverse HMW hydrocarbons are marine tar balls (61) and asphalt lakes (62). Although the chemical and physical aspects of HMW hydrocarbon degradation in marine tar balls have been well described and biodegradation is suspected, no microbial community compositions have been reported (61). Asphalt lakes harbor small droplets of water, which were shown to have a subsurface origin and which contained a microbial community of 17 identified orders (62), of which all but 3 were also found to be major orders in the present study. The high diversity of hydrocarbon components in the asphalt (bitumen) present in the lake necessitated the use of FTICR-MS for identification of potential microbial oxidation products, as in the present study. The presence of specific microbes has not been related to the oxidation of specific HMW hydrocarbon components in either of these systems.
In summary, we have demonstrated that the bitumen in oil sands outcrop cliffs is degraded by consortia of fungi and bacteria. These cliffs can reach high temperatures of up to 60°C in the summer months, causing bitumen to be more fluid and biodegradable. Increased oxidation of bitumen components by a mostly bacterial consortium at 55°C was demonstrated under laboratory conditions. Outcrop communities have 20-fold (cliff) and 280-fold (river) higher biomass concentrations than subsurface communities, which are at a constant low temperature. An intriguing question for future research is whether enhanced microbial activity can be achieved by limited subsurface heating and oxygenation and whether such activity can decrease bitumen viscosity to allow improved production with decreased energy input.
Supplementary Material
ACKNOWLEDGMENTS
This work was supported by an NSERC Industrial Research Chair Award to G.V., who was also supported by BP America Production Co., Baker Hughes Canada, Computer Modeling Group Limited, ConocoPhillips Company, Dow Microbial Control, Enbridge, Enerplus Corporation, Intertek, Oil Search (PNG) Limited, Shell Global Solutions International, Suncor Energy Inc., and Yara Norge AS, as well as by Alberta Innovates—Energy and Environment Solutions. This work was also funded by Genome Canada, Genome Alberta, the Government of Alberta and Genome BC, the Canada Foundation for Innovation (CFI), and the Canada Research Chairs program.
We thank Jane Fowler for her contribution of the HMM for functional genes involved in anaerobic hydrocarbon degradation. We are grateful for the administrative support provided by Rhonda Clark and for discussions on metagenomics with Marc Strous.
Footnotes
Supplemental material for this article may be found at http://dx.doi.org/10.1128/AEM.02221-15.
REFERENCES
- 1.Masliyah J, Zhou Z, Xu Z, Czarnecki J, Hamza H. 2004. Understanding water-based bitumen extraction from Athabasca oil sands. Can J Chem Eng 82:628–654. [Google Scholar]
- 2.Adams JJ, Larter SR, Bennett B, Huang H, Westrich J, van Kruisdijk C. 2013. The dynamic interplay of oil mixing, charge timing, and biodegradation in forming the Alberta oil sands: insights from geologic modeling and biogeochemistry, p 23–102. In Hein FJ, Leckie D, Larter S, Suter J (ed), Heavy-oil and oil-sand petroleum systems in Alberta and beyond. AAPG studies in geology 64. American Association of Petroleum Geologists, Tulsa, OK. [Google Scholar]
- 3.Tozer R, Choi A, Pietras J, Tanasichuk D. 2014. Athabasca oil sands: mega-trap restoration and charge timing. AAPG Bull 98:429–447. doi: 10.1306/08071313039. [DOI] [Google Scholar]
- 4.Larter S, Head I. 2014. Oil sands and heavy oil: origin and exploitation. Elements 10:277–284. doi: 10.2113/gselements.10.4.277. [DOI] [Google Scholar]
- 5.Evans CR, Rogers MA, Bailey NJL. 1971. Evolution and alteration of petroleum in western Canada. Chem Geol 8:147–170. doi: 10.1016/0009-2541(71)90002-7. [DOI] [Google Scholar]
- 6.Bailey NJL, Jobson AM, Rogers MA. 1973. Bacterial degradation of crude oil: comparison of field and experimental data. Chem Geol 11:203–221. doi: 10.1016/0009-2541(73)90017-X. [DOI] [Google Scholar]
- 7.Rubinstein I, Strausz OP, Spyckerelle C, Crawford RJ, Westlake DWS. 1977. The origin of the oil sands bitumens of Alberta: a chemical and microbiological simulation study. Geochim Cosmochim Acta 41:1341–1353. doi: 10.1016/0016-7037(77)90077-1. [DOI] [Google Scholar]
- 8.Head IM, Jones DM, Larter S. 2003. Biological activity in the deep subsurface and the origin of heavy oil. Nature 426:344–352. doi: 10.1038/nature02134. [DOI] [PubMed] [Google Scholar]
- 9.Bennett B, Adams JJ, Gray ND, Sherry A, Oldenburg TBP, Huang H, Larter SR, Head IM. 2013. The controls on the composition of biodegraded oils in the deep subsurface. Part 3. The impact of microorganism distribution on petroleum geochemical gradients in biodegraded petroleum reservoirs. Org Geochem 56:94–105. [Google Scholar]
- 10.An D, Brown D, Chatterjee I, Dong X, Ramos-Padron E, Wilson S, Bordenave S, Caffrey SM, Gieg LM, Sensen CW, Voordouw G. 2013. Microbial community and potential functional gene diversity involved in anaerobic hydrocarbon degradation and methanogenesis in an oil sands tailings pond. Genome 56:612–618. doi: 10.1139/gen-2013-0083. [DOI] [PubMed] [Google Scholar]
- 11.An D, Caffrey SM, Soh J, Agrawal A, Brown D, Budwill K, Dong X, Dunfield PF, Foght J, Gieg LM, Hallam SJ, Hanson NW, He Z, Jack TR, Klassen J, Konwar KM, Kuatsjah E, Li C, Larter S, Leopatra V, Nesbø CL, Oldenburg T, Pagé AP, Ramos-Padron E, Rochman FF, Saidi-Mehrabad A, Sensen CW, Sipahimalani P, Song YC, Wilson S, Wolbring G, Wong ML, Voordouw G. 2013. Metagenomics of hydrocarbon resource environments indicates aerobic taxa and genes to be unexpectedly common. Environ Sci Technol 47:10708–10717. doi: 10.1021/es4020184. [DOI] [PMC free article] [PubMed] [Google Scholar]
- 12.Shuqing Z, Haiping H, Yuming L. 2008. Biodegradation and origin of oil sands in the Western Canadian Sedimentary Basin. Pet Sci 5:87–94. doi: 10.1007/s12182-008-0015-3. [DOI] [Google Scholar]
- 13.Cerniglia CE. 1993. Biodegradation of polycyclic aromatic hydrocarbons. Curr Opin Biotechnol 4:331–338. doi: 10.1016/0958-1669(93)90104-5. [DOI] [Google Scholar]
- 14.Clemente JS, Fedorak PM. 2005. A review of the occurrence, analyses, toxicity, and biodegradation of naphthenic acids. Chemosphere 60:585–600. doi: 10.1016/j.chemosphere.2005.02.065. [DOI] [PubMed] [Google Scholar]
- 15.Johnson RJ, West CE, Swaih AM, Folwell BD, Smith BE, Rowland SJ, Whitby C. 2012. Aerobic biotransformation of alkyl branched aromatic alkanoic naphthenic acids via two different pathways by a new isolate of Mycobacterium. Environ Microbiol 14:872–882. doi: 10.1111/j.1462-2920.2011.02649.x. [DOI] [PubMed] [Google Scholar]
- 16.Demeter MA, Lemire J, George I, Yue G, Ceri H, Turner RJ. 2014. Harnessing oil sands microbial communities for use in ex situ naphthenic acid bioremediation. Chemosphere 97:78–85. doi: 10.1016/j.chemosphere.2013.11.016. [DOI] [PubMed] [Google Scholar]
- 17.Maeda AH, Nishi S, Hatada Y, Ozeki Y, Kanaly RA. 2014. Biotransformation of the high-molecular weight polycyclic aromatic hydrocarbon (PAH) benzo[k]fluoranthene by Sphingobium sp. strain KK22 and identification of new products of nonalternant PAH biodegradation by liquid chromatography electrospray ionization tandem mass spectrometry. Microb Biotechnol 7:114–129. doi: 10.1111/1751-7915.12102. [DOI] [PMC free article] [PubMed] [Google Scholar]
- 18.Barrow MP, Peru KM, Fahlman B, Hewitt LM, Frank RA, Headley JV. 2015. Beyond naphthenic acids: environmental screening of water from natural sources and the Athabasca oil sands industry using atmospheric pressure photoionization Fourier transform ion cyclotron resonance mass spectrometry. J Am Soc Mass Spectrom 26:1508–1521. doi: 10.1007/s13361-015-1188-9. [DOI] [PubMed] [Google Scholar]
- 19.Brown LD, Pérez-Estrada L, Wang N, El-Din MG, Martin JW, Fedorak PM, Ulrich AC. 2013. Indigenous microbes survive in situ ozonation improving biodegradation of dissolved organic matter in aged oil sands process-affected waters. Chemosphere 93:2748–2755. doi: 10.1016/j.chemosphere.2013.09.026. [DOI] [PubMed] [Google Scholar]
- 20.Pérez-Estrada LA, Han X, Drzewicz P, Gamal El-Din M, Fedorak PM, Martin JW. 2011. Structure-reactivity of naphthenic acids in the ozonation process. Environ Sci Technol 45:7431–7437. doi: 10.1021/es201575h. [DOI] [PubMed] [Google Scholar]
- 21.Shi Y, Huang C, Rocha KC, El-Din MG, Liu Y. 2015. Treatment of oil sands process-affected water using moving bed biofilm reactors: with and without ozone pretreatment. Bioresour Technol 192:219–227. doi: 10.1016/j.biortech.2015.05.068. [DOI] [PubMed] [Google Scholar]
- 22.Hein FJ, Langenberg CW, Kidston C, Berhane H, Berzniuk T. 2001. A comprehensive field guide for facies characterization of the Athabasca oil sands, northeast Alberta, p 1–415. Special report 13. Alberta Energy and Utilities Board, Edmonton, Alberta, Canada. [Google Scholar]
- 23.Wyndham RC, Costerton JW. 1981. Heterotrophic potentials and hydrocarbon biodegradation potentials of sediment microorganisms within the Athabasca oil sands deposit. Appl Environ Microbiol 41:783–790. [DOI] [PMC free article] [PubMed] [Google Scholar]
- 24.Yergeau E, Lawrence JR, Sanschagrin S, Waiser MJ, Korber DR, Greer CW. 2012. Next-generation sequencing of microbial communities in the Athabasca River and its tributaries in relation to oil sands mining activities. Appl Environ Microbiol 78:7626–7637. doi: 10.1128/AEM.02036-12. [DOI] [PMC free article] [PubMed] [Google Scholar]
- 25.Soh J, Dong X, Caffrey SM, Voordouw G, Sensen CW. 2013. Phoenix 2: a locally installable large-scale 16S rRNA gene sequence analysis pipeline with web interface. J Biotechnol 167:393–403. doi: 10.1016/j.jbiotec.2013.07.004. [DOI] [PubMed] [Google Scholar]
- 26.Chao A. 1984. Nonparametric estimation of the number of classes in a population. Scand J Stat 11:265–270. [Google Scholar]
- 27.Shannon CE. 1948. A mathematical theory of communication. Bell Syst Technol J 27:379–423. doi: 10.1002/j.1538-7305.1948.tb01338.x. [DOI] [Google Scholar]
- 28.Schloss PD, Westcott SL, Ryabin T, Hall JR, Hartmann M, Hollister EB, Lesniewski RA, Oakley BB, Parks DH, Robinson CJ, Sahl JW, Stres B, Thallinger GG, Van Horn DJ, Weber CF. 2009. Introducing mothur: open-source, platform-independent, community-supported software for describing and comparing microbial communities. Appl Environ Microbiol 75:7537–7541. doi: 10.1128/AEM.01541-09. [DOI] [PMC free article] [PubMed] [Google Scholar]
- 29.Tamura K, Peterson D, Peterson N, Stecher G, Nei M, Kumar S. 2011. MEGA5: molecular evolutionary genetics analysis using maximum likelihood, evolutionary distance, and maximum parsimony methods. Mol Biol Evol 28:2731–2739. doi: 10.1093/molbev/msr121. [DOI] [PMC free article] [PubMed] [Google Scholar]
- 30.Barberán A, Bates ST, Casamayor EO, Fierer N. 2012. Using network analysis to explore co-occurrence patterns in soil microbial communities. ISME J 6:343–351. doi: 10.1038/ismej.2011.119. [DOI] [PMC free article] [PubMed] [Google Scholar]
- 31.Edgar RC. 2010. Search and clustering orders of magnitude faster than BLAST. Bioinformatics 26:2460–2461. doi: 10.1093/bioinformatics/btq461. [DOI] [PubMed] [Google Scholar]
- 32.Finn RD, Bateman A, Clements J, Coggill P, Eberhardt RY, Eddy SR, Hetherington K, Holm L, Mistry J, Sonnhammer ELL, Tate J, Punta M. 2014. Pfam: the protein families database. Nucleic Acids Res 42:D222–D230. doi: 10.1093/nar/gkt1223. [DOI] [PMC free article] [PubMed] [Google Scholar]
- 33.Fish JA, Chai B, Wang Q, Sun Y, Brown CT, Tiedje JM, Cole JR. 2013. FunGene: the functional gene pipeline and repository. Front Microbiol 4:291. doi: 10.3389/fmicb.2013.00291. [DOI] [PMC free article] [PubMed] [Google Scholar]
- 34.Nicholas KB, Nicholas HB Jr, Deerfield DW II. 1997. GeneDoc: analysis and visualization of genetic variation. EMBNEWNEWS 4:14. [Google Scholar]
- 35.Eddy SR. 1998. Profile hidden Markov models. Bioinformatics 14:755–763. doi: 10.1093/bioinformatics/14.9.755. [DOI] [PubMed] [Google Scholar]
- 36.Moktali V, Park J, Fedorova-Abrams ND, Park B, Choi J, Lee Y-H, Kang S. 2012. Systematic and searchable classification of cytochrome P450 proteins encoded by fungal and oomycete genomes. BMC Genomics 13:525. doi: 10.1186/1471-2164-13-525. [DOI] [PMC free article] [PubMed] [Google Scholar]
- 37.Choi J, Détry N, Kim KT, Asiegbu FO, Valkonen JP, Lee YH. 2014. fPoxDB: fungal peroxidase database for comparative genomics. BMC Microbiol 14:117. doi: 10.1186/1471-2180-14-117. [DOI] [PMC free article] [PubMed] [Google Scholar]
- 38.Buchfink B, Xie C, Huson DH. 2015. Fast and sensitive protein alignment using DIAMOND. Nat Methods 12:59–60. doi: 10.1038/nmeth.3176. [DOI] [PubMed] [Google Scholar]
- 39.Huson DH, Auch AF, Qi J, Schuster SC. 2007. MEGAN analysis of metagenomic data. Genome Res 17:377–386. doi: 10.1101/gr.5969107. [DOI] [PMC free article] [PubMed] [Google Scholar]
- 40.Oldenburg TBP, Brown M, Bennett B, Larter SR. 2014. The impact of thermal maturity level on the composition of crude oils, assessed using ultra-high resolution mass spectrometry. Org Geochem 75:151–168. doi: 10.1016/j.orggeochem.2014.07.002. [DOI] [Google Scholar]
- 41.Worcester Polytechnic Institute. 2008. Alternative energy hits the road: research at WPI explores turning highways and parking lots into solar collectors. Worcester Polytechnic Institute, Worcester, MA: http://www.wpi.edu/News/Releases/20089/asphaltnews.html. [Google Scholar]
- 42.Fuchs G, Boll M, Heider J. 2011. Microbial degradation of aromatic compounds—from one strategy to four. Nat Rev Microbiol 9:803–816. doi: 10.1038/nrmicro2652. [DOI] [PubMed] [Google Scholar]
- 43.Peng RH, Xiong AS, Xue Y, Fu XY, Gao F, Zhao W, Tian Y-S, Yao Q-H. 2008. Microbial biodegradation of polyaromatic hydrocarbons. FEMS Microbiol Rev 32:927–955. doi: 10.1111/j.1574-6976.2008.00127.x. [DOI] [PubMed] [Google Scholar]
- 44.Črešnar B, Petrič Š. 2011. Cytochrome P450 enzymes in the fungal kingdom. Biochim Biophys Acta 1814:29–35. doi: 10.1016/j.bbapap.2010.06.020. [DOI] [PubMed] [Google Scholar]
- 45.Hiraishi A, Matsuzawa Y, Kanbe T, Wakao N. 2000. Acidisphaera rubrifaciens gen. nov., sp. nov., an aerobic bacteriochlorophyll-containing bacterium isolated from acidic environments. Int J Syst Evol Microbiol 50:1539–1546. doi: 10.1099/00207713-50-4-1539. [DOI] [PubMed] [Google Scholar]
- 46.Kersters K, Lisdiyanti P, Komagata K, Swings J. 2006. The family Acetobacteraceae: the genera Acetobacter, Acidomonas, Asaia, Gluconacetobacter, Gluconobacter, and Kozakia, p 163–200. In Dworkin M, Falkow S (ed), The prokaryotes. Springer, New York, NY. [Google Scholar]
- 47.Orphan VJ, Taylor LT, Hafenbradl D, Delong EF. 2000. Culture-dependent and culture-independent characterization of microbial assemblages associated with high-temperature petroleum reservoirs. Appl Environ Microbiol 66:700–711. doi: 10.1128/AEM.66.2.700-711.2000. [DOI] [PMC free article] [PubMed] [Google Scholar]
- 48.Grice K, Alexander R, Kagi R. 2000. Diamondoid hydrocarbons as indicators of biodegradation in Australian crude oils. Org Geochem 31:67–73. doi: 10.1016/S0146-6380(99)00137-0. [DOI] [Google Scholar]
- 49.Rowland SJ, Scarlett AG, Jones D, West CE, Frank RA. 2011. Diamonds in the rough: identification of individual naphthenic acids in oil sands process water. Environ Sci Technol 45:3154–3159. doi: 10.1021/es103721b. [DOI] [PubMed] [Google Scholar]
- 50.Kanaly RA, Harayama S. 2000. Biodegradation of high-molecular-weight polycyclic aromatic hydrocarbons by bacteria. J Bacteriol 182:2059–2067. doi: 10.1128/JB.182.8.2059-2067.2000. [DOI] [PMC free article] [PubMed] [Google Scholar]
- 51.Boonchan S, Britz ML, Stanley GA. 2000. Degradation and mineralization of high-molecular weight polycyclic aromatic hydrocarbons by defined fungal-bacterial cocultures. Appl Environ Microbiol 66:1007–1019. doi: 10.1128/AEM.66.3.1007-1019.2000. [DOI] [PMC free article] [PubMed] [Google Scholar]
- 52.Pointing SB. 2001. Feasibility of bioremediation by white rot fungi. Appl Microbiol Biotechnol 57:20–33. doi: 10.1007/s002530100745. [DOI] [PubMed] [Google Scholar]
- 53.Haritash AK, Kaushik CP. 2009. Biodegradation aspects of polycyclic aromatic hydrocarbons (PAHs): a review. J Hazard Mater 169:1–15. doi: 10.1016/j.jhazmat.2009.03.137. [DOI] [PubMed] [Google Scholar]
- 54.Cerniglia CE, Sutherland JB. 2010. Degradation of polycyclic aromatic hydrocarbons by fungi, p 2080–2110. In Timmis KN, McGerity TJ, Meer JR, de Lorenzo V (ed), Handbook of hydrocarbon and lipid microbiology. Springer, Berlin, Germany. [Google Scholar]
- 55.Syed K, Doddapaneni H, Subramanian V, Lam YW, Yadav JS. 2010. Genome-to-function characterization of novel fungal P450 monooxygenases oxidizing polycyclic aromatic hydrocarbons (PAHs). Biochem Biophys Res Commun 399:492–497. doi: 10.1016/j.bbrc.2010.07.094. [DOI] [PMC free article] [PubMed] [Google Scholar]
- 56.Yanto DH, Tachibana S. 2014. Potential of fungal co-culturing for accelerated biodegradation of petroleum hydrocarbons in soil. J Hazard Mater 278:454–456. doi: 10.1016/j.jhazmat.2014.06.039. [DOI] [PubMed] [Google Scholar]
- 57.Tamas I, Smirnova AV, He Z, Dunfield DF. 2014. The (d)evolution of methanotrophy in the Beijerinckiaceae—a comparative genomics analysis. ISME J 8:369–382. doi: 10.1038/ismej.2013.145. [DOI] [PMC free article] [PubMed] [Google Scholar]
- 58.Green PN. 2006. Methylobacterium, p 257–265. In Dworkin M, Falkow S (ed), The prokaryotes. Springer, New York, NY. [Google Scholar]
- 59.Zengler K, Richnow HH, Rosselló-Mora R, Michaelis W, Widdel F. 1999. Methane formation from long-chain alkanes by anaerobic microorganisms. Nature 401:266–269. doi: 10.1038/45777. [DOI] [PubMed] [Google Scholar]
- 60.Hubert C, Loy A, Nickel M, Arnosti C, Baranyi C, Brüchert V, Ferdelman T, Finster K, Christensen FM, Rosa de Rezende J, Vandieken V, Jørgensen BB. 2009. A constant flux of diverse thermophilic bacteria into the cold Arctic seabed. Science 325:1541–1544. doi: 10.1126/science.1174012. [DOI] [PubMed] [Google Scholar]
- 61.Warnock AM, Hagen SC, Passeri DL. 2015. Marine tar residues: a review. Water Air Soil Pollut 226:68. doi: 10.1007/s11270-015-2298-5. [DOI] [PMC free article] [PubMed] [Google Scholar]
- 62.Meckenstock RU, von Netzer F, Stumpp C, Lueders T, Himmelberg AM, Hertkorn N, Schmitt-Kopplin P, Harir M, Hosein R, Haque S, Schulze-Makuch D. 2014. Water droplets in oil are microhabitats for microbial life. Science 345:673–676. doi: 10.1126/science.1252215. [DOI] [PubMed] [Google Scholar]
- 63.Naranjo-Briceño L, Pernía B, Guerra M, Demey JR, De Sisto A, Inojosa Y, González M, Fusella E, Freites M, Yegres F. 2013. Potential role of oxidative exoenzymes of the extremophilic fungus Pestalotiopsis palmarum BM-04 in biotransformation of extra-heavy crude oil. Microb Biotechnol 6:720–730. doi: 10.1111/1751-7915.12067. [DOI] [PMC free article] [PubMed] [Google Scholar]
- 64.Yanto DH, Tachibana S. 2014. Enhanced biodegradation of asphalt in the presence of Tween surfactants, Mn2+ and H2O2 by Pestalotiopsis sp. in liquid medium and soil. Chemosphere 103:105–113. doi: 10.1016/j.chemosphere.2013.11.044. [DOI] [PubMed] [Google Scholar]
- 65.Nair J, Ghatge M, Kakkar VV, Shanker J. 2014. Network analysis of inflammatory genes and their transcriptional regulators in coronary artery disease. PLoS One 9:e94328. doi: 10.1371/journal.pone.0094328. [DOI] [PMC free article] [PubMed] [Google Scholar]
Associated Data
This section collects any data citations, data availability statements, or supplementary materials included in this article.