

Abstract
Enterococcus faecium is an important nosocomial pathogen causing biofilm-mediated infections. Elucidation of E. faecium biofilm pathogenesis is pivotal for the development of new strategies to treat these infections. In several bacteria, extracellular DNA (eDNA) and proteins act as matrix components contributing to biofilm development. In this study, we investigated biofilm formation capacity and the roles of eDNA and secreted proteins for 83 E. faecium strains with different phylogenetic origins that clustered in clade A1 and clade B. Although there was no significant difference in biofilm formation between E. faecium strains from these two clades, the addition of DNase I or proteinase K to biofilms demonstrated that eDNA is essential for biofilm formation in most E. faecium strains, whereas proteolysis impacted primarily biofilms of E. faecium clade A1 strains. Secreted antigen A (SagA) was the most abundant protein in biofilms from E. faecium clade A1 and B strains, although its localization differed between the two groups. sagA was present in all sequenced E. faecium strains, with a consistent difference in the repeat region between the clades, which correlated with the susceptibility of biofilms to proteinase K. This indicates an association between the SagA variable repeat profile and the localization and contribution of SagA in E. faecium biofilms.
INTRODUCTION
Enterococci, specifically Enterococcus faecium and Enterococcus faecalis, are the third most common cause of nosocomial infections (1). The increase in the number of hospital-associated infections caused by E. faecium in recent decades is thought to be driven, at least partly, by the cumulative acquisition of novel adaptive traits, such as antibiotic resistance determinants and virulence factors, particularly in a defined subpopulation of E. faecium that is enriched in hospital isolates (2, 3). Different molecular technologies and increasingly sophisticated phylogenetic models have been used to study various aspects of the dynamics of E. faecium evolution. As a result, the clinical E. faecium subpopulation was initially designated lineage C1 (4) and was later renamed clonal complex 17 (CC17) (2, 5). Bayesian-analysis-based population genetic modeling of multilocus sequence type (MLST) data of a large set of isolates demonstrated that nosocomial E. faecium strains clustered into distinct subgroups, suggesting different evolutionary trajectories for clinical isolates (6, 7). Subsequently, on the basis of whole-genome sequencing, Lebreton et al. (8) described three clades: (i) clade A1, including the majority of clinical E. faecium isolates, which had previously been classified as lineage C1 or CC17; (ii) clade A2, including the majority of animal-derived isolates; and (iii) clade B, containing human commensal isolates (8). We will use an adaptation of the latter nomenclature for our sequence-based phylogenetic analyses in the present study.
Many E. faecium infections in hospitalized patients are biofilm mediated and are associated with the use of indwelling medical devices, such as (central) venous and urinary catheters, orthopedic implants, and prosthetic cardiac valves (9). A critical step in the pathogenesis of these infections is the adherence of enterococci to implanted medical devices and the colonization of these surfaces by the formation of biofilms (10).
The formation of multilayer biofilms is a complex process, from the attachment of single cells to the development of a 3-dimensional (3D) bacterial community (11). Under optimal conditions, a mature biofilm can develop into multilayered microcolonies held together with a matrix and interspersed with water channels, through which nutrients reach deeper parts of the biofilm. The matrix, or extracellular polymeric substances (EPS), is an important biofilm component, stabilizing the biofilm and protecting it against antimicrobials and immune cells. It is composed mainly of polysaccharides, proteins, and extracellular DNA (eDNA) (12).
Autolysis is the common mechanism by which eDNA is released in Gram-positive bacteria (13–19). DNA can act as an adhesive, implicated in biofilm attachment and stability. In E. faecium clinical strain E1162, eDNA is generated mainly by the lysis of a bacterial subpopulation by the major autolysin AtlAEfm (19).
Structural proteins present in the matrix have been characterized in several bacterial species (20). These biofilm matrix-associated proteins include extracellular carbohydrate-binding proteins, such as LecA, LecB, and CdrA in Pseudomonas aeruginosa (21–24) or TasA in Bacillus subtilis, and high-molecular mass proteins, such as the biofilm-associated surface protein Bap in Staphylococcus aureus and Bap-like proteins in other species (25). To date, biofilm-associated matrix proteins have not been studied in E. faecium.
In the present study, we analyzed the roles of eDNA and extracellular proteins in biofilm formation by hospital-associated and community-associated E. faecium strains that clustered in clade A1 and clade B, respectively. We demonstrated that eDNA is an essential structural component of the extracellular matrix in all E. faecium strains, irrespective of origin or phylogenetic background. We also identified secreted antigen A (SagA) as the most abundant protein in the supernatants of biofilm-forming cells and showed that it is part of the E. faecium biofilm matrix. Moreover, we found that the form of SagA that is present in the biofilm matrices of clade A1 strains contains a distinct repeat motif that correlates with proteinase K susceptibility.
MATERIALS AND METHODS
Bacterial strains and growth conditions.
The 85 E. faecium strains used in this study are listed in Table S1 in the supplemental material. Unless otherwise mentioned, E. faecium was grown in brain heart infusion broth (BHI; Oxoid) at 37°C. For biofilm assays, tryptic soy broth medium (TSB; Oxoid) with 1% glucose (TSBg) was used. Growth was determined by measuring the optical density at 660 nm (OD660).
Genome sequencing.
For genome sequencing, 21 E. faecium strains were grown on 4 ml BHI for 24 h at 37°C, and genomic DNA was extracted using a Wizard genomic DNA purification kit (Promega). Samples were prepared and sequenced employing the Nextera XT DNA sample preparation kit and the MiSeq reagent kit, version 2, with 2 × 250-bp reads (Illumina Inc.). Reads were first quality filtered using Nesoni Clip, version 0.109. Reads with an average quality score of <10 were removed, as well as reads shorter than 150 bp. The remaining reads were assembled de novo into contigs using the SPAdes assembler, version 3.0.0, with default parameters (26). Subsequently, contigs of <500 bp and those below the minimum nucleotide coverage of 6 were discarded.
Functional gene annotation was performed using Prokka (27). All protein sequences were aligned using BLAST. On the basis of the alignment results, orthologous groups (OGs) of proteins were identified using orthAgogue (28) and the Markov clustering algorithm (MCL) (29). orthAgogue and MCL were run using “–u –o 50” and “–I 1.5” parameters, respectively. Based on the orthology relationship of 1,186 core OGs, including the 64 previously sequenced E. faecium strains, multiple-sequence alignment of the nucleotide sequences of genes in an OG was performed using MUSCLE (30). Gaps in multiple-sequence alignments were removed using trimAl (31), which results in equal sequence lengths for all genes in an OG. Subsequently, the core genomes of the 85 strains were used for building a phylogenetic tree in FastTree 2 with 1,000 bootstrap samples and the GTR (generalized time-reversible) model as a maximum likelihood model (32).
The number of single nucleotide polymorphisms (SNPs) between isolates was extracted from the core genome alignment described above. For each pairwise strain comparison, we considered only SNPs at positions in the alignment where both nucleotides were A, T, C, or G (i.e., ambiguous positions were ignored). The number of SNPs for all pairwise strain comparisons is displayed in Table S2 in the supplemental material.
Biofilm polystyrene assay.
The biofilm polystyrene assay was performed as described previously, with some modifications (19). In brief, overnight bacterial suspensions were diluted to an OD660 of 0.01 in TSBg and were incubated for 24 h. Where mentioned, 1.5 μg μl−1 of DNase I (Roche) or 1.0 μg μl−1 of proteinase K (Sigma) was added to the bacterial suspension before the start of biofilm formation. The plates were washed and stained as described previously (19). The experiments were performed in triplicate, and statistical analysis of the data was performed using a two-tailed Student t test.
Proteomics of the biofilm supernatant.
To determine the proteins present in the supernatant of the clade A1 strain E1162 growing in a biofilm, 6 ml of the supernatant of E1162 cells, after 24 h of growth in a biofilm using the semistatic model as described below, was filtered using a 0.2-μm filter (Corning) and was concentrated with a 10-kDa-cutoff column (Amicon Ultra; Merck Millipore). Proteins were loaded onto a 12.5% SDS-polyacrylamide gel electrophoresis (SDS-PAGE) gel, electrophoresed, and stained with Coomassie brilliant blue. The three predominant proteins, of approximately 75 kDa, 50 kDa, and 25 kDa, were quantified with ImageJ (33) and were excised from the gel. Matrix-assisted laser desorption ionization–time of flight mass spectrometry (MALDI-TOF MS) of the excised proteins was performed by using an Ultraflex MALDI-TOF/TOF mass spectrometer (Bruker Daltonics), as described previously (34).
Biofilm semistatic model and CLSM.
To visualize E. faecium biofilms and detect SagA, E. faecium biofilms were grown in a semistatic model as described previously by Paganelli et al. (19), with some modifications. In brief, biofilms were grown in TSBg on a coverslip coated with poly-l-lysine (thickness, 0.45 μm; diameter, 12 mm; Becton Dickinson) inside a well of a six-well polystyrene plate (Corning Inc.) at 37°C for 24 h at 120 rpm. To study the effect of proteolysis, 1.0 μg μl−1 of proteinase K was added at the start of biofilm formation (0 min). After 24 h, biofilms were washed with 3 ml phosphate-buffered saline (PBS) and were fixed with 3% paraformaldehyde for 15 min at room temperature. After removal of the fixative, cells were washed with PBS. To detect SagA, bacteria were incubated with polyclonal anti-SagA antibodies (diluted 1:250 in PBS with 1% bovine serum albumin [BSA]) (35) for 1 h on ice and were subsequently washed with PBS. A polyclonal anti-SagA antiserum was raised in rabbit using purified SagA from E. faecium strain E155 (35). As a secondary antibody, Alexa Fluor 488-conjugated goat anti-rabbit IgG (Life Technologies) (diluted 1:500 in PBS with 1% BSA), was added, and bacteria were incubated for an additional 1 h on ice. The cells were washed once more and were incubated with the FM 5-95 dye (5 μg ml−1; Invitrogen) for 1 min on ice to visualize cell membranes. The FM 5-95 dye was removed, and the coverslips were transferred to microscope slides. Fluorescence was analyzed using a confocal laser scanning microscope (CLSM) (Leica SP5) equipped with a Plan Neofluar 63× (numerical aperture, 1.4) oil objective. Alexa Fluor 488 and FM 5-95 were excited at 488 nm. Pictures were analyzed with LAS AF software (Leica), and the level of biofilm formation was quantified using Comstat (36)/Matlab R2010b software (MathWorks). The average thickness and biomass of the biofilms were measured at five randomly chosen positions. Statistical analysis of the data was performed using a two-tailed Student t test. 3D images were generated with ImageJ (33), and OrthoView images were generated by LAS AF software (Leica).
Proteolytic stability of SagA.
To determine the level of SagA degradation during biofilm development, biofilm supernatants of three clade A1 strains (E470, E1162, E1904) and three clade B strains (E980, E3548, E1590) were analyzed. The supernatants originating from biofilms grown in a semistatic model for 4 h (early biofilm) and 24 h (mature biofilm) were filtered and precipitated at −20°C overnight with 1/10 (vol/vol) 100% trichloroacetic acid (TCA). After incubation, supernatants were spun down for 10 min at 4,000 × g and 4°C. Protein pellets were washed with 500 μl 100% acetone and were again centrifuged under the same conditions. Final protein pellets were resuspended in sample buffer (100 mM Tris-HCl, 5% dithiothreitol, 2% SDS, 0.004% bromophenol blue, and 20% glycerol) and were analyzed by SDS-PAGE and Western blotting as described below.
For testing of the stability of SagA in biofilms, supernatants of 24-h biofilms of E1162 and E980, processed as described above, were incubated at 37°C for 30 min, 1 h, 4 h, 8 h, or 24 h. The degradation of SagA over time was analyzed by SDS-PAGE and Western blotting as described above.
To analyze the susceptibility of SagA to proteinase K, filtered supernatants of 24-h biofilms of E1162 and E980 were incubated with 0.1 μg μl−1 proteinase K at 37°C for 1, 5, 15, 30, or 60 min. After challenge with proteinase K, supernatants were precipitated at 4°C for 10 min with 1/5 (vol/vol) 100% TCA. After incubation, supernatants were spun down for 10 min at 4,000 × g and 4°C. Protein pellets were washed with 500 μl 100% acetone and were again centrifuged under the same conditions. Final protein pellets were resuspended in sample buffer and were analyzed by SDS-PAGE and Western blotting as described below.
SDS-PAGE and Western blotting.
Equal amounts of protein samples were mixed with the same volume of sample buffer and were boiled for 5 min. Western blotting was carried out as described previously (37). Membranes were blocked with 4% skim milk (Campina Holland, Alkmaar, The Netherlands) in PBS–0.1% Tween 20 for 24 h at 4°C. Incubation with the primary antibody (anti-SagA) (35) was carried out for 1 h in 1% BSA in PBS–1% Tween 20 at 37°C, followed by two washes for 10 min (each) in PBS–0.1% Tween 20 at 37°C. Subsequently, membranes were incubated for 1 h with horseradish peroxidase (HRP)-conjugated anti-rabbit IgG(H+L) (Bio-Rad Laboratories, Veenendaal, The Netherlands) in 1% BSA in PBS–1% Tween 20 at 37°C. Membranes were washed twice with PBS–0.1% Tween 20, and proteins were visualized using the ECL Plus Western blotting detection system and the ImageQuant LAS 4000 biomolecular imager (both from GE Healthcare, Diegem, Belgium).
sagA sequences.
For 34 E. faecium strains, the complete sagA gene sequence was determined by Sanger sequencing. To this end, the sagA gene was amplified using AccuPrime Taq DNA Polymerase, High Fidelity (Life Technologies), and primers sagA-F (5′-ATGACCTTGACTGCCGTAGCAT-3′) and sagA-R (5′-TTACATGCTGACAGCAAAGTCAG-3′), which are specific for E. faecium sagA, in a total volume of 50 μl. The calculated size of the sagA amplicon was 1,500 bp. The conditions for PCR amplification were as follows: initial denaturation was conducted for 3 min at 95°C, and 30 cycles of denaturation, annealing, and extension were conducted at 94°C for 30 s, 55°C for 30 s, and 72°C for 2 min, respectively. PCR products were purified with the GeneJET PCR purification kit (Thermo Scientific) and were sequenced by Sanger methodology (38). The sagA gene sequences of the remaining 51 strains were extracted from whole-genome sequence data. In these strains, sagA was assembled on one contig.
Phylogenetic tree based on the SagA VRR.
The SagA variable repeat region (VRR) sequences of all 85 E. faecium strains used in this study were aligned using MUSCLE (30), and a maximum likelihood tree was built from the alignment data using the Jones-Taylor-Thornton (JTT) model in MEGA, version 6 (39).
SagA secondary-structure prediction.
Based on the SagA primary amino acid sequence, the SagA secondary structure was predicted using the Chou & Fasman Secondary Structure Prediction Server at http://www.biogem.org/tool/chou-fasman/ (40, 41).
Nucleotide sequence accession numbers.
The genome sequences obtained for the 85 E. faecium strains used in this study have been submitted to the European Nucleotide Archive (ENA) under study accession number PRJEB9441 (http://www.ebi.ac.uk/ena/data/view/PRJEB9441). The sagA sequence data determined in this study have been submitted to the European Nucleotide Archive (ENA) and can be accessed by accession numbers LN714742 to LN714774.
RESULTS
Phylogenetic analysis of E. faecium strains.
Phylogenetic reconstruction of the 85 E. faecium strains included in this study was performed. Of the 85 genome sequences used in this analysis, 64 were publicly available (3, 8, 42–44), whereas the genomes of the other 21 strains were newly sequenced for the purpose of this study (see Table S1 in the supplemental material). A total of 1,186 single-copy core orthologous groups (OGs) were identified using OrthAgogue and MCL. Individual core OG alignments were built and concatenated to generate a core genome sequence alignment. The resulting phylogenetic tree (Fig. 1a) revealed the presence of two of the three clades described previously: clade A1, which includes the majority of hospital-associated strains, and clade B, including mainly human commensal strains. Strains that had formed a clear monophyletic clade A2 in previous analyses (8) now formed a polyphyletic group located between clades B and A1, which we designated the intermediate group (IG). This IG should be considered as a multiclonal group of clinical, animal-derived, and community-associated strains, with a topology very different from the ladder-like topology of clade A1 (Fig. 1a). However, as observed before in clade A2, the strains present in the IG are closely related to clade A1, which makes the separation of the IG from clade A1 uncertain in some cases.
FIG 1.

Phylogenetic reconstruction of 85 E. faecium strains based on core genome variation. (a) Phylogenetic tree (FastTree) built from an alignment of 1,186 core genes in 85 E. faecium genomes. Clades A1 and B and the intermediate group (IG) are indicated by red, green, and blue boundaries, respectively. Selected strains for further phenotypic tests are highlighted in red in clade A1 (E470, E1162, and E1904) and in green in clade B (E980, E3548, and E1590). (b) SagA variable repeat regions (VRRs) are indicated after each strain designation. The VRRs are divided into three types: VRR-1 (boxed in red), VRR-2 (boxed in blue), and VRR-3 (boxed in green). The sequences highlighted in yellow, blue, green, and red indicate the different repeat variants.
In total, 41 of the strains analyzed clustered in clade A1, 13 clustered in clade B, and 31 were assigned to the IG. The clonal relatedness of the strains was considered based on pairwise SNP comparisons (see Table S2 in the supplemental material). The lowest number of SNPs found between two strains was 6 (between strains E1574 and E120), followed by 10 SNPs between strains E2560 and U317. To avoid overrepresentation of these strains in clade A1, one strain from each pair described (in this case, strains E120 and U317) was excluded from subsequent analysis.
Biofilm formation among E. faecium strains.
Biofilm formation by 83 E. faecium strains (see Table S1 in the supplemental material) in TSBg was tested in a polystyrene (96-well) plate assay. We observed biofilm formation in 59% of E. faecium strains (49 strains), with no significant difference in biofilm formation between the different phylogenetic clades (Fig. 2).
FIG 2.
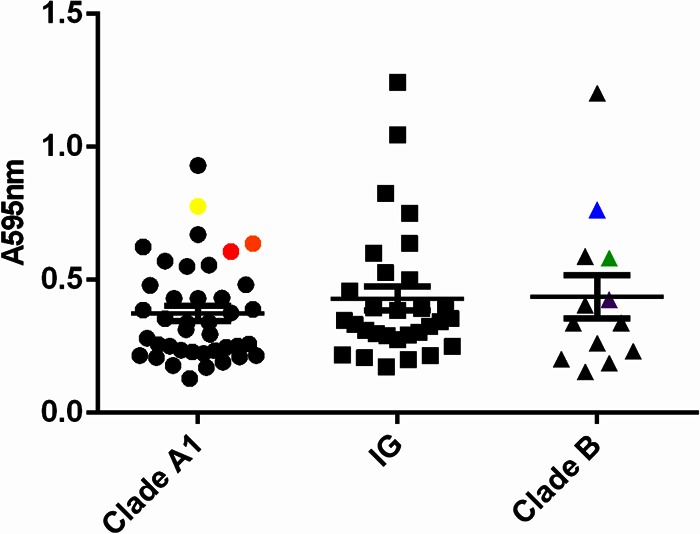
Biofilm polystyrene assay. Biofilm formation by 83 E. faecium strains of different origins incubated in polystyrene plates with TSBg for 24 h was studied. Biofilms were stained with crystal violet, and the amount of biofilm formation was measured at 595 nm. The six strains selected for further phenotypic tests are color coded in yellow (E470), red (E1162), orange (E1904), green (E980), purple (E3548), and blue (E1590).
eDNA, not secreted proteins, is essential for biofilm formation by E. faecium.
eDNA and secreted proteins are extracellular matrix components important for biofilm attachment and stability in different bacterial species (20). In polystyrene plates, the impact of DNase I and proteinase K on initial biofilm formation in TSBg was tested with 49 E. faecium strains belonging to different phylogenetic clades. Biofilm formation was reduced (10 to 77% reduction) in 41 of 49 strains (83%) from the different phylogenetic clades when DNase I was added to the biofilms (Fig. 3a). A statistically significant (P < 0.05) decrease in biofilm formation was observed among E. faecium clade A1 strains when proteinase K was added to growing biofilms, but this was not observed for clade B strains (Fig. 3b). These results indicate that both eDNA and proteins are essential for biofilm formation by E. faecium clade A1 strains and that eDNA is essential for biofilm formation by clade B strains. The fact that we did not observe a reduction in biofilm formation by clade B strains after proteinase K treatment may suggest that proteins are less important than eDNA for biofilm formation by E. faecium clade B strains. Alternatively, it is possible that proteins in clade B biofilms are less accessible to proteinase K or that in the context of a biofilm, clade B strains are able to degrade the exogenously added protease.
FIG 3.

Sensitivity of initial biofilm formation to DNase I and proteinase K. Biofilm formation by 49 E. faecium strains of different origins incubated in polystyrene plates with TSBg for 24 h in the presence of DNase I (1.5 μg μl−1) (a) or proteinase K (1 μg μl−1) (b) was studied. Biofilms were stained with crystal violet, and the amount of biofilm formation was measured at 595 nm. Asterisks indicate significant differences (*, P < 0.05; **, P < 0.01) by an unpaired two-tailed Student t test between clade A1 and B strains or between IG and clade B strains. The six strains selected for further phenotypic tests are color coded in yellow (E470), red (E1162), orange (E1904), green (E980), purple (E3548), and blue (E1590).
SagA is the major secreted protein in E. faecium biofilms.
Since proteolytic treatment reduced the level of biofilm formation, at least in E. faecium clade A1 strains, we investigated the proteins secreted in the supernatants of biofilm-forming cells of representative E. faecium strains from clade A1 (E1162) and clade B (E980) (Fig. 4). No differences were observed between the protein profiles of the supernatants of these strains by SDS-PAGE. Using MALDI-TOF MS, we identified the three dominant protein bands (highlighted in Fig. 4) as SagA (locus tag EfmE1162_2437; GenBank accession number EFF33872), sulfatase domain protein (locus tag EfmE1162_1520; GenBank accession number EFF34609), and LysM domain protein (EfmE1162_2234; GenBank accession number EFF34034) (see Table S3 in the supplemental material). The three predominant bands in the SDS-PAGE gel were also quantified by ImageJ (33). Since SagA was the most abundant protein quantified in the supernatants of the biofilm-forming E. faecium cells (60% relative to the other two proteins), we subsequently focused on the role of SagA in E. faecium biofilms.
FIG 4.
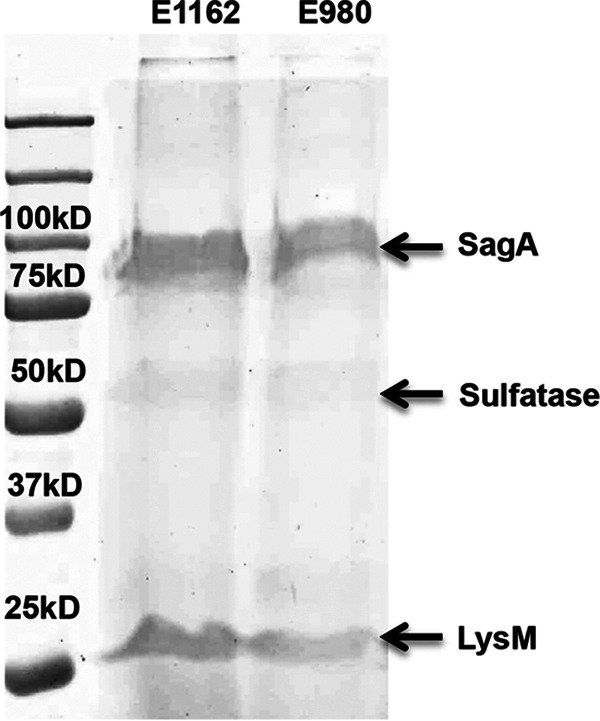
Proteins released in the biofilm supernatants. Proteins present in the 24-h biofilm supernatants of E. faecium strains E1162 (clade A1) and E980 (clade B) were loaded equally, separated using a 12.5% SDS-PAGE gel, and stained with Coomassie blue. The indicated bands were excised from the gel and were identified by mass spectrometry as secreted antigen A (SagA) (locus tag EfmE1162_2437), sulfatase (EfmE1162_1520), and LysM (EfmE1162_2234).
SagA is susceptible to proteinase K, and its localization in biofilms differs between E. faecium clade A1 and clade B strains.
To confirm the presence of SagA in the extracellular biofilm matrix and its susceptibility to proteinase K, we selected six E. faecium strains, three in clade A1 (E470, E1162, E1904) and three in clade B (E980, E3548, E1590), and analyzed biofilm formation using a semistatic biofilm model in the presence or absence of proteinase K. As in the polystyrene assay, all E. faecium strains, irrespective of their ecological or phylogenetic origins, were able to form biofilms. After proteinase K treatment, SagA was not detected in any of the E. faecium biofilms (Fig. 5a) or in the supernatants of cells growing in biofilms (Fig. 5b). In clade A1 strains, biofilm thickness was significantly decreased in the presence of proteinase K, in contrast to clade B strains, in which biofilm thickness was not significantly affected (Fig. 5c). This confirmed the results obtained in the polystyrene assay (Fig. 3b).
FIG 5.

Confocal microscopy images depicting biofilm thickness and SagA localization in a semistatic biofilm model with or without proteinase K treatment. (a) Biofilms of six E. faecium strains—three clade A1 (E470, E1162, E1904) and three clade B (E980, E3548, E1590) strains—were grown for 24 h on poly-l-lysine-coated glass, in TSBg with or without proteinase K, at 120 rpm and 37°C. The ecological origins and clade assignments of the strains are listed in Table S1 in the supplemental material. Biofilms were incubated with a rabbit polyclonal anti-SagA antiserum and an Alexa Fluor 488-conjugated goat anti-rabbit antibody (green). Bacterial membranes were stained with FM 95-5 (red). (b) The presence of SagA in the biofilm supernatants of E. faecium strains incubated with (+) or without (−) proteinase K was analyzed by Western blotting using a rabbit polyclonal anti-SagA antiserum. (c) The thicknesses of biofilms were analyzed with Comstat/Matlab software at five random positions. Asterisks represent significant differences (*, P < 0.05; **, P < 0.01) by an unpaired two-tailed Student t test between thicknesses with and without proteinase K treatment. Pictures were taken at ×63 magnification with 2.0 optical zoom.
SagA was detected in biofilms of both clade A1 and clade B strains, but the localization of SagA in biofilms was different in the two clades. In clade A1 strains, SagA was localized in the middle of the biofilm (with points of colocalization of bacteria [red] and SagA [green] visualized in yellow [see Fig. S1a in the supplemental material]), suggesting that SagA acts as an adhesive keeping bacterial cells tightly connected. In contrast, in biofilms of clade B strains, SagA seemed more surface localized, which may explain why proteolytic removal of SagA does not have a major impact on biofilm integrity in these strains, as it does in clade A1 strains (see Fig. S1b in the supplemental material).
To confirm the different roles for SagA in clade A1 and clade B strains, we attempted to construct a markerless sagA mutant and to select a sagA insertion mutant from a transposon library in E1162 (45). Unfortunately, both approaches failed, most probably because SagA has been reported previously to be essential for E. faecium, likely due to its role in cell division (46).
The susceptibility of SagA to proteolytic degradation is similar for E. faecium clade A1 and clade B strains.
Another explanation for the observation that proteinase K treatment impacted biofilm formation by E. faecium clade A1 strains more than biofilm formation by clade B strains, in addition to the difference in localization described above, could be that SagA of clade B strains is less susceptible to proteolytic degradation by proteinase K. Therefore, we analyzed the degradation of SagA in 24-h biofilm supernatants by proteinase K over time. For strains E1162 (clade A1) and E980 (clade B), no significant difference was observed in SagA degradation with proteinase K. In both E1162 and E980, SagA was not detected after 30 min of treatment (Fig. 6). This indicates that the rates of degradation of SagA from E1162 and SagA from E980 by proteinase K are comparable.
FIG 6.
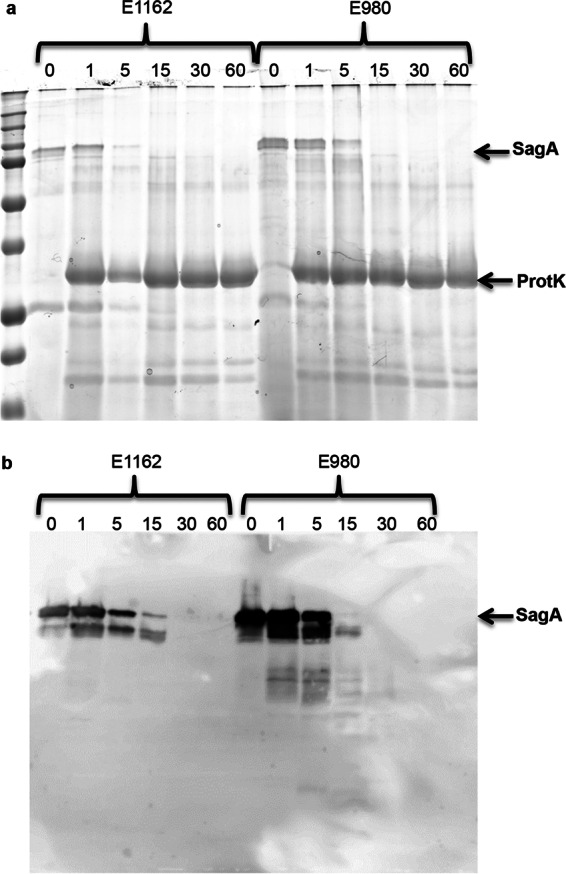
Susceptibility of SagA in a 24-h biofilm supernatant to proteinase K treatment. (a) Proteins present in the 24-h biofilm supernatants of E. faecium strains E1162 (clade A1) and E980 (clade B) were loaded equally, separated using a 12.5% SDS-PAGE gel, and stained with Coomassie blue after incubation with 0.1 μg ml−1 proteinase K (ProtK) at 37°C for 1 min, 5 min, 15 min, 30 min, or 60 min. (b) The degradation of SagA in the biofilm supernatants of E. faecium strains incubated with proteinase K was analyzed by Western blotting using a rabbit polyclonal anti-SagA antiserum.
SagA is present in early and mature biofilms without detectable endopeptidase activity.
Another explanation for the difference in the susceptibility of clade A1 and clade B biofilms to proteinase K treatment could rely on differences in the proteolysis of SagA by enterococcal proteases produced by clade A1 or clade B strains or in SagA endopeptidase activity. The proteolysis of SagA during biofilm development was studied by SDS-PAGE and Western blotting of early (4-h) and mature (24-h) biofilm supernatants of all six strains, which were also analyzed by confocal microscopy. In all strains, similar amounts of SagA were detected in early and mature biofilms by SDS-PAGE and Western blotting, with no indication of SagA degradation over time (Fig. 7). Alternatively, constitutive production of SagA during biofilm development could explain the detection of apparently stable amounts of SagA in early and late biofilms. Nevertheless, even after the incubation of mature biofilm supernatants from E1162 and E980, which contain large amounts of SagA, for 24 h at 37°C, no SagA degradation could be detected (see Fig. S3 in the supplemental material). This virtually excludes the possibility of SagA endopeptidase activity in early and mature biofilms.
FIG 7.
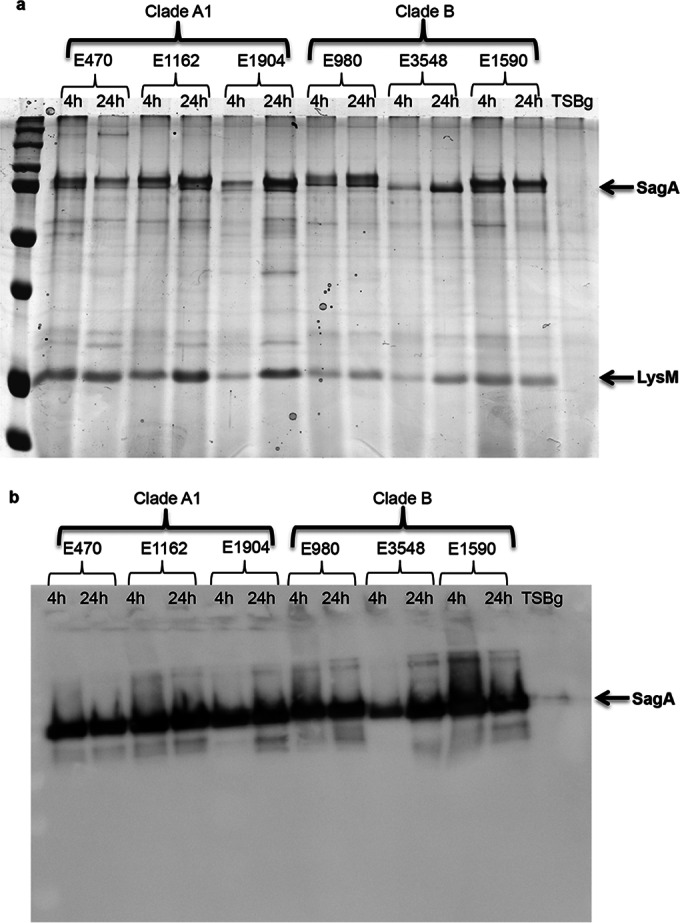
Stability of SagA during biofilm development. (a) Proteins present in the 4-h or 24-h biofilm supernatants of six E. faecium strains—three clade A1 (E470, E1162, E1904) and three clade B (E980, E3548, E1590) strains—were loaded equally, separated using a 12.5% SDS-PAGE gel, and stained with Coomassie blue. (b) The presence of SagA in the biofilm supernatants of E. faecium strains after 4 h or 24 h of growth was analyzed by Western blotting using a rabbit polyclonal anti-SagA antiserum.
SagA is present in all E. faecium strains sequenced but has different amino acid motifs in clade A1 and clade B strains.
We investigated the differences in sagA sequence among all E. faecium strains used in this study as a possible explanation for differences in the localization of SagA in biofilms grown from E. faecium clade A1 or clade B strains. The sagA gene is present in all sequenced E. faecium strains, and the sizes of the SagA proteins ranged from 479 to 572 amino acids (aa) (average, 520 ± 12 aa) (see Fig. S2 in the supplemental material). In a multiple-sequence alignment of the 85 SagA orthologous protein sequences (built using MUSCLE, version 3.8.31), the SagA N- and C-terminal regions were highly conserved (data not shown). The SagA N-terminal region was composed of a COG3883 domain, which is an uncharacterized conserved domain in bacteria, yet the C-terminal region harbored an NLPC_60 domain, which has been described as a cell wall-associated hydrolase (see Fig. S2 in the supplemental material). However, the SagA central region was highly variable, mainly due to the presence of imperfect 9-aa repeats. The number of these repeats was highly variable across the different SagA orthologues. The variable repeat region (VRR) was flanked at the N-terminal side by the amino acid sequence AQATQASS, which was 100% conserved among all strains analyzed. Similarly, at the C-terminal side, the VRR was flanked by the amino acid sequence TTPSTDQSVD, which was also 100% conserved among all strains. Using these regions as boundaries for the VRR, the starting position for the VRR was found between SagA amino acid positions 250 and 256, and the average size of the VRR was found to be 109 ± 12 aa, including the 100% conserved boundaries. We further characterized the 9-aa repeated element in SagA and identified three types of VRR composition (Fig. 1b). VRR-1 is highly conserved in clade A1 strains and is composed of 7 to 9 repeat motifs [(T/A)-(A/T)-Q-S-S-(A/M)-T-E-E (in yellow) and (A/V)-P-E-S-S-(A/T)-T-E-E (in green)], which are interrupted by an 8-aa repeat (T-P-E-S-S-T-E-E [in blue]) after the first three repeats. VRR-2 has a composition similar to that of VRR-1; however, it has an extra 8-aa repeat (V-P-E-S-S-T-E-E [in blue]) at the end of the VRR. VRR-3 is present only in clade B strains and has a composition different from that of VRR-1. It is composed of 7 or 8 repeats [A-A-Q-S-S-(A/T)-T-E-E (in yellow) and (A/V)-P-E-S-S-T-T-E-E (in green)] and one 8-aa repeat [V-P-E-(S/T)-S-T-E-E] at the end of the VRR.
Seventeen of 21 E. faecium strains with SagA VRR-1 (Fig. 8a) formed biofilms that were susceptible to proteinase K and represent clade A1 strains. Strains with VRR-2 are of mixed origins and are found in the polyphyletic IG. Biofilms produced by these strains are predominantly (13 of 20 strains) susceptible to proteinase K (Fig. 8b). In contrast, strains with VRR-3 produced biofilms that were resistant to proteinase K (7 of 8 strains). All strains with VRR-3 clustered in clade B (Fig. 8a [see also Fig. 1]).
FIG 8.

Correlation between the proteinase K susceptibility of biofilm formation and the SagA variable repeat region (VRR) type. The percentage of biofilm reduction in 49 E. faecium strains in the presence of 1.0 μg μl−1 proteinase K is indicated along the y axis, while the level of biofilm formation in the polystyrene biofilm model is indicated along the x axis. (a) E. faecium strains with SagA VRR-1 and VRR-3; (b) E. faecium strains with all three SagA VRRs. The six strains selected for further phenotypic tests are color coded in yellow (E470), red (E1162), orange (E1904), green (E980), purple (E3548), and blue (E1590).
Based on the variations observed in this SagA repeat region, we built a phylogenic tree (see Fig. S4 in the supplemental material). Phylogenetic inferences based on VRR identified two distinct clusters supported by bootstrap values. Cluster 1 (VRR-1 and VRR-2) is composed of strains clustering in clade A1 and the IG, while cluster 2 (VRR-3) is composed of clade B strains. These results also show that clade A1 and the IG are phylogenetically more closely related than clade A1 and clade B, as observed in the genome-based phylogenetic analysis.
Different SagA VRRs correspond to different predicted secondary protein structures.
Based on in silico predictions, the structural differences between the SagA proteins from clade A1 and clade B strains were investigated (40, 41). In both clade A1 and clade B strains, the repeat regions may serve as a linker between the N-terminal and the C-terminal domain (Fig. 9a). SagA proteins with VRR-1 have relatively more alpha-helices in the N-terminal fragment of the protein than SagA proteins with VRR-3. In contrast, SagA proteins with VRR-3 are composed of more beta-sheets than proteins with VRR-1 (Fig. 9b). These predicted differences in SagA protein structure might have a distinct effect on the functionality of SagA and its localization in the biofilms of hospital-associated and community-associated E. faecium strains.
FIG 9.

Prediction of the secondary structure of SagA. Shown are comparisons of the predicted secondary structures of total SagA protein (a) and the variable repeat regions (VRRs) (b) of E. faecium strain E1162, which represents SagA protein with VRR-1; strain E1575, which represents SagA with VRR-2; and strain E980, which represents SagA with VRR-3. Secondary structures were predicted using the CFSSP (Chou & Fasman Secondary Structure Prediction Server) Web tool. Alpha-helices are indicated in red, beta-sheets in green, beta-turns in blue, and random coils in yellow.
DISCUSSION
Most difficult-to-treat chronic infections caused by multiresistant E. faecium strains are biofilm mediated. In the present study, we demonstrated that the major secreted antigen, SagA, is part of the biofilm matrix produced by E. faecium and as such is implicated in biofilm formation in this species. The biofilms produced by hospital-associated (clade A1) and community-associated (clade B) strains were both found to be destabilized by DNase I treatment. Interestingly, the biofilms generated by hospital-associated strains were highly sensitive to proteinase K treatment, whereas the community-associated strain-induced biofilms were not.
Three proteins, LysM domain protein, sulfatase domain protein, and SagA, were identified in mature biofilm supernatants of E. faecium clade A1 and clade B strains. The LysM domain protein (GenBank accession number EFF34034) is a noncovalently binding peptidoglycan protein that has been reported to be involved in erythromycin resistance in E. faecalis (47). Antibodies against the LysM domain protein are protective against E. faecium and E. faecalis infections in a mouse bacteremia model (47). The sulfatase domain protein (GenBank accession number EFF34609) is a predicted transmembrane protein and has an MdoB conserved domain, reported to be involved in cell envelope biogenesis (47). The roles of these proteins in E. faecium biofilms remain to be determined.
The most abundant protein identified was SagA, which has a COG3883 uncharacterized conserved domain in the N-terminal region and an NLPC_60 conserved domain in the C-terminal region. Proteins containing an NLPC_60 domain have been characterized as lipoproteins or cell hydrolases involved in cell division, cell wall maturation, and virulence (48). SagA was first identified by Teng et al. (46) by screening of an E. faecium genomic expression library with serum from a patient who suffered from E. faecium endocarditis. The SagA protein appeared to be essential for growth, to bind to a broad spectrum of extracellular matrix (ECM) proteins, and to be sensitive to proteinase K (46). Subsequently, Kropec et al. (35) demonstrated that serum raised against purified SagA is opsonic and inhibits E. faecium infections in an experimental animal model. While these data suggest that SagA is an important virulence factor in E. faecium, its function has not been linked to biofilm formation previously. In the closely related species E. faecalis, however, two secreted antigens that displayed similarity to SagA, SalA and SalB, have been found to play a role in biofilm formation (49).
The present study demonstrates that SagA is the major protein secreted during biofilm formation in E. faecium. Furthermore, SagA is localized within the biofilm matrix, and proteolytic degradation, which also degrades SagA, markedly reduced the thickness of biofilms of clade A1 E. faecium strains but not the thickness of biofilms of clade B strains. The potential difference between clade A1 and clade B in the impact of proteolytic degradation on biofilm formation correlates with differences between these clades in the repeat profiles of their SagA proteins. We hypothesize that differences in the repeat profiles of SagA can lead to changes in the secondary structure of the protein, which may determine the localization as well as the role of SagA in E. faecium biofilm matrices, possibly as a result of diverse interactions of SagA variants with other E. faecium cell surface determinants. A difference in SagA localization within biofilms may explain the difference in the proteolytic susceptibility of biofilms that was observed between clade A1 strains, all of which express SagA proteins with VRR-1, and clade B strains, which express SagA proteins with VRR-3.
Our findings also demonstrate that eDNA is an essential part of biofilms produced by all E. faecium strains tested. This is consistent with previous findings that the major autolysin AtlAEfm, which is present in all sequenced E. faecium strains, is responsible for eDNA release in E. faecium E1162 biofilms (19). Our observation that E. faecium clade A1 and clade B strains form biofilms with distinct properties suggests that under different ecological conditions, different types of biofilms are produced, possibly contributing to adaptation to different niches.
Supplementary Material
ACKNOWLEDGMENTS
We thank Ellen Brouwer for expert technical assistance during genomic DNA isolation for whole-genome sequencing and Jukka Corander for a helpful discussion on the interpretation of the phylogenetic analysis.
Part of this work was supported by ZonMW VENI grant 91610058 to H.L.L. from The Netherlands Organization for Health Research and Development and by the European Union Seventh Framework Programme (FP7-HEALTH-2011-single-stage) under grant agreement 282004, EvoTAR, to R.J.L.W.
Footnotes
Supplemental material for this article may be found at http://dx.doi.org/10.1128/AEM.01716-15.
REFERENCES
- 1.Hidron AI, Edwards JR, Patel J, Horan TC, Sievert DM, Pollock DA, Fridkin SK. 2008. NHSN annual update: antimicrobial-resistant pathogens associated with healthcare-associated infections: annual summary of data reported to the National Healthcare Safety Network at the Centers for Disease Control and Prevention, 2006–2007. Infect Control Hosp Epidemiol 29:996–1011. doi: 10.1086/591861. [DOI] [PubMed] [Google Scholar]
- 2.Heikens E, Singh KV, Jacques-Palaz KD, van Luit-Asbroek M, Oostdijk EA, Bonten MJ, Murray BE, Willems RJ. 2011. Contribution of the enterococcal surface protein Esp to pathogenesis of Enterococcus faecium endocarditis. Microbes Infect 13:1185–1190. doi: 10.1016/j.micinf.2011.08.006. [DOI] [PMC free article] [PubMed] [Google Scholar]
- 3.de Been M, van Schaik W, Cheng L, Corander J, Willems RJ. 2013. Recent recombination events in the core genome are associated with adaptive evolution in Enterococcus faecium. Genome Biol Evol 5:1524–1535. doi: 10.1093/gbe/evt111. [DOI] [PMC free article] [PubMed] [Google Scholar]
- 4.Homan WL, Tribe D, Poznanski S, Li M, Hogg G, Spalburg E, Van Embden JD, Willems RJ. 2002. Multilocus sequence typing scheme for Enterococcus faecium. J Clin Microbiol 40:1963–1971. doi: 10.1128/JCM.40.6.1963-1971.2002. [DOI] [PMC free article] [PubMed] [Google Scholar]
- 5.Willems RJ, Top J, van Santen M, Robinson DA, Coque TM, Baquero F, Grundmann H, Bonten MJ. 2005. Global spread of vancomycin-resistant Enterococcus faecium from distinct nosocomial genetic complex. Emerg Infect Dis 11:821–828. doi: 10.3201/1106.041204. [DOI] [PMC free article] [PubMed] [Google Scholar]
- 6.Willems RJ, Top J, van Schaik W, Leavis H, Bonten M, Siren J, Hanage WP, Corander J. 2012. Restricted gene flow among hospital subpopulations of Enterococcus faecium. mBio 3(4):e00151-12. doi: 10.1128/mBio.00151-12. [DOI] [PMC free article] [PubMed] [Google Scholar]
- 7.Tedim AP, Ruiz-Garbajosa P, Corander J, Rodriguez CM, Canton R, Willems RJ, Baquero F, Coque TM. 2015. Population biology of intestinal Enterococcus isolates from hospitalized and nonhospitalized individuals in different age groups. Appl Environ Microbiol 81:1820–1831. doi: 10.1128/AEM.03661-14. [DOI] [PMC free article] [PubMed] [Google Scholar]
- 8.Lebreton F, van Schaik W, McGuire AM, Godfrey P, Griggs A, Mazumdar V, Corander J, Cheng L, Saif S, Young S, Zeng Q, Wortman J, Birren B, Willems RJ, Earl AM, Gilmore MS. 2013. Emergence of epidemic multidrug-resistant Enterococcus faecium from animal and commensal strains. mBio 4(4):e00534-13. doi: 10.1128/mBio.00534-13. [DOI] [PMC free article] [PubMed] [Google Scholar]
- 9.Donlan RM, Costerton JW. 2002. Biofilms: survival mechanisms of clinically relevant microorganisms. Clin Microbiol Rev 15:167–193. doi: 10.1128/CMR.15.2.167-193.2002. [DOI] [PMC free article] [PubMed] [Google Scholar]
- 10.Sandoe JA, Witherden IR, Cove JH, Heritage J, Wilcox MH. 2003. Correlation between enterococcal biofilm formation in vitro and medical-device-related infection potential in vivo. J Med Microbiol 52:547–550. doi: 10.1099/jmm.0.05201-0. [DOI] [PubMed] [Google Scholar]
- 11.O'Toole G, Kaplan HB, Kolter R. 2000. Biofilm formation as microbial development. Annu Rev Microbiol 54:49–79. doi: 10.1146/annurev.micro.54.1.49. [DOI] [PubMed] [Google Scholar]
- 12.Abee T, Kovacs AT, Kuipers OP, van der Veen S. 2011. Biofilm formation and dispersal in Gram-positive bacteria. Curr Opin Biotechnol 22:172–179. doi: 10.1016/j.copbio.2010.10.016. [DOI] [PubMed] [Google Scholar]
- 13.Ahn SJ, Burne RA. 2006. The atlA operon of Streptococcus mutans: role in autolysin maturation and cell surface biogenesis. J Bacteriol 188:6877–6888. doi: 10.1128/JB.00536-06. [DOI] [PMC free article] [PubMed] [Google Scholar]
- 14.Allesen-Holm M, Barken KB, Yang L, Klausen M, Webb JS, Kjelleberg S, Molin S, Givskov M, Tolker-Nielsen T. 2006. A characterization of DNA release in Pseudomonas aeruginosa cultures and biofilms. Mol Microbiol 59:1114–1128. doi: 10.1111/j.1365-2958.2005.05008.x. [DOI] [PubMed] [Google Scholar]
- 15.Petersen FC, Tao L, Scheie AA. 2005. DNA binding-uptake system: a link between cell-to-cell communication and biofilm formation. J Bacteriol 187:4392–4400. doi: 10.1128/JB.187.13.4392-4400.2005. [DOI] [PMC free article] [PubMed] [Google Scholar]
- 16.Qin Z, Ou Y, Yang L, Zhu Y, Tolker-Nielsen T, Molin S, Qu D. 2007. Role of autolysin-mediated DNA release in biofilm formation of Staphylococcus epidermidis. Microbiology 153:2083–2092. doi: 10.1099/mic.0.2007/006031-0. [DOI] [PubMed] [Google Scholar]
- 17.Steinberger RE, Holden PA. 2005. Extracellular DNA in single- and multiple-species unsaturated biofilms. Appl Environ Microbiol 71:5404–5410. doi: 10.1128/AEM.71.9.5404-5410.2005. [DOI] [PMC free article] [PubMed] [Google Scholar]
- 18.Vilain S, Pretorius JM, Theron J, Brozel VS. 2009. DNA as an adhesin: Bacillus cereus requires extracellular DNA to form biofilms. Appl Environ Microbiol 75:2861–2868. doi: 10.1128/AEM.01317-08. [DOI] [PMC free article] [PubMed] [Google Scholar]
- 19.Paganelli FL, Willems RJ, Jansen P, Hendrickx A, Zhang X, Bonten MJ, Leavis HL. 2013. Enterococcus faecium biofilm formation: identification of major autolysin AtlAEfm, associated Acm surface localization, and AtlAEfm-independent extracellular DNA release. mBio 4(2):e00154-13. doi: 10.1128/mBio.00154-13. [DOI] [PMC free article] [PubMed] [Google Scholar]
- 20.Flemming HC, Wingender J. 2010. The biofilm matrix. Nat Rev Microbiol 8:623–633. doi: 10.1038/nrmicro2415. [DOI] [PubMed] [Google Scholar]
- 21.Tielker D, Hacker S, Loris R, Strathmann M, Wingender J, Wilhelm S, Rosenau F, Jaeger KE. 2005. Pseudomonas aeruginosa lectin LecB is located in the outer membrane and is involved in biofilm formation. Microbiology 151:1313–1323. doi: 10.1099/mic.0.27701-0. [DOI] [PubMed] [Google Scholar]
- 22.Diggle SP, Stacey RE, Dodd C, Camara M, Williams P, Winzer K. 2006. The galactophilic lectin, LecA, contributes to biofilm development in Pseudomonas aeruginosa. Environ Microbiol 8:1095–1104. doi: 10.1111/j.1462-2920.2006.001001.x. [DOI] [PubMed] [Google Scholar]
- 23.Johansson EM, Crusz SA, Kolomiets E, Buts L, Kadam RU, Cacciarini M, Bartels KM, Diggle SP, Camara M, Williams P, Loris R, Nativi C, Rosenau F, Jaeger KE, Darbre T, Reymond JL. 2008. Inhibition and dispersion of Pseudomonas aeruginosa biofilms by glycopeptide dendrimers targeting the fucose-specific lectin LecB. Chem Biol 15:1249–1257. doi: 10.1016/j.chembiol.2008.10.009. [DOI] [PubMed] [Google Scholar]
- 24.Branda SS, Chu F, Kearns DB, Losick R, Kolter R. 2006. A major protein component of the Bacillus subtilis biofilm matrix. Mol Microbiol 59:1229–1238. doi: 10.1111/j.1365-2958.2005.05020.x. [DOI] [PubMed] [Google Scholar]
- 25.Lasa I, Penades JR. 2006. Bap: a family of surface proteins involved in biofilm formation. Res Microbiol 157:99–107. doi: 10.1016/j.resmic.2005.11.003. [DOI] [PubMed] [Google Scholar]
- 26.Bankevich A, Nurk S, Antipov D, Gurevich AA, Dvorkin M, Kulikov AS, Lesin VM, Nikolenko SI, Pham S, Prjibelski AD, Pyshkin AV, Sirotkin AV, Vyahhi N, Tesler G, Alekseyev MA, Pevzner PA. 2012. SPAdes: a new genome assembly algorithm and its applications to single-cell sequencing. J Comput Biol 19:455–477. doi: 10.1089/cmb.2012.0021. [DOI] [PMC free article] [PubMed] [Google Scholar]
- 27.Seemann T. 2014. Prokka: rapid prokaryotic genome annotation. Bioinformatics 30:2068–2069. doi: 10.1093/bioinformatics/btu153. [DOI] [PubMed] [Google Scholar]
- 28.Ekseth OK, Kuiper M, Mironov V. 2014. orthAgogue: an agile tool for the rapid prediction of orthology relations. Bioinformatics 30:734–736. doi: 10.1093/bioinformatics/btt582. [DOI] [PubMed] [Google Scholar]
- 29.Enright AJ, Van Dongen S, Ouzounis CA. 2002. An efficient algorithm for large-scale detection of protein families. Nucleic Acids Res 30:1575–1584. doi: 10.1093/nar/30.7.1575. [DOI] [PMC free article] [PubMed] [Google Scholar]
- 30.Edgar RC. 2004. MUSCLE: multiple sequence alignment with high accuracy and high throughput. Nucleic Acids Res 32:1792–1797. doi: 10.1093/nar/gkh340. [DOI] [PMC free article] [PubMed] [Google Scholar]
- 31.Capella-Gutiérrez S, Silla-Martinez JM, Gabaldon T. 2009. trimAl: a tool for automated alignment trimming in large-scale phylogenetic analyses. Bioinformatics 25:1972–1973. doi: 10.1093/bioinformatics/btp348. [DOI] [PMC free article] [PubMed] [Google Scholar]
- 32.Price MN, Dehal PS, Arkin AP. 2010. FastTree 2—approximately maximum-likelihood trees for large alignments. PLoS One 5:e9490. doi: 10.1371/journal.pone.0009490. [DOI] [PMC free article] [PubMed] [Google Scholar]
- 33.Schneider CA, Rasband WS, Eliceiri KW. 2012. NIH Image to ImageJ: 25 years of image analysis. Nat Methods 9:671–675. doi: 10.1038/nmeth.2089. [DOI] [PMC free article] [PubMed] [Google Scholar]
- 34.Verkaik NJ, de Vogel CP, Boelens HA, Grumann D, Hoogenboezem T, Vink C, Hooijkaas H, Foster TJ, Verbrugh HA, van Belkum A, van Wamel WJ. 2009. Anti-staphylococcal humoral immune response in persistent nasal carriers and noncarriers of Staphylococcus aureus. J Infect Dis 199:625–632. doi: 10.1086/596743. [DOI] [PubMed] [Google Scholar]
- 35.Kropec A, Sava IG, Vonend C, Sakinc T, Grohmann E, Huebner J. 2011. Identification of SagA as a novel vaccine target for the prevention of Enterococcus faecium infections. Microbiology 157:3429–3434. doi: 10.1099/mic.0.053207-0. [DOI] [PubMed] [Google Scholar]
- 36.Heydorn A, Nielsen AT, Hentzer M, Sternberg C, Givskov M, Ersboll BK, Molin S. 2000. Quantification of biofilm structures by the novel computer program COMSTAT. Microbiology 146(Part 10):2395–2407. [DOI] [PubMed] [Google Scholar]
- 37.Hendrickx AP, van Wamel WJ, Posthuma G, Bonten MJ, Willems RJ. 2007. Five genes encoding surface-exposed LPXTG proteins are enriched in hospital-adapted Enterococcus faecium clonal complex 17 isolates. J Bacteriol 189:8321–8332. doi: 10.1128/JB.00664-07. [DOI] [PMC free article] [PubMed] [Google Scholar]
- 38.Sanger F, Coulson AR. 1975. A rapid method for determining sequences in DNA by primed synthesis with DNA polymerase. J Mol Biol 94:441–448. doi: 10.1016/0022-2836(75)90213-2. [DOI] [PubMed] [Google Scholar]
- 39.Tamura K, Stecher G, Peterson D, Filipski A, Kumar S. 2013. MEGA6: Molecular Evolutionary Genetics Analysis version 6.0. Mol Biol Evol 30:2725–2729. doi: 10.1093/molbev/mst197. [DOI] [PMC free article] [PubMed] [Google Scholar]
- 40.Chou PY, Fasman GD. 1974. Conformational parameters for amino acids in helical, beta-sheet, and random coil regions calculated from proteins. Biochemistry 13:211–222. doi: 10.1021/bi00699a001. [DOI] [PubMed] [Google Scholar]
- 41.Chou PY, Fasman GD. 1974. Prediction of protein conformation. Biochemistry 13:222–245. doi: 10.1021/bi00699a002. [DOI] [PubMed] [Google Scholar]
- 42.Lam MM, Seemann T, Bulach DM, Gladman SL, Chen H, Haring V, Moore RJ, Ballard S, Grayson ML, Johnson PD, Howden BP, Stinear TP. 2012. Comparative analysis of the first complete Enterococcus faecium genome. J Bacteriol 194:2334–2341. doi: 10.1128/JB.00259-12. [DOI] [PMC free article] [PubMed] [Google Scholar]
- 43.de Regt MJ, van Schaik W, van Luit-Asbroek M, Dekker HA, van Duijkeren E, Koning CJ, Bonten MJ, Willems RJ. 2012. Hospital and community ampicillin-resistant Enterococcus faecium are evolutionarily closely linked but have diversified through niche adaptation. PLoS One 7:e30319. doi: 10.1371/journal.pone.0030319. [DOI] [PMC free article] [PubMed] [Google Scholar]
- 44.van Schaik W, Top J, Riley DR, Boekhorst J, Vrijenhoek JE, Schapendonk CM, Hendrickx AP, Nijman IJ, Bonten MJ, Tettelin H, Willems RJ. 2010. Pyrosequencing-based comparative genome analysis of the nosocomial pathogen Enterococcus faecium and identification of a large transferable pathogenicity island. BMC Genomics 11:239. doi: 10.1186/1471-2164-11-239. [DOI] [PMC free article] [PubMed] [Google Scholar]
- 45.Zhang X, Paganelli FL, Bierschenk D, Kuipers A, Bonten MJ, Willems RJ, van Schaik W. 2012. Genome-wide identification of ampicillin resistance determinants in Enterococcus faecium. PLoS Genet 8:e1002804. doi: 10.1371/journal.pgen.1002804. [DOI] [PMC free article] [PubMed] [Google Scholar]
- 46.Teng F, Kawalec M, Weinstock GM, Hryniewicz W, Murray BE. 2003. An Enterococcus faecium secreted antigen, SagA, exhibits broad-spectrum binding to extracellular matrix proteins and appears essential for E. faecium growth. Infect Immun 71:5033–5041. doi: 10.1128/IAI.71.9.5033-5041.2003. [DOI] [PMC free article] [PubMed] [Google Scholar]
- 47.Aakra A, Vebo H, Snipen L, Hirt H, Aastveit A, Kapur V, Dunny G, Murray BE, Nes IF. 2005. Transcriptional response of Enterococcus faecalis V583 to erythromycin. Antimicrob Agents Chemother 49:2246–2259. doi: 10.1128/AAC.49.6.2246-2259.2005. [DOI] [PMC free article] [PubMed] [Google Scholar]
- 48.Tran SL, Guillemet E, Gohar M, Lereclus D, Ramarao N. 2010. CwpFM (EntFM) is a Bacillus cereus potential cell wall peptidase implicated in adhesion, biofilm formation, and virulence. J Bacteriol 192:2638–2642. doi: 10.1128/JB.01315-09. [DOI] [PMC free article] [PubMed] [Google Scholar]
- 49.Mohamed JA, Teng F, Nallapareddy SR, Murray BE. 2006. Pleiotrophic effects of 2 Enterococcus faecalis sagA-like genes, salA and salB, which encode proteins that are antigenic during human infection, on biofilm formation and binding to collagen type I and fibronectin. J Infect Dis 193:231–240. doi: 10.1086/498871. [DOI] [PubMed] [Google Scholar]
Associated Data
This section collects any data citations, data availability statements, or supplementary materials included in this article.