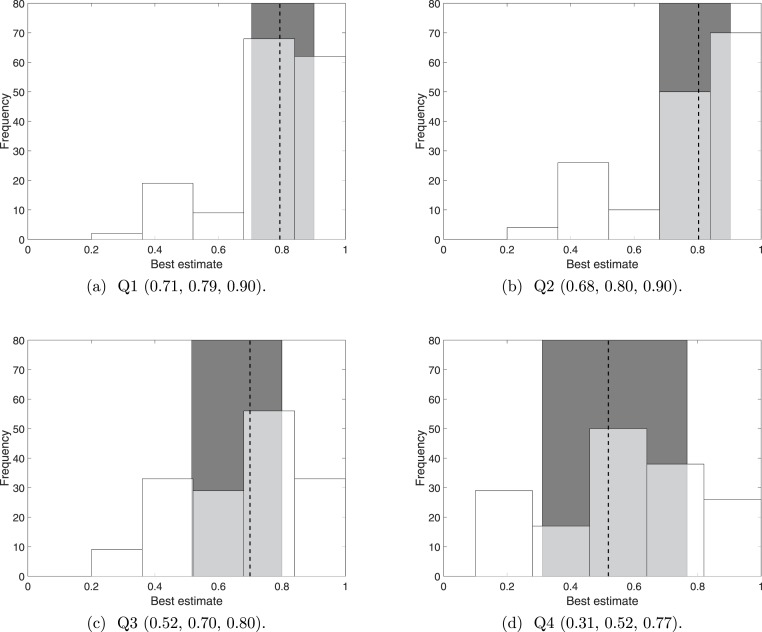
Figure 1. The distribution of ‘best’ estimates over 160 (5 experts scoring 32 sightings) responses, together with the 25th, 50th, and 75th percentiles.
The dotted line indicates the 50th percentile (the median) and the shaded error indicates the interquartile range (the range between the 25th and 75th percentile). The 25th, 50th and 75th percentile values are provided under each plot.

