

Abstract
The objective of this review was to assess whether early age at first childbirth is associated with increased risk of poor pregnancy outcomes. Early age at childbirth is variously defined in studies of its effect on maternal and infant health. In this systematic review, we limit analysis to studies of at least moderate quality that examine first births among young mothers, where young maternal age is defined as low gynaecological age (≤2 years since menarche) or as a chronological age ≤16 years at conception or delivery. We conduct meta-analyses for specific maternal or infant health outcomes when there are at least three moderate quality studies that define the exposure and outcome in a similar manner and provide odds ratios or risk ratios as their effect estimates. We conclude that the overall evidence of effect for very young maternal age (<15 years or <2 years post-menarche) on infant outcomes is moderate; that is, future studies are likely to refine the estimate of effect or precision but not to change the conclusion. Evidence points to an impact of young maternal age on low birthweight and preterm birth, which may mediate other infant outcomes such as neonatal mortality. The evidence that young maternal age increases risk for maternal anaemia is also fairly strong, although information on other nutritional outcomes and maternal morbidity/mortality is less clear. Many of the differences observed among older teenagers with respect to infant outcomes may be because of socio-economic or behavioural differences, although these may vary by country/ setting. Future, high quality observational studies in low income settings are recommended in order to address the question of generalisability of evidence. In particular, studies in low income countries need to consider low gynaecological age, rather than simply chronological age, as an exposure. As well, country-specific studies should measure the minimum age at which childbearing for teens has similar associations with health as childbearing for adults. This ‘tipping point’ may vary by the underlying physical and nutritional health of girls and young women.
Keywords: Age at first pregnancy, adolescent pregnancy, maternal nutritional status, maternal morbidity, maternal mortality, preterm, premature, low birthweight, still birth, neonatal death, neonatal mortality
Approximately 11 per cent of births worldwide are to women 15–19 years old, and 95 per cent of these are in low and middle income countries.1 Adolescent childbearing is more common in sub-Saharan Africa, Bangladesh, and parts of India, especially in rural areas and communities where education levels for girls and women are low.1 While average age at first childbirth is increasing in most areas, the persistence of adolescent parenting among the poorest populations continues to be a cause for concern.2
The United Nations 2010 report on progress towards achieving Millennium Development Goals3 noted that ‘[p]reventing … pregnancies among adolescents would also improve the health of women and girls and increase the chances that their children will survive’3 (p. 80). This ‘health theme in family planning,’ recognised for almost 100 years, has conceptually linked family planning with maternal and child health initiatives for at least 40 years.4
One of the reasons for this linkage is the long-observed association between adolescent childbearing and poor maternal, infant and child health outcomes. However, whether this association is causal or rather associated with the relatively poorer social status of child brides/adolescent mothers remains controversial.5 To attempt to clarify whether the evidence is sufficient to prioritise early childbearing prevention to improve maternal nutrition-associated health, in this review we examine studies with high enough quality to rate as a grade of ‘moderate’ in the GRADE system (Grading of Recommendations Assessment, Development and Evaluation), described in detail elsewhere.6,7 We conduct a meta-analysis when there are at least three moderate quality studies of a particular health outcome that define the exposure group and outcome similarly and provide a risk ratio or odds ratio (OR) as their effect estimate. Ideally, a study would examine the effect of early childbearing on maternal nutrition directly, but there are few such studies. Therefore, we included studies of infant outcomes [such as low birthweight (LBW), neonatal mortality, and stillbirth] and maternal morbidity, which are indirect measures of maternal health.
Methods
Systematic review
The objective of this review was to assess whether early age at first childbirth is associated with increased risk of poor pregnancy outcomes. The systematic literature search was conducted by the authors and another Masters of Public Health student at Emory University. All attended a 1-day training workshop on the methodology for conducting the systematic review, data abstraction, and assessing the overall quality of evidence using the GRADE method. The training was led by experts in systematic reviews and the GRADE and Lives Saved Tool (LiST) methods.8 After training, screeners examined all titles and abstracts returned by the search, excluded those deemed irrelevant, and reviewed full-text articles for potentially eligible studies. Questions relating to whether an article met the inclusion criteria were discussed among the authors.
Literature search
We utilised six major search engines (PubMed/ MEDLINE, POPLINE, ISI Web of Science, EMBASE, Cochrane Reference Libraries, and CINAHL); we limited searches to English only and human subjects. Our search terms varied slightly according to the required syntax particular to each search engine. Search terms listed in Appendix 1 are formatted for the PubMed search engine. We retrieved and reviewed both electronic and non-electronic sources. When a database returned unpublished results, we attempted to find the studies with the help of a reference librarian. In addition, we manually searched the references of a limited number of studies. We did not contact authors to identify additional studies. Our methods were similar to those used for a recent review of the impact of contraception on perinatal mortality.9
Eligibility criteria
In general, we excluded descriptive studies, general review articles, and commentaries in our systematic review; however, we did include meta-analyses/ systematic reviews that examined the association between adolescent pregnancy and outcome(s) of interest and that used a clear, systematic methodology for selecting studies. Study data for the same outcome were included only once (i.e. if a study that met our inclusion criteria was already cited in a meta-analysis for LBW, we only used the LBW data from the meta-analysis). For studies not previously included in a meta-analysis, we restricted papers to those that defined exposure as maternal age ≤16 at conception or delivery (or some subset of that). There were no restrictions on the age range of the comparison group. Phipps and Sowers10 define early adolescent child-bearing as <16 years of age, but we wanted to account for the later menarche that may occur in some less developed areas of the world. We also included studies that examined low gynaecologic age (≤2 years after menarche) as an exposure. We excluded studies that did not define the outcome, did not examine confounding or effect modification, did not control for parity (either by restricting to the woman’s first pregnancy or by matching/multivariable analysis), or did not control for some measure of socio-economic status (SES) by matching or multivariable analysis. If an author classified infants as ‘premature’ or ‘preterm’ using birthweight cut-offs (rather than classifying based on gestational age), we included these data in our analysis of LBW and not preterm birth (PTB). Additionally, for matched cohort studies that presented results using several narrow birthweight categories, we grouped birthweight categories <2500 grams to analyse LBW. Across the studies, there were numerous differences in how SES and other potential confounders were defined. For clarity in comparison, rather than ‘lumping’ these variables, we chose to code and list them as defined in the studies (see Appendix 2). Our inclusion criteria regarding control for confounding and SES were somewhat similar to those used by Conde-Agudelo et al. in a review of birth spacing and adverse perinatal outcomes.11
We searched for maternal nutrition outcomes including anaemia, change in gestational body composition, and pre-pregnancy weight and/or anthropometric measures. We included studies that met either the World Health Organisation definition of anaemia threshold values (120 g/L for non-pregnant women over 15 years of age and 110 g/L for pregnant women12) or the International Nutritional Anemia Consultative Group (INACG) recommended cut-off values (which are divided by trimesters of 110 g/L for first and third trimesters or if trimester is unknown, and 105 g/L for second trimester haemoglobin measurements13). Studies of gestational body composition change were excluded if they did not account for initial weight and/or body composition. We searched for maternal morbidity outcomes of pregnancy-induced hypertension (PIH) including eclampsia, HELLP (Hemolysis, Elevated Liver Enzymes, Low Platelet count), and pre-eclampsia; obstetric labour complications, including abruptio placentae, cephalopelvic disproportion, dystocia, placenta accreta, placenta previa, post-partum haemorrhage, uterine inversion, uterine rupture, and vasa previa; oligohydramnios and polyhydramnios; haematologic pregnancy complications; infectious pregnancy complications, including parasitic and puerperal infections; puerperal disorders, including post-partum depression, mastitis, post-partum haemorrhage, post-partum thyroiditis, pubic symphysis diastasis, and puerperal infection; and obstetric fistula. Placental diseases included abruptio placentae, chorioamnionitis, retained placenta, and placental insufficiency. We also searched for maternal mortality.
We searched for infant outcomes of LBW, very low birthweight (VLBW), or moderately low birthweight (MLBW) (with birthweight specified in grams); preterm or very preterm delivery (with weeks specified); neonatal or early neonatal mortality (with weeks specified); stillbirth; and perinatal mortality. We excluded studies that reported only infant mortality or postneonatal mortality, because infant death after the neonatal period may be affected more by the infant’s postnatal environment than by maternal nutritional status or infant health at birth. We also excluded outcomes of small for gestational age and intrauterine growth restriction because of differing outcome definitions across studies.
Grading of Recommendations Assessment, Development and Evaluation assesses a study’s evidence quality based on study design, limitations/biases, consistency of results, applicability of evidence, precision, and publication bias. Evidence may be downgraded (e.g. if there are serious limitations) or upgraded (e.g. if consistency is high).7 Within the GRADE system, observational studies begin at ‘low’ quality, but they may be upgraded. To assure that all studies in this systematic review were at least moderate quality, we used the inclusion criteria described previously. Categorisation of countries as high-, middle- or low-income countries was done using the World Bank Country classification.
Study selection process
We searched for papers entered into the search engines by 31 January 2011. Our separate searches for age at first pregnancy returned 577 articles of maternal nutritional status, 1250 studies of maternal morbidity or mortality, and 1190 studies of infant outcomes, with some overlap of studies that included both maternal and infant outcomes. There were 43 studies that met our final inclusion criteria for data quality and relevant information.
Data extraction
Studies meeting inclusion criteria were abstracted into an abstraction table that we adapted from previous GRADE studies to account for inclusion of observational studies. This table was piloted and finalised through training workshops. A random subsample of 30% of the included articles was double abstracted by the senior author to ensure the accuracy and completeness of the abstraction procedure. Key variables abstracted were related to the study identifiers and context, study design and limitations, and associations with the outcomes of interest.
Statistical analysis
When at least three studies of comparable exposures/ outcomes were abstracted, we conducted a meta-analysis using the inverse-variance method for weighting and a random-effects model to calculate a summary OR, transformed to a natural log scale. Weights were derived from the standard error estimated from the reported 95% confidence intervals (CI). We tested for heterogeneity using both the Chi-squared and the I2 statistic based on a random-effects model. Meta-analyses were conducted using Review Manager Software version 5.1 (Copenhagen, Denmark).
Level of evidence
The quality of overall evidence was assessed and graded according to the Child Health Epidemiology Reference Group (CHERG) adaptation of the GRADE technique.14,15 Overall assessment of the evidence depends on both the amount and the quality of studies in the systematic review. The GRADE System classifies overall quality of evidence as very low (very uncertain effect estimates), low (further research will likely change the effect estimate), moderate (further research may change the estimate and our confidence in it), or high (further research is unlikely to change the effect estimate and our confidence in it).7
In the results section, we present findings from the systematic review of the association of age at first pregnancy with (i) maternal health (nutritional outcomes and maternal morbidity/mortality), and (ii) infant outcomes. CIs [in brackets] are 95% CI, unless otherwise noted. This is followed by a summary discussion of the level of evidence for each outcome.
Results
Age at first pregnancy and maternal health
Anaemia
Eight studies meeting our inclusion criteria are summarised in Table 1. Five (three in high income countries16–18 and two in middle income countries19,20) controlled for potential confounders by matching, but none controlled on the same confounders, which made interpretation of the mixed results difficult. Scholl et al.,17 Konje et al.,16 and Phupong et al.19 found significant associations, Ncayiyana et al.20 did not find a significant association, and Hulka et al.18 found a significant inverse association for post-partum anaemia and a nonsignificant association for antenatal anaemia (Table 1).
Table 1.
Age at first pregnancy and anaemia
| Source | Study type Countrya | Ages (#) of exposed Ages of unexposed |
Outcome definition | When outcome was measured | Variables controlledb | Mean (SD) Hb level (P-value) | Crude OR [95% CI] | Adjusted OR [95% CI] |
|---|---|---|---|---|---|---|---|---|
| High income countries | ||||||||
| Hulka et al., 196418 | Retrospective cohortc US | ≤15 years (139) 19–21 years |
Hb ≤10.4 g/dL | Any time during antenatal period | Class (1) | – | NCd | 0.41 [0.13, 1.23] |
| Hulka et al., 196418 | Any time during post-partum period | – | NCd | 0.20 [0.07, 0.54] | ||||
| Scholl et al., 198417 | Matched case–control US | ≤15 years (32) ≥20 years |
Hb (g/dL) continuous | Hb at registration | Infant char (26), and matched on: Class (1), Pg hx (10), QoC (94), Setting (8), Drug alc/hx (5, 6) | ≤15 years: 11.4(0.9) ≥20 years: 11.9 (0.9) P = 0.03 |
– | – |
| Konje et al., 199216 | Retrospective cohort (matched)c GB | ≤16 years (1660) 20–24 years |
Hb <10.5 g/dL | Any stage of pregnancy | Matched on: SES (4), Setting (8) | – | – | 2.53 [2.19, 2.92]f |
| de Vienne et al., 200922 | Retrospective cohorte FR | 16 years (49) 20 years |
Hb <10 g/dL | 1st trimester if risk factors, 6 months for every woman | Class (1), SES (2,3), Drug/alc use (5), Pg hx (24) | – | 1.46fg | 1.27 [1.15, 1.40]fg |
| Lewis et al., 200923 | Retrospective cohorte AU | 12–16 years (183) >19 years |
Hb <110 g/L | Antenatal records | Class (1), Drug/alc use (5) | – | 3.07 [2.02, 4.56] | 1.61 [1.02, 2.54] |
| Middle income countries | ||||||||
| Ncayiyana et al., 198920 | Retrospective cohort (matched)e ZA | ≤16 years (515) 20–29 years |
Mean Hb (g/dL) | Post-partum | Matched on: Pg hx (10), SES (4), Setting (33) | ≤16 years: 10.9 20–29 years: 11.1 P > 0.05 |
– | |
| Conde-Agudelo et al., 200521 | Retrospective cohort Multi: UY, AR, PE, CO, HN, PY, SV, CL, BO, CR, PA, DO, NI, BR, EC, MX, BZ, VE | ≤15 years (33 498) 20–24 years |
Hb <10.5 g/dL | During pregnancy | SES (2, 3), Drug/alc use (5), QoC (21, 82, 83), Setting (8, 9), Pg hx (10, 18, 24, 68, 95), Mat body comp (13, 14, 59) | – | 1.40 [0.95, 2.04] | 1.41 [1.33, 1.50] |
| Phupong et al., 200719 | Retrospective cohort (matched)e TH | <15 years (121) 20–29 years |
1st & 3rd trimesters: Hb <11.0 g/dL 2nd trimester: Hb <10.5 g/dL |
Medical records from antenatal care | Matched on: Class (1), Infant Char (11), Setting (8) | – | NCd | 2.8 [1.2, 6.6] |
ISO (International Organization for Standardization) code.
See Appendix 2 for confounder definitions.
Restricted to first pregnancy in adults; unclear for adolescents.
Not calculable with the data provided.
Restricted to first pregnancy in study & comparison groups.
Risk ratio.
Used predicted outcome rates and computed RR using log-binomial models at particular age points.
AR, Argentina; AU, Australia; BO, Bolivia; BR, Brazil; BZ, Beuze; CL, Chile; CO, Colombia; CR, Costa Rica; DO, Dominican Republic; EC, Ecuador; FR, France; GB, United Kingdom; HN, Honduras; MX, Mexico; NC, Nicaragua; PA, Panama; PE, Peru; PY, Paraguay; SV, El Salvador; TH, Thailand; UY, Uruguay; VE, Venezuela; ZA, South Africa.
NC, Not calculable with the data provided.
Three studies21–23 performed multivariable analyses for this outcome. In a study of numerous middle income Central and South American countries, Conde-Agudelo et al.21 found that anaemia was significantly more common among adolescents ≤15 years old than among 20–24-year-olds [the adjusted odds ratio (aOR) [95% CI] being 1.41 [1.33, 1.50]]. de Vienne et al.22 found that anaemia was significantly more common among 16-year-olds than among 20-year-olds in France [the adjusted risk ratio (aRR) being 1.27 [1.15, 1.40]]. In Australia, Lewis et al.23 found that anaemia was significantly more common among 12–16-year-olds than among women >19 (aOR = 1.61 [1.02, 2.54]). While these studies varied on their selections of confounders, they were similar enough to justify a meta-analysis, which resulted in an overall OR (random effects) of 1.36 [1.24, 1.49] (Figure 1).
Figure 1.
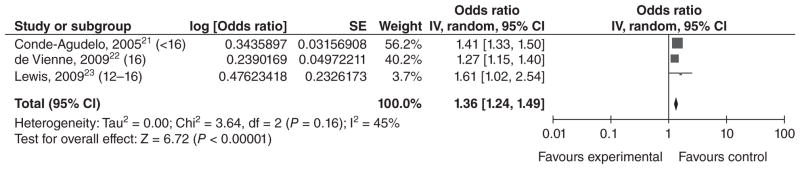
Forest plot for anaemia among adolescents <17 years of age.a,b
aNumbers in parentheses represent the age of the ‘exposed’ group in each study.
bIncluded studies are below, along with the ages of exposed & unexposed groups.
IV, inverse variance; CI, confidence interval.
Change in maternal body composition
Five studies met our inclusion criteria (Table 2). One was a retrospective cohort study,24 and four were prospective cohort studies;25–28 all but one26 were conducted in the US.
Table 2.
Age at first pregnancy and change in maternal body composition during pregnancy
| Source | Study type Countrya | Ages (#) of exposed Ages of unexposed |
Outcome definition | Variables controlledb | Crude OR [95% CI] Mean (SD) |
Adjusted OR [95% CI] |
|---|---|---|---|---|---|---|
| High income countries | ||||||
| Howie et al., 200328 | Prospective cohort US | ≤15 years (18 619) 25–29 years |
Excessive maternal weight gain (≥40 kg) | SES (2), Setting (9), Pg hx (10), Infant char (26) | 1.75 [1.70, 1.81] | 1.44 [1.39, 1.49] |
|
| ||||||
| Results summary | ||||||
|
| ||||||
| Loris et al., 198527 | Prospective cohort US | 13–15.9 years (18) 18–19.9 years |
Total weight gain (lbs) | Infant char (26c), Class (1), Pg hx (10) | Age at delivery was not significantly associated with total weight gain. | |
| Haiek et al., 198924 | Retrospective cohortd US | ≤15 years (90) 19–30 years |
Difference between pre-pregnancy weight (kg) and weight at or within one month of deliverye | Stratified on: Mat body comp (47) | ≤15 years: Low weight (<90% std.): 14.5; Average weight (90–110% std): 14.7; High weight (>110% std): 16.0 19–30 years: Low weight (<90% std.): 15.5; Average weight (90–110% std.): 15.8; High weight (>110% std.): 16.9 |
|
| Perry et al., 199625 | Prospective cohortf US | <16 years (239) 18–29 years |
Weight gain (kg) | Class (1), Drug/alc use (5), Infant char (26) | <16 years: 15.4 (6.9) 18–29 years: 23.0 (4.6) P < 0.05 by ANCOVA analysis |
|
| Low income country | ||||||
| Katz et al., 201026 | Prospective cohortf NP | <16 years (173) 20–25 years |
MUAC change (early, late pregnancy, post-partum) | Class (1), SES (2, 79), Infant char (26), Mat body comp (93) | Crude change (cm): <16 years: −0.78 [–0.95, −0.61] 20–25 years: −0.32 [–0.41, −0.23] |
Adjusted change (cm): <16 years: −0.97 [–1.33, −0.60] 20–25 years: −0.40 [–0.70, −0.10] |
ISO (International Organization for Standardization) code.
See Appendix 2 for confounder definitions.
Only full-term deliveries were included.
Restricted to first pregnancy in adolescents; unclear for adults.
Reported mean values.
Restricted to first pregnancy in study & comparison groups.
MUAC, mid-upper arm circumference; NP, Nepal; std., standardized weight for height.
For weight gain during pregnancy, all included studies showed either a higher weight gain (or higher prevalence of excessive weight gain) in adolescents or a nonsignificant association. However, the study conducted in Nepal26 found that change in mid-upper arm circumference (MUAC) from early pregnancy to 12 weeks post-partum was associated with maternal age; the decrease in adolescents was significantly greater than the decrease in adults, which the authors proposed was because of lactation (adjusted change in cm [95% CI] among adolescents <16 was −0.97 [−1.33, −0.60], vs. a change of −0.40 [−0.70, −0.10] in 20–25-year-olds). We could not conduct a meta-analysis because of the heterogeneous outcome definitions used.
Pre-pregnancy nutritional status
To be abstracted, studies of pre-pregnancy nutritional status had to report pre-pregnancy weight or body mass index (BMI). In addition, to be included in the systematic review, the studies had to report the association between pre-pregnancy weight/BMI and the study outcome. Only three studies met all inclusion criteria (Table 3), because many studies reporting pre-pregnancy weight simply adjusted for this variable in analyses of other exposures/outcomes and did not give sufficient data to assess the association between pre-pregnancy weight and maternal age. All three studies in Table 3 originated in Camden, New Jersey –two from the Camden prospective cohort study (1985–199225 and 1985–199529) and one from an earlier case–control study.17 Scholl et al.17 found no significant differences in pre-pregnancy weights reported in clinical records between adolescents ≤15 years of age and adults ≥20. Both reports from the Camden cohort study found that self-reported pre-pregnancy BMI was slightly but significantly lower among adolescents who were <16 at their last menstrual period (LMP) than among adults aged 18–29 at LMP (22.1 vs. 23.025 and 21.9 vs. 23.429).
Table 3.
Age at first pregnancy and pre-pregnancy nutritional status
| Source | Study type Countrya | Ages (#) of exposed Ages of unexposed |
Outcome definition | How outcome was measured | Variables controlledb | Mean (SD) P-value |
|---|---|---|---|---|---|---|
| High income countries | ||||||
| Scholl et al., 198417 | See Table 1 for study details | Pre-pregnancy weight (kg) | Obstetric records | ≤15 years: 52.6 (7.0) ≥20 years: 55.8 (8.9) P > 0.05 |
||
| Perry et al., 199625 | See Table 2 for study details | Pre-pregnancy BMI (kg/m2) | Weight: self-report Height: measured at clinic |
Class (1), Drug/alc use (5) | <16 years: 22.1 (3.3) 18–29 years: 23.0 (4.6) P < 0.05 |
|
| Hediger et al., 199729 | Prospective cohortc US | <16 years (366) 18–29 years |
Pre-pregnancy BMI | Weight: self-report Height: measured at clinic |
Class (1), Drug/alc use (5) | <16 years: 21.9 (0.2) 18–29 years: 23.4 (0.3) P < 0.05 |
ISO (International Organization for Standardization) code.
See Appendix 2 for confounder definitions.
Restricted to first pregnancy in study & comparison groups.
BMI, body mass index.
Maternal morbidity/mortality
Only two studies met our inclusion criteria (Table 4). In a report from the Camden Study, maternal lacerations were significantly lower among primiparas <16 years at LMP than among primiparas aged 18–29 years at LMP (aOR = 0.56 [0.34, 0.93]).25 In Thailand, Phupong et al.19 found no difference in premature rupture of membranes between adolescents <15 years old and 20–29-year-olds matched on race, infant gender, and year of delivery. However, pre-eclampsia was significantly more common in adolescents in this study, although the small sample size resulted in an imprecise estimate (aOR = 5.4 [1.2, 25]).
Table 4.
Age at first pregnancy and maternal morbidity/mortality
| Source | Study type Countrya | Ages (#) of exposed Ages of unexposed |
Outcome definition | Variables controlledb | Crude OR [95% CI] | Adjusted OR [95% CI] |
|---|---|---|---|---|---|---|
| High income country | ||||||
| Perry et al., 199625 | See Table 2 for study details | <16 years (274) 18–29 years |
Lacerations of the first degree, second degree, third degree, and fourth degree | Class (1), Mat body comp (13, 14, 17), Drug/alc use (5), Infant char (11) | 0.68 [0.44, 1.06]c | 0.56 [0.3, 0.93] |
| Middle income country | ||||||
| Phupong et al., 200719 | See Table 1 for study details | Preeclampsia: blood pressure of at least 140/90 mmHg and proteinuria of at least 300 mg per 24 h or at least 1+ on dipstick testing | NCd | 5.4 [1.2, 25] | ||
| Phupong et al., 200719 | See Table 1 for study details | Premature rupture of membranes (PROM): rupture of membranes before onset of labour | NCd | 0.5 [0.1, 1.7] | ||
ISO (International Organization for Standardization) code.
See Appendix 2 for confounder definitions.
Calculated manually by authors of the systematic review.
Not calculable with the data provided.
NC, Not calculable with the data provided.
Age at first pregnancy and infant health
Low birthweight
Twenty studies met our inclusion criteria for LBW (typically defined as a birthweight <2500 g). Of these, 11 reported results for LBW only, and nine presented results for VLBW (<1500 g) as well as MLBW (1500–2499 g) or LBW. The four studies conducted in middle income countries21,30–32 reported that LBW was significantly higher among infants of younger mothers (Table 5). Sixteen of the 20 studies were conducted in high income countries: 13 in the United States,18,33–44 and one each in Saudi Arabia,45 Australia,23 and France.22 The majority of these studies found that LBW occurred significantly more often among infants of young mothers than among infants of older mothers (for all or for a subset of the groups they studied). However, six of the studies from high income countries did not find a significant association. Additionally, Reichman and Paganini40 compared mothers <15 years of age with mothers 25–29 years of age and reported a significant association among whites but not blacks [aOR = 2.18 for whites (P < 0.01) and 0.96 for blacks (P > 0.05), respectively, no CI provided]. In order to ascertain whether there is a dose–response relationship between maternal age and LBW, we conducted a meta-analysis using the four studies that stratified mothers by age (Figures 2–4). In each of these papers, mothers ≤16 were stratified into three ‘exposure’ groups (youngest, middle and oldest) for comparison with an older ‘reference’ group. Although the age strata were slightly different in each study, we left the age groupings up to the discretion of the authors, as women in different countries may not mature at the same age. However, for Hulka et al.,18 we decided to group the 12/13-year-olds together, as results were presented separately for 12-, 13-, 14- and 15-year-olds. We found evidence of a dose–response relationship between maternal age and LBW, with the magnitude of the association decreasing as maternal age increased. The summary ORs for the youngest, middle, and oldest strata were 1.82 [1.60, 2.07]; 1.56 [1.31, 1.87]; and 1.42 [1.06, 1.89], respectively. For the youngest stratum, I2 was 0%. Among the middle-aged and older exposed groups, the effect estimates from DuPlessis et al.39 and Chen et al.32 were similar, while the effect estimates from Cooper et al.38 were less. This heterogeneity may be present as Cooper et al. used 15-year-olds as their reference group, who may be at higher risk of LBW than a group of 20–24-year-olds. The effect estimates from Hulka et al.18 were higher, but this was a hospital-based study from over 40 years ago. Differences in prenatal care or other factors could also impact the observed association between young maternal age and LBW.
Table 5.
Age at first pregnancy and low birthweight
| Source | Study type Countrya | Ages (#) of exposed Ages of unexposed |
Outcome definition | Variables controlledb | Crude OR [95% CI] | Adjusted OR [95% CI] |
|---|---|---|---|---|---|---|
| High income countries | ||||||
| Hulka et al., 196418 | See Table 1 for study details | ≤15 years (128) 19–21 years |
VLBW <1000 g | NCc |
All teens: 7.2 [0.89, 58.5]d 12/13 years: 7.2 [0.43, 121.2]d 14 years: 6.75 [0.59, 76.87]d 15 years: 7.40 [0.85, 64.62]d |
|
| Hulka et al., 196418 | LBW <2500 g | NCc |
All teens: 2.06 [0.99, 4.31]d 12/13 years: 1.87 [0.46, 7.50]d 14 years: 2.49 [0.92, 6.72]d 15 years: 1.93 [0.85, 4.38]d |
|||
| Spellacy et al., 197833 | Retrospective cohorte US | 10–15 years (144) 20–24 years |
LBW 500–2499 g | Class (1) | 2.66 [1.66, 4.25]d |
White: 0.84 [0.19, 3.63]d Black: 2.9 [1.64, 5.12]d |
| Duenhoelter et al., 197544 | Retrospective cohort (matched)e US | <15 years (471) 19–25 years |
VLBW <1500 g | Matched on Class (1), QoC (21) | NCc | 1.26 [0.65, 2.47]d |
| Duenhoelter et al., 197544 | LBW <2500 g | NCc | 1.26 [0.90, 1.77]d | |||
| Scholl et al., 198934 | Prospective cohorte US | ≤19 years with gyn. age ≤2 years (246) ≤19 years with gyn. age >2 years |
LBW <2500 g | Stratified by chronological age (12–14, 15, 16,17,18–19) and adjusted for Class (1), Drug/alc use (5), Mat body comp (13, 14) | 1.69 [1.13, 2.55] | 1.7 [1.01, 2.88] is summary OR across chronological ages |
| Ketterlinus et al., 199035 | Prospective cohorte US | 13–15 years (63) 22–30 years |
LBW <2500 g | Class (1), SES (2), Mat body comp (14, 47), Study/biases (32) | 1.63 [0.74, 3.59]d | 0.84 [0.37, 1.89] |
| Scholl et al., 199236 | Prospective cohorte US | 12–15 years (256) 18–29 years |
LBW <2500 g | Class (1), Drug/alc use (5), Mat body comp (13, 14) | Primigravidae: 0.75 [0.40, 1.43]d | Primigravidae: 0.72 [0.35, 1.44] |
| Satin et al., 199437 | Prospective cohorte US | 11–15 years (1622) 20–22 years |
VLBW ≤1500 g | Class (1), QoC (7) | 1.85 [1.34, 2.54]d | ‘Logistic regressional analysis controlling for demographic differences.. was consistent with the outcomes reported [OR not reported].’ |
| Satin et al., 199437 | MLBW 1500–2500 g | 1.47 [1.22, 1.78]d | ‘Logistic regressional analysis controlling for demographic differences.. was consistent with the outcomes reported [OR not reported].’ | |||
| Abalkhail, 199545 | Prospective cohort SA | ≤16 years (17) >19 years |
LBW <2500 g | SES (2, 3, 36), Drug/alc use (5), QoC (7), Pg hx (10, 12), Infant char (11), Mat body comp (13, 15, 16, 17) | 4.27 [1.73, 10.5] | 4.26 [1.51, 12.01] |
| Cooper et al., 199538 | Retrospective cohorte US | 10–12, 13, 14 years (37 261) 15 years |
VLBW <1500 g | Class (1), SES (2,3), QoC (7), Pg hx (10), Setting (33) |
10–12 years: 2.50 [1.88, 3.34]d 13 years: 1.99 [1.75, 2.26]d 14 years: 1.28 [1.18, 1.39]d |
10–12 years: 1.93 [1.40, 2.66] 13 years: 1.73 [1.5, 1.99] 14 years: 1.16 [1.06, 1.27] |
| Cooper et al., 199538 | LBW <2500 g |
10–12 years: 2.01 [1.70, 2.36]d 13 years: 1.49 [1.39, 1.60]d 14 years: 1.15 [1.10, 1.20]d |
10–12 years: 1.72 [1.44, 2.06] 13 years: 1.32 [1.22, 1.43] 14 years: 1.06 [1.01, 1.11] |
|||
| DuPlessis et al., 199739 | Retrospective cohort US | 10–13, 14, 15 years (9916) 20–24 years |
LBW <2500 g | Class (1), SES (3, 34, 35), QoC (7, 21, 22, 23), Pg hx (10, 12, 18), Setting (33) |
10–13 years: 2.34 [1.90, 2.88]d 14 years: 1.74 [1.53, 1.97]d 15 years: 1.74 [1.53, 1.98]d |
10–13 years: 1.97 [1.56, 2.50] 14 years: 1.70 [1.48, 1.95] 15 years: 1.62 [1.38, 1.89] |
| Reichman and Paganini, 199740 | Retrospective cohort US | <15 years (444) 25–29 years |
LBW <2500 g | SES (2, 3, 37), Drug/alc use (5, 6), QoC (7), Setting (8, 9, 33), Pg hx (10, 12, 18, 24, 25), Infant char (11) |
Whites: 4.87 [3.15, 7.54]d Blacks: 1.09 [0.76, 1.55]d |
Whites: 2.18 (P < 0.01) Blacks: 0.96 (P > 0.05) |
| Ekwo and Moawad, 200041 | Retrospective cohorte US | ≤15 years (270) 20–24 years |
VLBW <1500 g | Drug/alc use (5, 44), QoC (7), SES (34) | NCc | 0.57 [0.17, 1.91] |
| Ekwo and Moawad, 200041 | LBW <2500 g | NCc | 1.16 [0.70, 1.91] | |||
| Gilbert et al., 200442 | Retrospective cohorte US | 11–15 years, all races (31 232) 20–29 years, whites only |
LBW <2500 g | Stratified by class (1) | NCc | The following are ORs [99% CI]. Whites: 1.8 [1.6, 2.1] Hispanics: 1.8 [1.7, 1.9] Blacks: 2.8 [2.4, 3.1] Asians: 3.1 [2.5, 3.9] |
| Chen et al., 200743 | Retrospective cohorte US | 10–15 years (175 019) 20–24 years |
VLBW <1500 g | Class (1), SES (3), Drug/alc use (5, 6), QoC (7), Setting (9) | 2.09 [2.02, 2.16]df | 1.46 [1.40, 1.51]f |
| Chen et al., 200743 | LBW <2500 g | 1.73 [1.70, 1.75]df | 1.33 [1.31, 1.36]f | |||
| Lewis et al., 200923 | See Table 1 for study details | LBW <2500 g | ‘Multivariable model’ adjusted for Class (1), SES (4), Drug/alc use (5), Mat body comp (59, 108, 112) | 1.20 [0.84, 1.71]d | 0.94 [0.63, 1.39] | |
| de Vienne et al., 200922 | See Table 1 for study details | LBW <2500 g | Class (1), SES (2, 3), Drug/alc use (5), QoC (7), Mat body comp (13), Pg hx (24) | 1.19f | 1.07 [0.98, 1.2]f | |
| Middle income countries | ||||||
| Conde-Agudelo et al., 200521 | See Table 1 for study details | VLBW <1500 g | 1.31 [1.20, 1.43]d | 1.25 [1.12, 1.39] | ||
| Conde-Agudelo et al., 200521 | LBW <2500 g | 1.67 [1.61, 1.72]d | 1.62 [1.54, 1.71] | |||
| Hidalgo et al., 200530 | Prospective cohort (matched)e EC | ≤15 years (201) 20–30 years |
VLBW <1500 g | Matched on SES (4), Infant char (26), Pg hx (31) | NCc | 1.0 [0.48, 2.10]d |
| Hidalgo et al., 200530 | LBW <2500 g | NCc | 1.92 [1.0, 3.5] (P < 0.05) | |||
| Machado, 200631 | Retrospective cohorte BR | 10–14 years (738) 20–24 years |
LBW <2500 g | Class (1), SES (2, 34), QoC (7), Pg hx (10, 24), Infant char (11, 19), Setting (20) | 1.96, P = 0.000 | 2.01 (P = 0.000) |
| Chen et al., 201032 | Retrospective cohort TW | 10–14, 15, 16 years (15 251) 20–24 years |
VLBW <1500 g | SES (2, 3, 50), Setting (9), Pg hx (10), Infant char (11, 19), Parental age (45, 46) |
10–14 years: 3.44 [1.84, 6.83] 15 years: 3.01 [2.13, 4.25] 16 years: 2.64 [2.15, 3.23] |
10–14 years: 1.33 [0.49, 3.62] 15 years: 1.29 [0.78, 2.12] 16 years: 1.41 [1.04, 1.93] |
| Chen et al., 201032 | MLBW 1500–2499 g |
10–14 years: 2.66 [2.18, 3.25] 15 years: 2.30 [2.06, 2.57] 16 years: 1.92 [1.80, 2.05] |
10–14 years: 1.87 [1.40, 2.51] 15 years: 1.67 [1.43, 1.93] 16 years: 1.54 [1.42, 1.68] |
|||
ISO (International Organization for Standardization) code.
See Appendix 2 for confounder definitions.
Not calculable with the data provided.
Calculated manually by authors of the systematic review.
Restricted to first pregnancy in study & comparison groups (or presented data for these women separately) for this exposure & outcome.
Risk ratio.
BR, Brazil; EC, Ecuador; LBW, low birthweight; MLBW, moderately low birthweight; NC, Not calculable with data provided; SA, Saudi Arabia; TW, Taiwan; VLBW, very low birthweight.
Figure 2.
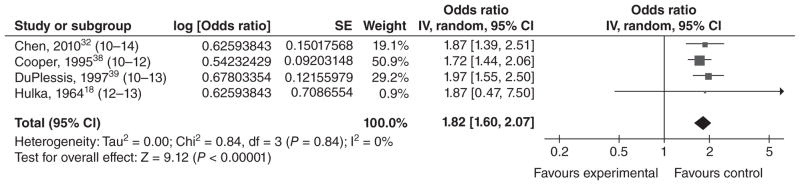
Forest plot for low birthweight among adolescents in the youngest age stratum.a,b,c
aAs described in the text, the ‘young’, ‘middle’ and ‘older’ age strata for these low birthweight studies were the youngest, middle and oldest age groupings in their respective study.
bNumbers in parentheses represent the age of the ‘exposed’ group in each study.
cIncluded studies are below, along with the ages of exposed & unexposed groups.
IV, inverse variance; CI, confidence interval.
Figure 4.
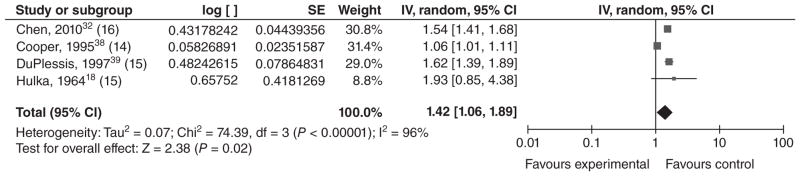
Forest plot for low birthweight among adolescents in the oldest age stratum.a,b,c
aAs described in the text, the ‘young’, ‘middle’, and ‘older’ age strata for these low birthweight studies were the youngest, middle and oldest age groupings in their respective study.
bNumbers in parentheses represent the age of the ‘exposed’ group in each study.
cIncluded studies are below, along with the ages of exposed & unexposed groups.
IV, inverse variance; CI, confidence interval.
Nine studies examined VLBW: six in high income countries18,37,38,41,43,44 and three in middle income countries21,30,32 (Table 5). We conducted a meta-analysis using effect estimates in individuals <15 years old (Figure 5). The overall OR was 1.39 [1.23, 1.58], which suggests a moderate association between young maternal age and VLBW. Although the groups were heterogeneous, most of the ORs were relatively consistent. The highest OR came from Hulka et al.’s study;18 however, there were so few occurrences of VLBW in this study that the precision of the CI (and thus the weight of the study in the meta-analysis) was very low.
Figure 5.
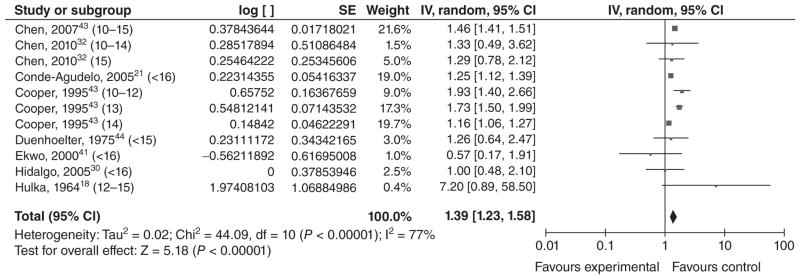
Forest plot for very low birthweight among adolescents <16 years of age.a,b
aNumbers in parentheses represent the age of the ‘exposed’ group in each study.
bIncluded studies are below, along with the ages of exposed & unexposed groups.
- cChen et al., 200743 (10–15 years vs. 20–24 years).
- Chen et al., 201032 (10–14 years vs. 20–24 years).
- Chen et al., 201032 (15 years vs. 20–24 years).
- Conde-Agudelo et al., 200521 (<16 years vs. 20–24 years).
- cCooper et al., 199538 (10–12 years vs. 15 years).
- cCooper et al., 199538 (13 years vs. 15 years).
- cCooper et al., 199538 (14 years vs. 15 years).
- Duenhoelter et al., 197544 (<15 years vs. 19–25 years).
- cEkwo and Moawad, 200041 (<16 years vs. 20–24 years).
- Hidalgo et al., 200530 (<16 years vs. 20–30 years).
- Hulka et al., 196418 (<12–15 years vs. 19–21 years).
IV, inverse variance; CI, confidence interval.
Preterm birth
Twenty-five studies of PTB (<37 weeks’ gestation) or very preterm birth (VPTB, ≤32–34 weeks’ gestation, depending on the study) or both outcomes met inclusion criteria (Table 6). Of these, 18 were from high income countries,18,22,23,29,34–36,38,39,41–43,45–50 five were from middle income countries,19,21,30–32 one was from a low income country,51 and one analysed data from countries of differing income levels.52 Four out of five studies from middle income countries found that PTB was significantly more common among infants of younger mothers,19,21,31,32 as did most of the studies from high income countries. The study from Nepal51 had wide CI, likely because of a small sample size, but the point estimates still indicate a possible adverse effect of adolescent pregnancy on PTB.
Table 6.
Age at first pregnancy and preterm birth
| Source | Study type Countrya | Ages (#) of exposed Ages of unexposed |
Outcome definition | Variables controlledb | Crude OR [95% CI] | Adjusted OR [95% CI] |
|---|---|---|---|---|---|---|
| High income countries | ||||||
| Hulka et al., 196418 | See Table 1 for study details | ≤15 years (125) 19–21 years |
VPTB <32 weeks gestation | NCc | 2.67 [0.53, 13.52]d | |
| Hulka et al., 196418 | PTB <37 weeks gestation | NCc | 2.24 [0.94, 5.35]d | |||
| Scholl et al., 198934 | See Table 5 for study details | ≤2 years after menarche (246) >2 years after menarche |
PTB <37 weeks gestation | Class (1), Drug/alc use (5), Mat body comp (13, 14) |
LMPe
estimate: 2.58 [1.89, 3.52]d OBf estimate: 2.61 [1.82, 3.73]d |
LMPe
estimate: 1.77 [1.19, 2.64] OBf estimate: 2.10 [1.36, 3.25] |
| Ketterlinus et al., 199035 | See Table 5 for study details | PTB <37 weeks gestation | NCc | 2.20 [1.21, 4.01] | ||
| Scholl et al., 199236 | Prospective cohortg US | 12–15 years [256 primigravidae (244 with data on gynaecologic age; 94 primigravidae of low gyn. age)] 18–29 years Gyn. age as categorical variable: ≤2 years since menarche >2 years since menarche |
PTB ≤37 weeks gestation | Exposure = chronological age: Class (1), Drug/alc use (5), Mat body comp (13, 14) Exposure = gynaecologic age (among primigravidae only): Class (1), Drug/alc use (5), Mat body comp (13, 14), Parental age (48, 49) |
Young vs. older primigravidae: 1.61 [0.99, 2.63]d Low gyn. age vs. older gyn. age (primigravidae only): 1.77 [1.03, 3.06]d |
Young vs. older primigravidae: 1.49 [0.94, 2.36]h When exposure = gynaecologic age [among primigravidae only]: 0.76 [0.60, 0.94]h reduction with each year of increasing gyn. age |
| Lubarsky et al., 199448 | Retrospective cohort (matched)g US | <15 years (261) 20–29 years |
PTB <37 weeks gestation | Matched on Class (1), Infant char (11), Setting (8) | NCc | 1.25 [0.83, 1.89]d |
| Scholl et al., 199452 | Meta-analysis Multiple countries: 12 studies about PTB were included (dating back to the mid-1970s); 8 were from developed countries, and 4 were from developing countries |
Developed countries: ≤18 years (or a subset) ≥19 years (or a subset) Developing countries: ≤19 years (or a subset) ≥20 years (or a subset) |
PTB <37 weeks gestation | Summary RRs adjusted for study, publication date (1983–1993 or earlier) & weighted by sample size of studies | N/A |
Developed countries summary RR: 1.46 [1.20, 1.77]i Developing countries summary RR: 2.41 [1.88, 3.10]i Teens who received comprehensive prenatal care vs. teens that did not: 0.81 [0.67, 0.96]i |
| Abalkhail, 199545 | See Table 5 for study details | PTB <37 weeks gestation | 1.78 [1.01, 3.50] | Association ‘became insignificant after adjusting for other risk factors.’ | ||
| Cooper et al., 199538 | See Table 5 for study details | VPTB <33 weeks gestation |
10–12 years: 2.04 [1.64, 2.55]d 13 years: 1.85 [1.69, 2.02]d 14 years: 1.34 [1.27, 1.41]d |
10–12 years: 1.56 [1.24, 1.97] 13 years: 1.39 [1.26, 1.54] 14 years: 1.16 [1.09, 1.23] |
||
| Cooper et al., 199538 | PTB <37 weeks gestation |
10–12 years: 1.80 [1.54, 2.10]d 13 years: 1.67 [1.57, 1.77]d 14 years: 1.28 [1.24, 1.32]d |
10–12 years: 1.50 [1.26, 1.78] 13 years: 1.36 [1.27, 1.46] 14 years: 1.16 [1.12, 1.20] |
|||
| DuPlessis et al., 199739 | See Table 5 for study details | PTB <37 weeks gestation |
10–13 years: 3.14 [2.68, 3.68]d 14 years: 2.42 [2.20, 2.65]d 15 years: 1.90 [1.72, 2.10]d |
10–13 years: 2.77 [2.32, 3.31] 14 years: 2.29 [2.04, 2.58] 15 years: 1.86 [1.65, 2.09] |
||
| Hediger et al., 199729 | See Table 3 for study details | ≤15 years, both low gyn. age and higher gyn. age (366 total; teens of low gyn. age: 133; teens of higher gyn. age: 233) 18–29 years |
Idiopathic PTL with preterm delivery = labour and delivery before 37 weeks gestation. | Class (1), Drug/alc use (5), Infant char (11), Pg hx (12), Mat body comp (14, 17) |
All teens vs. adults: 1.73 [0.93, 3.22]j Teens with low gynaecological age vs. adults: 2.19 [1.06, 4.54]j Teens with high gynaecological age vs. adults: 1.48 [0.74, 2.95]j |
All teens vs. adults: 2.08 [1.08, 4.00]j Teens with low gynaecological age vs. adults: 2.64 [1.23, 5.65]j Teens with high gynaecological age vs. adults: 1.76 [0.85, 3.63]j |
| Ekwo and Moawad, 200041 | See Table 5 for study details | PTB <37 weeks gestation | Model 1: Drug/alc use (5, 44), QoC (7), SES (34) Model 2: SES (2), Drug/alc use (5, 44), QoC (7) |
0.97 [0.69, 1.36] |
Model 1: 0.97 [0.69, 1.37] Model 2: 0.93 [0.66, 1.32] |
|
| Gilbert et al., 200442 | See Table 5 for study details | PTB <37 weeks gestation | NCc | The following are ORs [99% CI]. Whites: 1.9 [1.7, 2.1] Hispanics: 2.3 [2.1, 2.4] Blacks: 3.1 [2.8, 3.5] Asians: 3.0 [2.5, 3.6] |
||
| Olausson et al., 200146 | Retrospective cohortg SE | 13–15 years (626) 20–24 years |
VPTB <33 weeks gestation | SES (2), Setting (8) | 4.78 [3.29, 6.96]d | 4.8 [3.3, 6.9] |
| Olausson et al., 200146 | MPTB = 32–36 weeks gestation | 2.09 [1.57, 2.78]d | 2.2 [1.6, 2.9] | |||
| Branum, 200649 | Retrospective cohort US | ≤16 years (2464) 21–24 years |
VPTB <33 weeks gestation | SES (3), QoC (7), Pg hx (10), stratification by class (1) |
Non-Hispanic White: 2.21 [2.04, 2.40]d Non-Hispanic black: 1.69 [1.58, 1.80]d Hispanic: 1.83 [1.67, 2.01]d |
Non-Hispanic White: 1.84 [1.69, 2.00] Non-Hispanic black: 1.68 [1.56, 1.80] Hispanic: 1.68 [1.52, 1.85] |
| Robson et al., 200650 | Retrospective cohort AU | <16 years (739) 18–19 years |
VPTB <32 weeks gestation | Drug/alc use (5), Pg hx (10, 12), Setting (33) | 1.47 [0.96, 2.26] | 1.63 [1.06, 2.5] |
| Chen et al., 200743 | See Table 5 for study details | VPTB <32 weeks gestation | 2.88 [2.81, 2.95]di | 1.91 [1.85, 1.96]i | ||
| Chen et al., 200743 | PTB <37 weeks gestation | 1.98 [1.96, 2.00]di | 1.65 (1.62, 1.67)i | |||
| de Vienne et al., 200922 | See Table 1 for study details | PTB <37 weeks gestation | Class (1), SES (2, 3), Drug/alc use (5), QoC (7), Mat body comp (13), Pg hx (24) | 1.17 (no CI provided)i | 1.10 [1.01, 1.2]i | |
| Lewis et al., 200923 | See Table 1 for study details | PTB <37 weeks gestation | Class (1), SES (4), Drug/alc use (5), Mat body comp (59, 108, 112) | 1.03 [0.73, 1.46]d | 0.85 [0.58, 1.23] | |
| Salihu et al., 201047 | Retrospective cohort US | ≤15 years (4739) 20–24 years |
PTB <37 weeks gestation | Model 1 was adjusted for Class (1), Drug/alc use (5, 6), QoC (7), Pg hx (10) |
Non-obese: 1.5 [1.37, 1.64]d Obese: 1.46 [1.07, 2.00]d |
Non-obese: 1.42 [1.30, 1.56] Obese: 1.37 [1.00, 1.88] |
| Middle income countries | ||||||
| Conde-Agudelo et al., 200521 | See Table 1 for study details | VPTB <32 weeks gestation | 1.89 [1.77, 2.03]d | 1.51 [1.37, 1.67] | ||
| Conde-Agudelo et al., 200521 | PTB <37 weeks gestation | 1.75 [1.70, 1.81]d | 1.66 [1.59, 1.74] | |||
| Hidalgo et al., 200530 | See Table 5 for study details | PTB <37 weeks gestation | NCc | 1.0 [0.41, 2.46]d | ||
| Machado, 200631 | See Table 5 for study details | PTB <37 weeks gestation | 1.77 (P = 0.000) | 1.73 (P = 0.000) | ||
| Phupong et al., 200719 | See Table 1 for study details | PTB <37 weeks gestation | NCc | 3.59 [1.5, 8.1] | ||
| Chen et al., 201032 | See Table 5 for study details | 10–14, 15, 16 years (15 286) 20–24 years |
VPTB <32 weeks gestation |
10–14 years: 4.1 [2.57, 6.54] 15 years: 4.72 [3.78, 5.90] 16 years: 3.06 [2.63, 3.56] |
10–14 years: 2.65 [1.35, 5.2] 15 years: 2.93 [2.05, 4.2] 16 years: 2.04 [1.61, 2.6] |
|
| Chen et al., 201032 | MPTB = 32–36 weeks gestation |
10–14 years: 2.47 [2.07, 2.96] 15 years: 2.38 [2.1, 2.69] 16 years: 1.93 [1.79, 2.08] |
10–14 years: 1.51 [1.15, 1.98] 15 years: 1.51 [1.26, 1.81] 16 years: 1.43 [1.29, 1.59] |
|||
| Low income country | ||||||
| Stewart et al., 200751 | Retrospective assessment from Cluster RCT datag NP | 12–14, 15–16 years (229) 23–25 years |
PTB <37 weeks gestation | Class (1), SES (2), Drug/alc use (5), Mat body comp (13, 17), Study/biases (74) |
12–14 years: 2.80 [0.72, 10.93] 15–16 years: 2.68 [0.89, 8.13] |
12–14 years: 2.34 [0.57, 9.53] 15–16 years: 2.74 [0.94, 8.03] |
ISO (International Organization for Standardization) code.
See Appendix 2 for confounder definitions.
Not calculable with the data provided.
Calculated manually by authors of the systematic review.
Last menstrual period estimate of GA.
Obstetrician estimate of GA.
Restricted to first pregnancy in study & comparison groups (for the exposure definition that met our criteria).
Hazard ratio.
Risk ratio.
Modified last menstrual period estimate of GA.
AU, Australia; GA, gestation age; MPTB, moderately preterm birth; NC, Not calculable with the data provided; NP, Nepali; PTB, preterm birth; RR, Risk ratio; SE, Sweden; VPTB, very preterm birth.
Our meta-analysis (among mothers <15 or mothers ≤15 with a low gynaecological age) also indicates that there is an association between preterm birth and young maternal age and that the association may be stronger in developing countries (Figure 6). The overall OR was 1.68 [1.34, 2.11], which suggests a moderate association between young maternal age and PTB. However, this summary OR is over a heterogeneous group of women.
Figure 6.
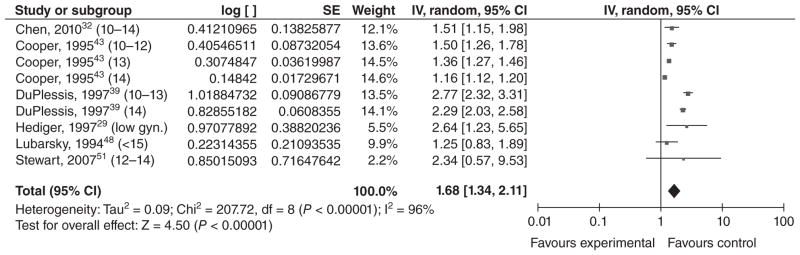
Forest plot for preterm birth among younger adolescents.a,b
aNumbers in parentheses represent the age of the ‘exposed’ group in each study. We used adolescents <15 or adolescents ≤15 with a low gynaecological age (as in Hediger et al.29).
bIncluded studies are below, along with the ages of exposed & unexposed groups.
- Chen et al., 201032 (10–14 years vs. 20–24 years).
- cCooper et al., 199538 (10–12 years vs. 15 years).
- cCooper et al., 199538 (13 years vs. 15 years).
- cCooper et al., 199538 (14 years vs. 15 years).
- DuPlessis et al., 199739 (10–13 years vs. 20–24 years).
- DuPlessis et al., 199739 (14 years vs. 20–24 years).
- cHediger et al., 199729 (teens ≤15 of gynaecological age <2 years vs. 18–29 years).
- Lubarsky et al., 199448 (<15 years vs. 20–29 years).
- cStewart et al., 200751 (12–14 years vs. 23–25 years).
IV, inverse variance; CI, confidence interval.
Eight studies examined the relationship between VPTB and low maternal age; six were from high income countries,18,38,43,46,49,50 and two were from middle income countries21,32 (Table 6). All found a significant association between VPTB and young maternal age, with ORs that ranged from 1.16 to 4.8. We conducted a meta-analysis using effect estimates in teenagers <16 years of age, although the comparison groups were heterogeneous. The overall effect estimate was 1.87 [1.51, 2.31] (Figure 7).
Figure 7.
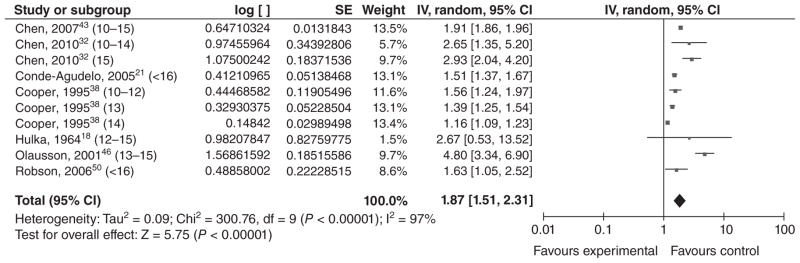
Forest plot for very preterm birth among adolescents <16 years of age.a,b
aNumbers in parentheses represent the age of the ‘exposed’ group in each study.
bIncluded studies are below, along with the ages of exposed & unexposed groups.
- cChen et al., 200743 (10–15 years vs. 20–24 years).
- Chen et al., 201032 (10–14 years vs. 20–24 years).
- Chen et al., 201032 (15 years vs. 20–24 years).
- Conde-Agudelo et al., 200521 (<16 years vs. 20–24 years).
- cCooper et al., 199538 (10–12 years vs. 15 years).
- cCooper et al., 199538 (13 years vs. 15 years).
- cCooper et al., 199538 (14 years vs. 15 years).
- Hulka et al., 196418 (<12–15 years vs. 19–21 years).
- cOlausson et al., 200146 (13–15 years vs. 20–24 years).
- Robson et al., 200650 (<16 years vs. 18–19 years).
IV, inverse variance; CI, confidence interval.
Neonatal mortality
Six studies met our inclusion criteria, including an earlier meta-analysis53 of 13 studies published before 1990. Many studies were excluded because they did not define the outcome. Of the five observational studies that fit our inclusion criteria, three were from high income countries,38,43,54 and one each was from middle income21 and low income55 countries (Table 7). None of the ORs for young maternal age were significant for neonatal mortality after adjustment for gestational age or birthweight. Similarly, in our meta-analysis of the four studies that controlled for a measure of birthweight or gestational age in at least one of their models, the overall OR was not significant (OR = 1.09 [0.98, 1.22]) (Figure 8). There was some heterogeneity between the effect estimates, and the authors controlled for different measures of birth-weight, gestational age, or both. The study by Conde-Agudelo et al.21 examined early neonatal death, and other possible differences between studies included additional variables controlled and quality of neonatal care.
Table 7.
Age at first pregnancy and neonatal mortality
| Source | Study type Countrya | Ages (#) of exposed Ages of unexposed |
Outcome definition | Variables controlledb | Crude OR [95% CI] | Adjusted OR [95% CI] |
|---|---|---|---|---|---|---|
| High income countries | ||||||
| Pillai et al., 199753 | Meta-analysis of 13 studies US | Age was reported as a continuous variable (15–24 years) # Exposed not provided |
Risk of infant death during the 28 days after birth. Outcome in this study was log (neonatal mortality) | Class (1) | N/A | Log (neonatal mortality rate) regressed on maternal age and maternal race. Coefficient for maternal age was −0.024 (P >0.05) |
| Cooper et al., 199538 | See Table 5 for study details | Infant deaths occurring within the first 27 days of life |
10–12 years: 2.69 [1.83, 3.96]c 13 years: 1.98 [1.66, 2.37]c 14 years: 1.27 [1.14, 1.43]c |
10–12 years: 1.85 [1.16, 2.94] 13 years: 1.87 [1.54, 2.28] 14 years: 1.17 [1.03, 1.33] |
||
| Olausson et al., 199954 | Prospective cohortd SE | 13–15 years (831) 20–24 years |
Death within the first 27 completed days of life |
Model 1: SES (2), Setting (8) Model 2: 2, 8, VPTB Model 3: 2, 8, MPTB Model 4: 2, 8, GA |
3.2 [1.8, 5.7] |
Model 1: 2.7 [1.5, 4.8] Model 2: 1.1 [0.6, 2.1] Model 3: 1.0 [0.5, 1.9] Model 4: 1.0 [0.5, 2.0] |
| Chen et al., 200743 | See Table 5 for study details | Death of a livebirth within 28 days |
Model 1: Class (1), SES (3), Drug/alc use (6), QoC (7), Setting (9) Model 2: Model 1 + GA and BW (every 500 g) |
2.12 [2.0, 2.25]ce |
Model 1: 10–15 years: 1.55 [1.45, 1.65]e Model 2: 10–15 years: 1.07 [0.93, 1.22]e |
|
| Middle income country | ||||||
| Conde-Agudelo et al., 200521 | See Table 1 for study details | Early neonatal death (death within first 7 days of life) |
Model 1: SES (2, 3), Drug/alc use (5), QoC (7, 21), Setting (8, 9), Pg hx (10, 18, 24, 68, 95), Mat body comp (13, 14, 59) Model 2: Model 1 + Infant char (26, 27) |
1.78 [1.62, 1.95]c |
Model 1: 1.50 [1.33, 1.70] Model 2: 1.16 [0.95, 1.43] |
|
| Low income country | ||||||
| Sharma et al., 200855 | Nested cohort (from cluster-RCT) NP | 12–15 years (340) 20–24 years |
Death within first 28 days of life |
Model 1: Class (1), SES (2, 36, 38, 39, 40), Pg hx (10), Mat body comp (41), Study/biases (43) Model 2: Model 1 + 27 Model 3: Model 1 + 26 Model 4: Model 1 + 28 Model 5: Model 1 + 26, 28 |
12–15 years: 2.24 [1.40, 3.59] |
Model 1: 1.53 [0.90, 2.60] Model 2: 1.36 [0.65, 2.84] Model 3: 1.37 [0.79, 2.37] Model 4: 1.19 [0.53, 2.70] Model 5: 1.14 [0.50, 2.61] |
ISO (International Organization for Standardization) code.
See Appendix 2 for confounder definitions.
Calculated manually by authors of the systematic review.
Restricted to first pregnancy in study & comparison groups.
Risk ratio.
BW, birth weight; GA, gestational age; MPTB, moderately preterm birth; NP, Nepal; RCT, Randomized Controlled Trial; SE, Sweden; VPTB, Very preterm birth.
Figure 8.
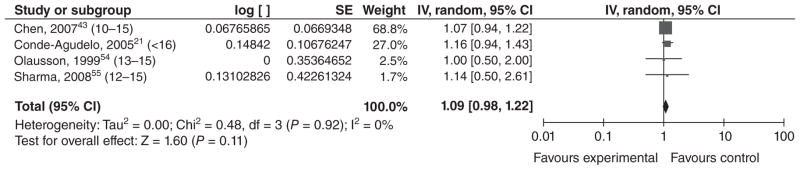
Forest plot for neonatal death among adolescents <17 years of age.a,b
aNumbers in parentheses represent the age of the ‘exposed’ group in each study.
bIncluded studies are below, along with the ages of exposed & unexposed groups.
Perinatal mortality
No studies met inclusion criteria. Several studies were excluded because they did not define the outcome.
Stillbirth
Six studies met our inclusion criteria: four from high income countries (two in the US56,57 and one each in Sweden54 and France22), one from middle income Latin American countries,21 and one from low income Nepal58 (Table 8). Olausson et al.54 found a nonsignificant relationship (aOR = 1.4 [0.6, 3.1]) between early maternal age and stillbirth, whereas de Vienne et al.22 found a significant relationship (aRR = 1.37 [95% CI 1.09, 1.70]) between the two. Salihu et al.56 found a significant association when they adjusted for basic confounders only (aOR = 1.57 [1.49, 1.66]), which remained significant after adjusting for maternal complications and congenital anomalies (aOR = 1.67 [1.58, 1.77]). However, after further adjustment for preterm birth, the odds of stillbirth were slightly but significantly lower in young compared with older mothers (aOR = 0.90 [0.85, 0.96]). Wilson et al.57 found significant adjusted hazard ratios (aHRs) for overall stillbirth, antepartum stillbirth, and intrapartum stillbirth (aHR = 2.6 [2.1, 3.3], 2.3 [1.7, 3.0], and 4.3 [4.0, 4.7], respectively). Conde-Agudelo et al.21 found no evidence of a relationship between early maternal age and stillbirth in their study of Latin American countries. Katz et al.58 also found no association between young maternal age and stillbirth in Nepal. We did not conduct a meta-analysis of stillbirth, because we believed the exposed groups were too heterogeneous to give a useful summary estimate.
Table 8.
Age at first pregnancy and stillbirth
| Source | Study type Countrya | Ages (#) of exposed Ages of unexposed |
Outcome definition | Variables controlledb | Crude OR [95% CI] | Adjusted OR [95% CI] |
|---|---|---|---|---|---|---|
| High income countries | ||||||
| Olausson et al., 199954 | See Table 7 for study details | Late foetal death = stillbirth occurring at 28 weeks gestation or later | SES (2), Setting (8) | 1.6 [0.7, 3.6] | 1.4 [0.6, 3.1] | |
| Salihu et al., 200656 | Retrospective cohort US | 10–14 years (130 620) 20–24 years |
Stillbirth (intrauterine foetal death at ≥20 weeks gestation) |
Model 1: Class (1), SES (3), Drug/alc use (5), QoC (7), Setting (8), Pg hx (10), Infant char (11) Model 2: Model 1 + Pg hx (12), Infant char (29) Model 3: Model 2 + Infant char (26) |
NCc |
Model 1: 1.57 [1.49, 1.66] Model 2: 1.67 [1.58, 1.77] Model 3: 0.90 [0.85, 0.96] |
| Wilson et al., 200857 | Retrospective cohort US | <15 years (3527) 20–24 years |
Stillbirth = in utero foetal death at ≥20 weeks gestation (Intrapartum stillbirth = SB that occurs during labour; antepartum SB = SB that occurs before labour) | Class (1), Drug/alc use (5), QoC (7), Setting (8), Infant char (11), Mat body comp (13) |
Overall SB: 1.93 [1.34, 2.79]d Antepartum SB: 1.71 [1.11, 2.63]d Intrapartum SB: 2.93 [1.45, 5.91]d |
Overall SB: 2.6 [2.1, 3.3]e Antepartum SB: 2.3 [1.7, 3.0]e Intrapartum SB: 4.3 [4.0, 4.7]e |
| de Vienne et al., 200922 | See Table 1 for study details | Foetal death = delivery of a dead infant after 22 weeks gestation | 1.43f [no CI provided] | 1.37 [1.09, 1.7]f | ||
| Middle income country | ||||||
| Conde-Agudelo et al., 200521 | See Table 1 for study details | Foetal death (delivery of a dead infant at or after 20 weeks gestation) | 1.06 [0.97, 1.15]d | 1.03 [0.92, 1.15] | ||
| Low income country | ||||||
| Katz et al., 200858 | From RCTg NP | <15 years (72) 18–19 years |
Stillbirth = deliveries occurring from 28 weeks gestation onward in which the infant did not move or cry after delivery | Class (1), SES (2), Pg hx (10), Study/biases (43) | 0.63f [no CI provided] | 0.72 [0.18, 2.94]f |
ISO (International Organization for Standardization) code.
See Appendix 2 for confounder definitions.
Not calculable with the data provided.
Calculated manually by authors of the systematic review.
Hazard ratio.
Risk ratio.
Restricted to first pregnancy in study & comparison groups for this exposure/outcome.
NC, Not calculable with data provided; NP, Nepal; RCT, Randomized controlled trial; SB, still birth.
Summary of results
Using the GRADE methodology,6,7 we estimated evidence quality for each maternal and infant outcome reviewed (Table 9). Many of the studies that met our inclusion criteria were large, population-based cohort studies, which we considered to be high quality individual studies. As maternal age is an exposure that necessarily precedes a birth, we believe that retrospective cohort studies would also qualify as high quality.
Table 9.
Quality assessment of studies on the association between early age at first pregnancy and adverse pregnancy outcomes
| Quality assessment
|
Directness
|
Summary of findings
|
||||
|---|---|---|---|---|---|---|
| Outcome and grade of evidence | ||||||
| No. of studies | Design | Consistency | Limitations | Generalisability to population of interest | Number exposeda | Effect estimateb |
| Anaemia – moderate | ||||||
| 8 | Retrospective cohort; case–control | Overall: Moderate Adjusted effects included in meta-analysis: High |
Some uncontrolled confounders; different control/exposure group definitions; different times of measurement; different outcome definitions | Low/moderate (3 in middle income countries) | 36 197 | 1.36 [1.24, 1.49] |
| Change in maternal body composition during pregnancy – low | ||||||
| 5 | Retrospective cohort; prospective cohort | Low | Some uncontrolled confounders; different outcome definitions; different comparison group definitions | Low (4 in US, 1 in Nepal) | 19 139 | N/A |
| Pre-pregnancy nutritional status – low | ||||||
| 3 | Prospective cohort; case–control | Moderate | Self-reported weight sometimes used; different outcome definitions; different comparison group definitions | Low (no low or middle income countries included) | 637 | N/A |
| Maternal morbidity and mortality – low | ||||||
| 2 | Prospective cohort; retrospective cohort | Low | Imprecision; hospital-based studies; lack of control for all relevant confounders | Low (1 study in a middle income country) | 395 | N/A |
| Low birthweight – moderate | ||||||
| 20 | Prospective cohort; retrospective cohort | Moderate (most point estimates >1 but differ greatly in magnitude) | Imprecision; some were hospital-based; lack of control for all relevant confounders; different exposure definitions | Low (only 4 studies among middle income countries) | 307 009 | Youngest teens: 1.82 [1.60, 2.07]; middle teens: 1.56 [1.31, 1.87]; older teens: 1.42 [1.06, 1.89] |
| Very low birthweight – low/moderate | ||||||
| 9 | Prospective cohort; retrospective cohort | Moderate | Imprecision; several were hospital-based; lack of control for all relevant confounders; different exposure definitions | Low/moderate (3/9 studies in middle income countries) | 263 721 | 1.39 [1.23, 1.58] among adolescents <16 years of age |
| Preterm birth – moderate | ||||||
| 23 | Prospective cohort; retrospective cohort; data from RCT; meta-analysis | Moderate (majority of studies found significant association; ORs differ in magnitude) | Possible misclassification of gestational age because of LMP or clinical estimate; imprecision; some do not provide adjusted ORs; some were hospital-based; lack of control for all relevant confounders; different exposure definitions | Low (5 in middle income countries, 1 in low income country) | 310 702 | 1.68 [1.34, 2.11] among adolescents <15 or adolescents ≤15 with a low gynaecological age |
| Very preterm birth – moderate | ||||||
| 8 | Retrospective cohort | Moderate (all point estimates >1 but differ greatly in magnitude) | Possible misclassification of gestational age because of LMP or clinical estimate; imprecision; some were hospital-based; lack of control for all relevant confounders; different exposure definitions | Low (2 studies from middle income countries) | 265 018 | 1.87 [1.51, 2.31] among adolescents <16 years of age |
| Stillbirth – low | ||||||
| 6 | Prospective cohort; Retrospective cohort; data from RCT | Low to moderate | Imprecision; some were hospital-based; lack of control for all relevant confounders; different exposure definitions | Moderate (2/6 studies in middle or low income countries) | 168 597 | N/A |
| Neonatal mortality – moderate | ||||||
| 6 | Prospective cohort; retrospective cohort; nested cohort from RCT; meta-analysis | Moderate (most point estimates >1 but differ greatly in magnitude) | Possible misclassification of gestational age because of bleeding or LMP; some were hospital-based; imprecision; lack of control for all relevant confounders; different exposure definitions | Moderate (2/6 studies in middle or low income countries) | 246 949 | 1.09 [0.98, 1.22] |
| Perinatal mortality – very low | ||||||
| 0 | ||||||
Number exposed in observational studies that were included (not including the number exposed in the meta-analyses that were included).
Random effects model.
LMP, last menstrual period; RCT, Randomized controlled trial.
We believe that negative studies are likely to be published, given the robust scientific debate about the causal nature of this association. Thus, publication bias is not likely to be an issue. However, direct applicability of evidence to low income countries is lacking for virtually all outcomes, as most reviewed studies were performed in high or middle income countries. This issue is discussed further below.
We found more and better evidence of the impact of young maternal age on infant outcomes than on maternal outcomes. In general, we upgraded overall evidence when there were sufficient studies to perform a meta-analysis, when at least some of the studies were in middle or low income countries, and/or when multivariable analyses that controlled for different confounders reached somewhat homogeneous conclusions. When results were more heterogeneous, we considered whether there could be explanations for these other than random ‘noise’. For example, some studies restricted to women in their first pregnancy, while other studies controlled for parity/gravidity by entering it as a covariate into a multivariable model. This could lead to slightly different effect estimates. Overall, we judged quality of evidence to be very low (for perinatal mortality), low (for maternal morbidity/ mortality, pre-pregnancy nutritional status, change in maternal body composition during pregnancy, and stillbirth), low to moderate (for VLBW), or moderate (for maternal anaemia, LBW, preterm and VPTB, and neonatal mortality) (see Table 9).
Comments
Biological plausibility
There is considerable justification for arguing that very young maternal age (<15 or perhaps older for less-nourished populations, where menarche occurs later) has a negative, biological impact on maternal growth as well as on infant growth and survival.10,59 Height and pelvic dimensions are almost complete by 2 years after menarche, which supports the use of low gynaecological age as an exposure. The biological mechanisms related to very young maternal age and adverse outcomes may differ depending on whether maternal or infant outcomes are examined.
The theory of feto-maternal competition for nutrients is a common explanation of why infants of adolescent mothers may be subject to adverse outcomes.60 Growing adolescents, despite gaining more weight during pregnancy, give birth to smaller infants than non-growing adolescents; they also tend to retain more weight after giving birth. Leptin surges in the third trimester may prevent fat breakdown, increase the use of glucose for maternal growth, and make less energy available for the growth of the foetus. Moreover, when the food supply is restricted, the mother’s metabolic needs usually come before foetal growth needs, unless malnourishment is severe.60 Competition for nutrients is also associated with a smaller placental mass, less placental nutrient transfer, and less uterine/umbilical cord blood transfer.59 Furthermore, production of glycine, an amino acid that is needed for fetal growth and development, may be compromised among younger mothers, especially during the third trimester.61 This may be exacerbated in regions of high food insecurity and could be associated with lower birthweights in these infants. Additionally, inadequate weight gain during pregnancy (especially during late pregnancy) is also associated with an increased risk of PTB52 and Intrauterine growth restriction,62 although a large amount of research has found that growing adolescents gain more weight during pregnancy than non-growing adolescents.60 Micronutrient deficiency is another possible biological pathway through which foetal growth could be compromised. Folic acid is needed for DNA synthesis, and depletion can contribute to cell death or dysplasia.63
This feto-maternal competition for nutrients may also impact the mother. Low caloric intake, as well as increased iron requirements for red blood cell expansion during adolescence, may contribute to make anaemia more common among teenagers.52 Adolescents may also be physiologically immature. Adolescents are more likely to have an immature pelvis, as it continues to grow throughout adolescence. This can lead to cephalopelvic disproportion, obstructed labour, or other obstetric complications.52 A short cervix (≤25 mm) and a small uterine volume, which are associated with preterm birth, may also be more common among younger mothers.64,65 Preterm delivery is also more likely when mothers are anaemic or have pregnancy-induced hypertension; if adolescents are more likely to have these complications, they may also be more likely to deliver preterm.52
Because the majority of studies that fit our inclusion criteria were either in high income or middle income countries in the western hemisphere, the evidence for the impact of early childbearing on maternal and infant health does not have direct applicability to women in low income countries and would be graded down for this factor. However, it could be argued that this is a strength rather than a limitation of the evidence, because girls in high and middle income countries typically have better nutrition when entering adolescence and may be at a lower risk of nutritional deficits associated with early childbearing. Thus, if the observed associations between early childbearing age and poor pregnancy outcomes are mediated through nutritional deficits, it is likely that these effects would be as great or greater in populations with poorer overall nutrition.
Alternative arguments
If observed risks for young adolescents are not caused by biological deficits, the reason for consistent results across observational studies may be unmeasured confounding associated with socio-economic or life style factors. Younger maternal age in developed societies is associated with being unmarried, primiparous, under-educated, an ethnic minority, socio-economically disadvantaged, and less likely to obtain early prenatal care; these factors are associated with adverse pregnancy outcomes.59 In an attempt to focus on the biological impact, we chose to review only studies that controlled for some measure of socio-economic status, but because these are observational studies, unmeasured confounding might still be present. It is possible that greater attention to the needs of young mothers could mediate any inherently higher pregnancy risk. Some experts believe that obstetric risks should not be any greater in young mothers who have adequate prenatal care than in adults.66 In developing countries that encourage early childbearing within marriage, factors such as prenatal care may be more important than maternal age.59 In a meta-analysis, Scholl et al.52 found that adolescents with comprehensive prenatal care had a risk of pregnancy-induced hypertension that was 0.59 [0.49, 0.72] times that of similar-aged mothers with traditional prenatal care. Moreover, individuals with good prenatal care are more likely to gain adequate weight during pregnancy and less likely to deliver a preterm infant; a meta-analysis showed that teenagers with comprehensive prenatal care had 0.81 [0.67, 0.96] the risk of PTB compared with adolescents with traditional care.52 Sexually transmitted diseases and urinary tract infections may also be associated with preterm birth and adverse foetal outcomes,67–69 although this is association is not always found.70 Sexually transmitted infections may be more common among teenagers, and adequate prenatal care may help eliminate these infections and protect against preterm birth.52
On the other hand, Cunnington argues that prenatal care may not be protective in and of itself. Rather, those who enter prenatal care late or not at all may be underprivileged in other ways. Alternatively, behavioural and psychosocial risks that are associated with delaying prenatal care may explain part of the increased risk among these adolescents.62 However, some researchers have found that drug and alcohol use, as well as smoking, are lower among adolescents than among adults.52 Even if substance abuse does not explain observed differences in pregnancy outcomes for young mothers, other pathways associated with stress and depression in young adults may mediate adverse outcomes such as preterm birth, either directly (e.g. through stimulated release of corticotropin-releasing hormone in the placenta) or indirectly.71 Young mothers may also be more likely to have undergone childhood abuse compared with the general population, which could lead to a permanently altered stress response or to altered behaviours that increase the likelihood of preterm delivery.71 These factors may not play an important role in many less developed societies where the family support provided to young mothers is greater than that in many developed societies.59
Conclusions
In summary, it appears that there may be a true biological effect of very young age at first pregnancy (<15 years or so) on infant health, through the increased risk of preterm birth and LBW. The evidence that young maternal age increases the risk of maternal anaemia is also fairly strong, although information on other nutritional outcomes and maternal morbidity/mortality is less clear. Many of the differences observed among older teenagers with respect to infant outcomes may be because of socio-economic or behavioural differences, which may vary by country/setting. In particular, studies in low income countries need to consider low gynaecological age, rather than simply chronological age, as an exposure. As well, country-specific studies should measure the minimum age at which childbearing for teens has similar associations with health as childbearing for adults. This ‘tipping point’ may vary by the underlying physical and nutritional health of girls and young women.
Figure 3.
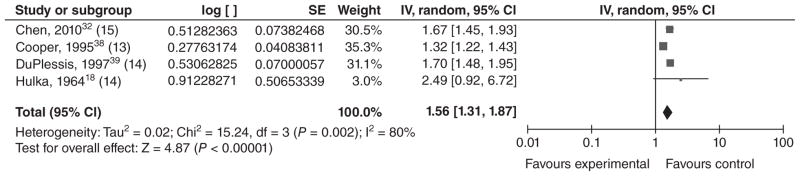
Forest plot for low birthweight among adolescents in the middle age stratum.a,b,c
aAs described in the text, the ‘young’, ‘middle’ and ‘older’ age strata for these low birthweight studies were the youngest, middle and oldest age groupings in their respective study.
bNumbers in parentheses represent the age of the ‘exposed’ group in each study.
cIncluded studies are below, along with the ages of exposed & unexposed groups.
IV, inverse variance; CI, confidence interval.
Acknowledgments
We would like to thank Vishwarupa Vasani for her assistance with article abstraction and Barbara Abu-Zeid for her assistance with crafting our database searches.
Appendix 1 – Search terms for PubMed
Search terms listed below are formatted for the PubMed search engine. All searches for each maternal or child outcome included the following terms to search for early teenage pregnancy: ‘teen pregnancy’ OR teenage pregnancy OR pregnancy in adolescence. We narrowed the results to more relevant articles by adding the second search clause (childbearing age OR age factors OR maternal age) in databases that returned large numbers of irrelevant results.
In order to restrict the search to the desired maternal nutrition and child health (MNCH) outcomes, we formatted the searches in the following way for several of the databases: (adolescent pregnancy search terms) AND (age factors search terms) AND (outcome search terms). For example, papers retrieved from the PubMed search for adolescent pregnancy and adverse infant outcomes had at least one search term from the adolescent pregnancy grouping, one search term from the age factors grouping, and one term specified from the infant outcomes search terms listed. We also manually searched the references of some studies, but because of time constraints, this was not possible for most articles.
Maternal nutritional status outcomes included the following search terms
‘Maternal Nutritional Physiological Phenomena’(MeSH) OR ‘maternal nutrition’ OR ‘maternal malnutrition’ OR ‘maternal undernutrition’ OR undernourished OR malnourished OR ‘weight gain’ OR ‘prepregnancy weight’ OR ‘nutritional status’ OR ‘iron deficiency’ OR ‘folate deficiency’ OR folate insufficiency OR ‘folic acid deficiency’ OR ‘folic acid insufficiency’ OR maternal depletion OR maternal nutritional stores OR ‘calcium deficiency’ OR ‘vitamin d deficiency’ OR ‘zinc deficiency’ OR ‘multiple micronutrient supplement’ OR ‘vitamin deficiency’ OR ‘catch-up growth’ OR ‘anemia’ OR ‘anemic’ OR ‘hemoglobin.’
Maternal morbidity or mortality outcome search terms included
Maternal mortality OR Gestational diabetes OR pregnancy-Induced hypertension OR eclampsia OR HELLP Syndrome OR pre-eclampsia OR Obstetric Labor Complications OR obstetric labor complication OR Abruptio Placentae OR Breech Presentation OR Cephalopelvic Disproportion OR Dystocia OR Premature Rupture Fetal membranes OR Premature obstetric labor OR Placenta Accreta OR Placenta Previa OR Postpartum Hemorrhage OR Uterine Inversion OR Uterine Rupture OR Vasa Previa OR Oligohydramnios OR Placental Diseases OR Placental Disease OR Abruptio Placentae OR Chorioamnionitis OR Retained Placenta OR Placental Insufficiency OR Polyhydramnios OR Cardiovascular Pregnancy Complications OR Cardiovascular Pregnancy Complication OR Amniotic Fluid Embolism OR Hematologic Pregnancy Complications OR Hematologic Pregnancy Complication OR Infectious Pregnancy Complications OR Infectious Pregnancy Complication OR septic abortion OR Parasitic Pregnancy Complications OR Puerperal Infection OR Prolonged pregnancy OR Puerperal Disorders OR Postpartum depression OR Lactation Disorders OR Mastitis OR Postpartum Hemorrhage OR Postpartum Thyroiditis OR Pubic Symphysis Diastasis.
Infant outcomes search terms included
‘Infant, Low Birth Weight’(MeSH) OR ‘Infant, Very Low Birth Weight’(MeSH) OR ‘Infant, Extremely Low Birth Weight’(MeSH) OR low birth weight* OR ‘premature birth’(MeSH) OR preterm deliver* OR preterm birth* OR ‘small for gestational age’ OR intrauterine growth retardation OR ‘intrauterine growth restriction’ OR ‘Infant Mortality’(MeSH) OR ‘fetal death’ OR stillbirth OR ‘perinatal death’ OR fetal mortalit* OR perinatal mortalit* OR ‘neonatal death’ OR neonatal mortality OR infant mortality.
Appendix 2 – Grouped confounders
Glossary of confounders that are used in the tables
Race/ethnicity (Class)
(1 = race/ethnicity/Indigenous status/foreign born mother/caste/mother’s country of origin)
Socioeconomic status (SES)
(2 = maternal education/literacy; 3 = marital status; 4 = SES; 34 = community development/proportion non-high school graduates/census tract income; 35 = log income; 36 = maternal occupation/working status; 37 = insurance status; 38 = latrine ownership; 39 = electricity in home; 40 = cattle ownership; 50 = paternal education; 52 = paternal occupation; 53 = paternal acknowledgement on birth certificate; 54 = no housework help; 55 = mother’s living arrangements; 56 = work during pregnancy; 57 = consanguinity; 75 = religion; 76 = household space (sq. ft.); 96 = social status of the couple at the birth of the index child 97 = change of social status between the two births)
Drug or alcohol use during pregnancy (Drug/alc use)
(5 = smoking during pregnancy; 6 = alcohol use during pregnancy; 44 = cocaine use)
Infant characteristics (Infant char)
(11 = sex of infant; 19 = plurality; 26 = Gestational Age/Preterm Birth; 27 = birth weight/LBW; 28 = SGA; 29 = congenital anomalies; 30 = perinatal death; 101 = Premature rupture of the membranes)
Maternal body composition/nutritional indicators (Mat body comp)
(13 = maternal BMI/pre-pregnancy BMI; 14 = weight gain during pregnancy; 15 = triceps skinfold thickness; 16 = mid-arm circumference, 17 = maternal height; 47 = maternal pre-pregnancy weight; 41 = maternal night blindness during pregnancy; 58 = diabetes; 59 = hypertensive disease/PIH; 60 = ferrous use; 61 = maternal vitamin use; 86 = history of anaemia in previous pregnancy; 87 = Hb level at booking; 89 = current pregnancy status; 93 = meat consumption; 98 = Maternal obesity; 99 = cardiopathy; 102 = Increased blood pressure during pregnancy; 103 = Infectious diseases during pregnancy; 104 = Haemorrhage during pregnancy; 105 = preeclampsia; 106 = eclampsia; 107 = abruptio placentae; 108 = Anaemia; 109 = Gestational diabetes mellitus; 110 = Syphilis; 111 = Rh isoimmunisation; 112 = Urinary tract infection; 116 = diethylstilbestrol exposure; 117 = cervical incompetence; 118 = uterine anomaly; 120 = Maternal haematocrit)
Quality of medical care (QoC)
(7 = prenatal care; 21 = level/type of hospital; 22 = private hospital; 23 = nonhospital birth; 71 = use of IPT for malaria during pregnancy; 72 = use of bednets; 73 = P. falciparum infection at delivery; 82 = gestational age at first ANC visit; 83 = Number of prenatal care visits; 90 = onset of prenatal care; 92 = length of time between ANC visits; 94 = clinic payment status; 100 = Less than 5 prenatal visits/entering after 3 months)
Pregnancy history/complications (Pg hx)
(10 = parity/gravidity/birth order; 12 = medical complications of pregnancy or delivery; 18 = IPI/recent live-birth; 24 = history of previous miscarriage or abortion; 25 = had child who died; 31 = cervical dilation; 62 = number of previous liveborn children who were still alive; 63 = number of previous liveborn children who had died; 64 = preceding infant’s birth weight; 65 = previous medical history; 66 = previous obstetric history; 67 = previous preterm birth; 68 = history of low birthweight; 69 = outcome of previous pregnancy; 77 = number of previous deliveries; 78 = previous Caesarean delivery; 85 = previous pregnancy losses; 79 = number of weeks post-partum; 95 = history of perinatal death; 113 = vaginal bleeding; 115 = planned pregnancy; 119 = Previous induced abortion; 121 = stillbirth and early neonatal death)
Parental age (Parental age)
(45 = paternal age; 46 = age difference of parents; 48 = chronologic age; 49 = age;2 70 = maternal age <18 years; 84 = age at first index pregnancy; 88 = gestational age at delivery; 91 = age of menarche)
Details/setting of delivery (Setting)
(8 = year of delivery; 9 = geographic area (state/county/country of birth); 20 = delivery mode; 33 = city size/rural residence)
Type of study/biases (Study/biases)
(32 = memory bias; 43 = type of study/treatment (in cohorts from cluster RCTs)
Footnotes
Conflicts of interest
The authors declare no conflicts of interest in connection with this work.
References
- 1.World Health Organization. [last accessed October 2011];Making Pregnancy Safer: Adolescent Pregnancy. 2011 Updated 2011. http://www.who.int/maternal_child_adolescent/topics/maternal/adolescent_pregnancy/en/index.html.
- 2.The Population Council. Child marriage briefing: ethiopia. 2004. [Google Scholar]
- 3.Ban K. United Nations. The Millennium Development Goals Report 2010. New York: United Nations; 2010. Contract No.: Document Number. [Google Scholar]
- 4.Omran A. The Health Theme in Family Planning. Chapel Hill, NC: Carolina Population Center; 1971. [Google Scholar]
- 5.Taffa N, Obare F. Pregnancy and child health outcomes among adolescents in Ethiopia. Ethiopian Journal of Health and Development. 2004;18:90–95. [Google Scholar]
- 6.Guyatt GH, Oxman AD, Sultan S, Glasziou P, Akl EA, Alonso-Coello P, et al. GRADE guidelines: 9. Rating up the quality of evidence. Journal of Clinical Epidemiology. 2011;64:1311–1316. doi: 10.1016/j.jclinepi.2011.06.004. [DOI] [PubMed] [Google Scholar]
- 7.Balshem H, Helfand M, Schunemann HJ, Oxman AD, Kunz R, Brozek J, et al. GRADE guidelines: 3. Rating the quality of evidence. Journal of Clinical Epidemiology. 2011;64:401–406. doi: 10.1016/j.jclinepi.2010.07.015. [DOI] [PubMed] [Google Scholar]
- 8.Winfrey W, McKinnon R, Starer J. Methods used in the Lives Saved Tool (LiST) BMC Public Health. 2011;11:S32–S42. doi: 10.1186/1471-2458-11-S3-S32. [DOI] [PMC free article] [PubMed] [Google Scholar]
- 9.Tsui AO, McDonald-Mosley R, Burke AE. Family planning and the burden of unintended pregnancies. Epidemiologic Reviews. 2010;32:152–174. doi: 10.1093/epirev/mxq012. [DOI] [PMC free article] [PubMed] [Google Scholar]
- 10.Phipps MG, Sowers M. Defining early adolescent childbearing. American Journal of Public Health. 2002;92:125–128. doi: 10.2105/ajph.92.1.125. [DOI] [PMC free article] [PubMed] [Google Scholar]
- 11.Conde-Agudelo A, Rosas-Bermudez A, Kafury-Goeta AC. Birth spacing and risk of adverse perinatal outcomes: a meta-analysis. JAMA. 2006;295:1809–1823. doi: 10.1001/jama.295.15.1809. [DOI] [PubMed] [Google Scholar]
- 12.UNICEF, WHO. [last accessed 25 October 2011];Iron Deficiency Anemia Assessment, Prevention, and Control: A Guide for Programme Managers. 2001 http://www.who.int/nutrition/Publications/en/rda_assessment_prevention_control.pdf.
- 13.Nestel P ISC. [last accessed 25 October 2011];Adjusting Hemoglobin Values in Program Surveys. 2002 http://inacg.ilsi.org/file/Hemoglobin.pdf.
- 14.Walker N, Fischer-Walker C, Bryce J, Bahl R, Cousens S. Standards for CHERG reviews of intervention effects on child survival. International Journal of Epidemiology. 2010;39(Suppl 1):i21–i31. doi: 10.1093/ije/dyq036. [DOI] [PMC free article] [PubMed] [Google Scholar]
- 15.Atkins D, Best D, Briss PA, Eccles M, Falck-Ytter Y, Flottorp S, et al. Grading quality of evidence and strength of recommendations. BMJ (Clinical Research Ed) 2004;328:1490. doi: 10.1136/bmj.328.7454.1490. [DOI] [PMC free article] [PubMed] [Google Scholar]
- 16.Konje JC, Palmer A, Watson A, Hay DM, Imrie A, Ewings P. Early teenage pregnancies in Hull. BJOG. 1992;99:969–973. doi: 10.1111/j.1471-0528.1992.tb13699.x. [DOI] [PubMed] [Google Scholar]
- 17.Scholl TO, Decker E, Karp RJ, Greene G, De Sales M. Early adolescent pregnancy: a comparative study of pregnancy outcome in young adolescents and mature women. Journal of Adolescent Health Care. 1984;5:167–171. doi: 10.1016/s0197-0070(84)80037-6. [DOI] [PubMed] [Google Scholar]
- 18.Hulka JF, Schaaf JT. Obstetrics in adolescents: a controlled study of deliveries by mothers 15 years of age and under. Obstetrics & Gynecology. 1964;23:678–685. [PubMed] [Google Scholar]
- 19.Phupong V, Suebnukarn K. Obstetric outcomes in nulliparous young adolescents. The Southeast Asian Journal of Tropical Medicine and Public Health. 2007;38:141–145. [PubMed] [Google Scholar]
- 20.Ncayiyana DJ, ter Haar G. Pregnant adolescents in rural Transkei. Age per se does not confer high-risk status. South African Medical Journal. 1989;75:231–232. [PubMed] [Google Scholar]
- 21.Conde-Agudelo A, Belizan JM, Lammers C. Maternal-perinatal morbidity and mortality associated with adolescent pregnancy in Latin America: cross-sectional study. American Journal of Obstetrics & Gynecology. 2005;192:342–349. doi: 10.1016/j.ajog.2004.10.593. [DOI] [PubMed] [Google Scholar]
- 22.de Vienne CM, Creveuil C, Dreyfus M. Does young maternal age increase the risk of adverse obstetric, fetal and neonatal outcomes: a cohort study. European Journal of Obstetrics & Gynecology and Reproductive Biology. 2009;147:151–156. doi: 10.1016/j.ejogrb.2009.08.006. [DOI] [PubMed] [Google Scholar]
- 23.Lewis LN, Hickey M, Doherty DA, Skinner SR. How do pregnancy outcomes differ in teenage mothers? A Western Australian study. The Medical Journal of Australia. 2009;190:537–541. doi: 10.5694/j.1326-5377.2009.tb02553.x. [DOI] [PubMed] [Google Scholar]
- 24.Haiek L, Lederman SA. The relationship between maternal weight for height and term birth weight in teens and adult women. Journal of Adolescent Health Care. 1989;10:16–22. doi: 10.1016/0197-0070(89)90041-7. [DOI] [PubMed] [Google Scholar]
- 25.Perry RL, Mannino B, Hediger ML, Scholl TO. Pregnancy in early adolescence: are there obstetric risks? Journal of Maternal-Fetal Medicine. 1996;5:333–339. doi: 10.1002/(SICI)1520-6661(199611/12)5:6<333::AID-MFM8>3.0.CO;2-Q. [DOI] [PubMed] [Google Scholar]
- 26.Katz J, Khatry SK, LeClerq SC, West KP, Christian P. The post-partum mid-upper arm circumference of adolescents is reduced by pregnancy in rural Nepal. Maternal & Child Nutrition. 2010;6:287–295. doi: 10.1111/j.1740-8709.2009.00211.x. [DOI] [PMC free article] [PubMed] [Google Scholar]
- 27.Loris P, Dewey KG, Poirier-Brode K. Weight gain and dietary intake of pregnant teenagers. Journal of the American Dietetic Association. 1985;85:1296–1305. [PubMed] [Google Scholar]
- 28.Howie LD, Parker JD, Schoendorf KC. Excessive maternal weight gain patterns in adolescents. Journal of the American Dietetic Association. 2003;103:1653–1657. doi: 10.1016/j.jada.2003.09.040. [DOI] [PubMed] [Google Scholar]
- 29.Hediger ML, Scholl TO, Schall JI, Krueger PM. Young maternal age and preterm labor. Annals of Epidemiology. 1997;7:400–406. doi: 10.1016/s1047-2797(97)00046-x. [DOI] [PubMed] [Google Scholar]
- 30.Hidalgo LA, Chedraui PA, Chavez MJ. Obstetrical and neonatal outcome in young adolescents of low socio-economic status: a case control study. Archives of Gynecology and Obstetrics. 2005;271:207–211. doi: 10.1007/s00404-004-0600-7. [DOI] [PubMed] [Google Scholar]
- 31.Machado CJ. Impact of maternal age on birth outcomes: a population-based study of primiparous Brazilian women in the city of Sao Paulo. Journal of Biosocial Science. 2006;38:523–535. doi: 10.1017/S0021932005026660. [DOI] [PubMed] [Google Scholar]
- 32.Chen C, Tsai C, Sung F, Lee Y, Lu T, Li C, et al. Adverse birth outcomes among pregnancies of teen mothers: age-specific analysis of national data in Taiwan. Child: Care, Health & Development. 2010;36:232–240. doi: 10.1111/j.1365-2214.2009.01039.x. [DOI] [PubMed] [Google Scholar]
- 33.Spellacy WN, Mahan CS, Cruz AC. The adolescent’s first pregnancy: a controlled study. Southern Medical Journal. 1978;71:768–771. doi: 10.1097/00007611-197807000-00009. [DOI] [PubMed] [Google Scholar]
- 34.Scholl TO, Hediger ML, Salmon RW, Belsky DH, Ances IG. Association between low gynaecological age and preterm birth. Paediatric and Perinatal Epidemiology. 1989;3:357–366. doi: 10.1111/j.1365-3016.1989.tb00524.x. [DOI] [PubMed] [Google Scholar]
- 35.Ketterlinus RD, Henderson SH, Lamb ME. Maternal age, sociodemographics, prenatal health and behavior: influences on neonatal risk status. Journal of Adolescent Health Care. 1990;11:423–431. doi: 10.1016/0197-0070(90)90090-o. [DOI] [PubMed] [Google Scholar]
- 36.Scholl TO, Hediger ML, Huang J, Johnson FE, Smith W, Ances IG. Young maternal age and parity. Influences on pregnancy outcome. Annals of Epidemiology. 1992;2:565–575. doi: 10.1016/1047-2797(92)90001-7. [DOI] [PubMed] [Google Scholar]
- 37.Satin AJ, Leveno KJ, Sherman ML, Reedy NJ, Lowe TW, McIntire DD. Maternal youth and pregnancy outcomes: middle school versus high school age groups compared with women beyond the teen years. American Journal of Obstetrics & Gynecology. 1994;171:184–187. doi: 10.1016/0002-9378(94)90467-7. [DOI] [PubMed] [Google Scholar]
- 38.Cooper LG, Leland NL, Alexander G. Effect of maternal age on birth outcomes among young adolescents. Social Biology. 1995;42:22–35. doi: 10.1080/19485565.1995.9988885. [DOI] [PubMed] [Google Scholar]
- 39.DuPlessis HM, Bell R, Richards T. Adolescent pregnancy: understanding the impact of age and race on outcomes. Journal of Adolescent Health. 1997;20:187–197. doi: 10.1016/S1054-139X(96)00174-7. [DOI] [PubMed] [Google Scholar]
- 40.Reichman NE, Pagnini DL. Maternal age and birth outcomes: data from New Jersey. Family Planning Perspectives. 1997;29:268–272. 295. [PubMed] [Google Scholar]
- 41.Ekwo EE, Moawad A. Maternal age and preterm births in a black population. Paediatric and Perinatal Epidemiology. 2000;14:145–151. doi: 10.1046/j.1365-3016.2000.00234.x. [DOI] [PubMed] [Google Scholar]
- 42.Gilbert W, Jandial D, Field N, Bigelow P, Danielsen B. Birth outcomes in teenage pregnancies. Journal of Maternal-Fetal and Neonatal Medicine. 2004;16:265–270. doi: 10.1080/14767050400018064. [DOI] [PubMed] [Google Scholar]
- 43.Chen XK, Wen SW, Fleming N, Demissie K, Rhoads GG, Walker M. Teenage pregnancy and adverse birth outcomes: a large population based retrospective cohort study. International Journal of Epidemiology. 2007;36:368–373. doi: 10.1093/ije/dyl284. [DOI] [PubMed] [Google Scholar]
- 44.Duenhoelter JH, Jimenez JM, Baumann G. Pregnancy performance of patients under fifteen years of age. Obstetrics and Gynecology. 1975;46:49–52. doi: 10.1097/00006250-197507000-00009. [DOI] [PubMed] [Google Scholar]
- 45.Abalkhail BA. Adolescent pregnancy: are there biological barriers for pregnancy outcomes? Journal of the Egyptian Public Health Association. 1995;70:609–625. [PubMed] [Google Scholar]
- 46.Olausson PO, Cnattingius S, Haglund B. Does the increased risk of preterm delivery in teenagers persist in pregnancies after the teenage period? BJOG. 2001;108:721–725. doi: 10.1111/j.1471-0528.2001.00182.x. [DOI] [PubMed] [Google Scholar]
- 47.Salihu HM, Luke S, Alio AP, Deutsch A, Marty PJ. The impact of obesity on spontaneous and medically indicated preterm birth among adolescent mothers. Archives of Gynecology and Obstetrics. 2010;282:127–134. doi: 10.1007/s00404-009-1213-y. [DOI] [PubMed] [Google Scholar]
- 48.Lubarsky SL, Schiff E, Friedman SA, Mercer BM, Sibai BM. Obstetric characteristics among nulliparas under age 15. Obstetrics & Gynecology. 1994;84:365–368. [PubMed] [Google Scholar]
- 49.Branum AM. Teen maternal age and very preterm birth of twins. Maternal and Child Health Journal. 2006;10:229–233. doi: 10.1007/s10995-005-0035-1. [DOI] [PubMed] [Google Scholar]
- 50.Robson S, Cameron CA, Roberts CL. Birth outcomes for teenage women in New South Wales, 1998–2003. The Australian and New Zealand Journal of Obstetrics and Gynaecology. 2006;46:305–310. doi: 10.1111/j.1479-828X.2006.00597.x. [DOI] [PubMed] [Google Scholar]
- 51.Stewart CP, Katz J, Khatry SK, LeClerq SC, Shrestha SR, West KP, Jr, et al. Preterm delivery but not intrauterine growth retardation is associated with young maternal age among primiparae in rural Nepal. Maternal & Child Nutrition. 2007;3:174–185. doi: 10.1111/j.1740-8709.2007.00097.x. [DOI] [PMC free article] [PubMed] [Google Scholar]
- 52.Scholl TO, Hediger ML, Belsky DH. Prenatal care and maternal health during adolescent pregnancy: a review and meta-analysis. Journal of Adolescent Health. 1994;15:444–456. doi: 10.1016/1054-139x(94)90491-k. [DOI] [PubMed] [Google Scholar]
- 53.Pillai VK, Bandyopadhyay S. Age effects on infant mortality controlling for race: a meta-analytical study. Health Care for Women International. 1997;18:115–126. doi: 10.1080/07399339709516267. [DOI] [PubMed] [Google Scholar]
- 54.Olausson PO, Cnattingius S, Haglund B. Teenage pregnancies and risk of late fetal death and infant mortality. BJOG. 1999;106:116–121. doi: 10.1111/j.1471-0528.1999.tb08210.x. [DOI] [PubMed] [Google Scholar]
- 55.Sharma V, Katz J, Mullany LC, Khatry SK, LeClerq SC, Shrestha SR, et al. Young maternal age and the risk of neonatal mortality in rural Nepal. Archives of Pediatric & Adolescent Medicine. 2008;162:828–835. doi: 10.1001/archpedi.162.9.828. [DOI] [PMC free article] [PubMed] [Google Scholar]
- 56.Salihu HM, Sharma PP, Ekundayo OJ, Kristensen S, Badewa AP, Kirby RS, et al. Childhood pregnancy (10–14 years old) and risk of stillbirth in singletons and twins. Journal of Pediatrics. 2006;148:522–526. doi: 10.1016/j.jpeds.2005.11.018. [DOI] [PubMed] [Google Scholar]
- 57.Wilson RE, Alio AP, Kirby RS, Salihu HM. Young maternal age and risk of intrapartum stillbirth. Archives of Gynecology and Obstetrics. 2008;278:231–236. doi: 10.1007/s00404-007-0557-4. [DOI] [PubMed] [Google Scholar]
- 58.Katz J, Khatry SK, LeClerq SC, Shrestha SR, West KP., Jr Miscarriage but not stillbirth rates are higher among younger nulliparas in rural Southern Nepal. Journal of Adolescent Health. 2008;42:587–595. doi: 10.1016/j.jadohealth.2007.11.137. [DOI] [PMC free article] [PubMed] [Google Scholar]
- 59.Kramer KL, Lancaster JB. Teen motherhood in cross-cultural perspective. Annals of Human Biology. 2010;37:613–628. doi: 10.3109/03014460903563434. [DOI] [PubMed] [Google Scholar]
- 60.King JC. The risk of maternal nutritional depletion and poor outcomes increases in early or closely spaced pregnancies. Journal of Nutrition. 2003;133:1732S–1736S. doi: 10.1093/jn/133.5.1732S. [DOI] [PubMed] [Google Scholar]
- 61.Thame M, Fletcher H, Baker T, Jahoor F. Comparing the in vivo glycine fluxes of adolescent girls and adult women during early and late pregnancy. British Journal of Nutrition. 2010;104:498–502. doi: 10.1017/S0007114510000784. [DOI] [PubMed] [Google Scholar]
- 62.Cunnington AJ. What’s so bad about teenage pregnancy? Journal of Family Planning and Reproductive Health Care. 2001;27:36–41. doi: 10.1783/147118901101194877. [DOI] [PubMed] [Google Scholar]
- 63.Baker PN, Wheeler SJ, Sanders TA, Thomas JE, Hutchinson CJ, Clarke K, et al. A prospective study of micronutrient status in adolescent pregnancy. American Journal of Clinical Nutrition. 2009;89:1114–1124. doi: 10.3945/ajcn.2008.27097. [DOI] [PubMed] [Google Scholar]
- 64.Da Costa AG, Mauad F, Ferreira AC, Spara P, Mauad FM. Uterine volume in adolescents. Ultrasound in Medicine and Biology. 2004;30:7–10. doi: 10.1016/j.ultrasmedbio.2003.09.009. [DOI] [PubMed] [Google Scholar]
- 65.Stevens-Simon C, Barrett J, McGregor JA, French J, Persutte W. Short cervix: a cause of preterm delivery in young adolescents? The Journal of Maternal-Fetal Medicine. 2000;9:342–347. doi: 10.1002/1520-6661(200011/12)9:6<342::AID-MFM1004>3.0.CO;2-D. [DOI] [PubMed] [Google Scholar]
- 66.McAnarney ER, Hendee WR. Adolescent pregnancy and its consequences. JAMA. 1989;262:74–77. [PubMed] [Google Scholar]
- 67.Fichorova RN. Impact of T. vaginalis infection on innate immune responses and reproductive outcome. Journal of Reproductive Immunology. 2009;83:185–189. doi: 10.1016/j.jri.2009.08.007. [DOI] [PMC free article] [PubMed] [Google Scholar]
- 68.Lata I, Pradeep Y, Sujata, Jain A. Estimation of the incidence of bacterial vaginosis and other vaginal infections and its consequences on maternal/fetal outcome in pregnant women attending an antenatal clinic in a tertiary care hospital in North India. Indian Journal of Community Medicine. 2010;35:285–289. doi: 10.4103/0970-0218.66855. [DOI] [PMC free article] [PubMed] [Google Scholar]
- 69.Mann JR, McDermott S, Gill T. Sexually transmitted infection is associated with increased risk of preterm birth in South Carolina women insured by Medicaid. Journal of Maternal-Fetal and Neonatal Medicine. 2010;23:563–568. doi: 10.3109/14767050903214574. [DOI] [PubMed] [Google Scholar]
- 70.Chen YK, Chen SF, Li HC, Lin HC. No increased risk of adverse pregnancy outcomes in women with urinary tract infections: a nationwide population-based study. Acta Obstetricia Et Gynecologica Scandinavica. 2010;89:882–888. doi: 10.3109/00016349.2010.486826. [DOI] [PubMed] [Google Scholar]
- 71.Stevens-Simon C, Beach RK, McGregor JA. Does incomplete growth and development predispose teenagers to preterm delivery? A template for research. Journal of Perinatology. 2002;22:315–323. doi: 10.1038/sj.jp.7210694. [DOI] [PubMed] [Google Scholar]