Abstract
Nucleic acid aptamers find widespread use as targeting and sensing agents in nature and biotechnology. Their ability to bind an extensive range of molecular targets, including small molecules, proteins, and ions, with high affinity and specificity enables their use in diverse diagnostic, therapeutic, imaging, and gene-regulatory applications. Here, we describe methods for characterizing aptamer kinetic and equilibrium binding properties using a surface plasmon resonance-based platform. This aptamer characterization platform is broadly useful for studying aptamer–ligand interactions, comparing aptamer properties, screening functional aptamers during in vitro selection processes, and prototyping aptamers for integration into nucleic acid devices.
1. INTRODUCTION
Characterization of aptamer binding properties is critical for studying aptamer molecular recognition and integrating the sensing capabilities encoded within aptamers into diverse applications. Understanding key binding properties of aptamers, including affinity, kinetics, specificity, ion dependence, and buffer sensitivity, supports aptamer design and use. Here, we describe a surface plasmon resonance-based aptamer characterization platform for measurement of aptamer binding properties. Importantly, this characterization strategy is (a) label-free, avoiding alteration of the aptamer–ligand binding interaction or limiting its use to ligands with specific intrinsic properties or functional groups suitable for labeling; (b) scalable, allowing testing of a wide range of binding conditions and aptamer–ligand pairs; (c) sensitive, enabling binding measurement of low molecular weight, small molecule ligands; (d) capable of measuring both binding kinetics and equilibrium affinities; and (e) able to monitor and adjust for the presence of nonspecific interactions (1).
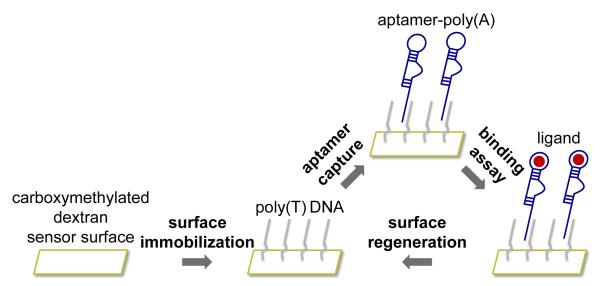
Surface plasmon resonance (SPR) is an optical detection method that has gained widespread use for characterizing biomolecular interactions. One interacting partner is immobilized onto the sensor surface, and its binding interactions to other molecules in solution is measured (Figure 1). Changes in mass concentration near the sensor surface result in a change in refractive index and are recorded in real time as sensorgrams in resonance units (RU). In our SPR setup, we covalently immobilize a 24-mer poly(T) single-stranded DNA linker directly to a high-capacity, carboxymethylated dextran sensor chip. Hybridization-based capture of an aptamer with a corresponding poly(A) tail onto the sensor surface allows monitoring of its interaction with ligands of interest flowed over the sensor surface. Surface regeneration enables testing of different aptamer–ligand pairs and binding conditions using the same sensor chip, without exposing either binding partner to repeated regeneration cycles. The sensor surface includes two flow cells: a reference flow cell (FC1) and a sample flow cell (FC2). Both flow cells contain the immobilized DNA linker, but the reference flow cell lacks the aptamer and is used to monitor the presence of nonspecific interactions between the sensor surface and ligand.
Figure 1.
Surface plasmon resonance platform for aptamer binding characterization. A poly(T) DNA linker is covalently immobilized onto the sensor surface, enabling capture of aptamers with a corresponding poly(A) tail and real-time monitoring of ligand binding. Regeneration of the sensor surface removes aptamer and ligand and allows reuse of the surface for other aptamers, ligands, or conditions. Adapted, with permission, from reference (1).
2. MATERIALS
2.1 Instrumentation
Biacore X100 instrument (GE Healthcare, Uppsala, Sweden) or similar surface plasmon resonance instrument. If using other systems, check for system compatibility of reagents and materials listed.
Biacore X100 Evaluation Software version 2.0 (GE Healthcare) or similar data processing software.
2.2 Sensor surface immobilization
CM5 sensor chip (GE Healthcare): CM5 chips contain a carboxymethylated dextran matrix on a gold surface and provide high binding capacity and surface stability, increasing the observable signal, particularly from small molecule binding, and allowing many cycles to be run on a single chip.
DNA linker strand (5′-AmMC6-TTTTTTTTTTTTTTTTTTTTTTTT), with an amino-modified 6-carbon linker on the 5′ end (Integrated DNA Technologies, Coralville, IA): The DNA linker is covalently immobilized to the sensor surface through an amide bond-forming reaction at its 5′ end.
10x HBS-N (100 mM HEPES, 1.5 M NaCl, pH 7.4) (GE Healthcare): Dilute with RNase-free water to 1x concentration and supplement with MgCl2 as appropriate for binding buffers.
1-ethyl-3-(3-dimethylaminopropyl) carbodiimide (EDC) (GE Healthcare): Activates sensor surface in coupling reaction with DNA linker, in conjunction with N-hydroxysuccinimide.
N-hydroxysuccinimide (NHS) (GE Healthcare): Activates sensor surface in coupling reaction with DNA linker, in conjunction with EDC.
Hexadecyltrimethylammonium bromide (CTAB) (Sigma-Aldrich, St. Louis, MO): Surfactant that forms positively charged micelles in buffer and carries the negatively charged DNA linker to the negatively charged sensor surface during pre-concentration assays and immobilization reactions.
1 M HEPES buffer (Sigma-Aldrich): Dilute to a concentration of 10 mM HEPES in RNase-free water and use to dissolve solutions of CTAB and DNA linker.
1 M ethanolamine, pH 8.5 (GE Healthcare): Blocks excess EDC/NHS-activated carboxylate groups on sensor surface after immobilization reaction.
50 mM NaOH (GE Healthcare): Dilute in RNase-free water as appropriate for regeneration solutions.
NaCl (Sigma-Aldrich): Dissolve and dilute as appropriate for regeneration solutions.
RNase-free water: Purchase (Life Technologies, Carlsbad, CA) or prepare using diethyl pyrocarbonate (DEPC) (Sigma-Aldrich). DEPC inactivates RNase enzymes in water. Treat water with 0.1% vol/vol DEPC for at least 2 hours at 37 °C and autoclave to inactivate excess DEPC.
0.2 μm pore size membrane filter (Pall Corporation, Port Washington, NY, or Nalgene, Thermo Scientific, Waltham, MA): Use to filter all buffers and ligand solutions before use.
2.3 Aptamer binding assay
DNA template oligonucleotides: Design and synthesize as described in Section 4.1.
Biacore-fwd primer (5′-TTCTAATACGACTCACTATAGGG), where the T7 promoter sequence is underlined: For PCR amplification or run-off transcription of aptamer DNA templates.
Biacore-rev primer (5′-TTTTTTTTTTTTTTTTTTTTTTTTGGGG): For PCR amplification of RNA aptamer DNA templates.
PCR purification spin columns: Can also use ethanol precipitation to remove unincorporated nucleotides and DNA polymerase from PCR amplification products.
MEGAshortscript T7 kit (Life Technologies) or similar RNA transcription kit: The MEGAshortscript kit is designed for high yield transcription of RNAs between 20 – 500 nucleotides.
RNA Clean & Concentrator kit (Zymo Research, Irvine, CA) or similar RNA purification kit: For removal of unincorporated nucleotides and RNA polymerase from in vitro transcription products.
1 M MgCl2 (Life Technologies): Dilute as appropriate for binding buffers.
TES buffer (10 mM Tris-HCl, pH 8, 1 mM EDTA, 0.1 M NaCl): Annealing buffer for run-off transcription.
Ligand (small molecule or protein): Serially dilute in binding buffer. For small molecules ligands, dissolve in binding buffer and filter.
3. SENSOR SURFACE IMMOBILIZATION
3.1 Pre-concentration assay
Pre-concentration refers to the process of obtaining a high local concentration at the sensor surface. For the aptamer binding assay, higher immobilization levels of the DNA linker are preferred to maximize the sensor surface’s capacity to capture aptamer and increase the observable response from ligand binding. Before running the immobilization reaction, it is helpful to run a pre-concentration assay to verify or optimize the levels of DNA linker that interact with the sensor surface and are available for immobilization. To overcome the electrostatic repulsion between the sensor surface and DNA linker, both of which are negatively charged under immobilization conditions, a positively charged carrier, here a CTAB micelle, can shield the negatively charged DNA linker and bring the DNA linker into contact with the sensor surface.
Dock a new CM5 sensor chip into the Biacore instrument. Prime instrument with 1x HBS-N buffer to equilibrate the system.
Prepare three solutions: 0.6 mM CTAB in 10 mM HEPES buffer, 0.6 mM CTAB and 20 μM DNA linker in 10 mM HEPES buffer, and 40 mM NaOH and 1 M NaCl in RNase-free water.
Inject solution of 0.6 mM CTAB in 10 mM HEPES for 3 min at a flow rate of 5 μL/min over a single flow cell (either reference flow cell FC1 or sample flow cell FC2).
Regenerate sensor surface with solution of 40 mM NaOH and 1 M NaCl in RNase-free water for 30 s.
Inject solution of 0.6 mM CTAB and 20 μM DNA linker in 10 mM HEPES for 3 min at a flow rate of 5 μL/min over the same flow cell used in step 3.
Regenerate sensor surface as in step 4.
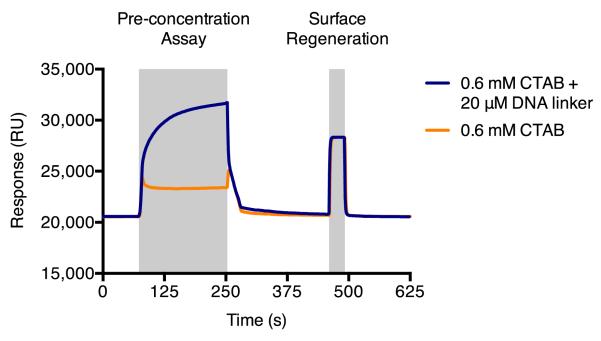
Typically, we observe a response of approximately 2,500 – 3,000 RU for CTAB and 8,000 – 18,000 RU for the CTAB and DNA linker solution (Figure 2). The solution containing both surfactant and DNA linker should produce a higher response. Pre-concentration parameters such as concentration of surfactant or DNA linker, ratio of surfactant to DNA linker, and surfactant used (e.g., CTAB or others such as dodecyltrimethylammonium bromide, DTAB) can be optimized to maximize the potential response observed. The pre-concentration assay is a measurement of interaction between the DNA linker and CTAB micelle with the sensor surface but not of the covalently conjugated DNA linker levels produced in the immobilization reaction. Therefore, optimized conditions for the pre-concentration assay are not necessary equivalent to optimized conditions for the immobilization reaction but can provide a useful starting point for optimization without irreversibly altering the sensor surface.
Figure 2.
Pre-concentration assay for observing interactions with the sensor surface. CTAB forms micelles that carry the DNA linker to the sensor surface, resulting in a measurable binding response.
3.2 DNA linker immobilization
If sufficient interaction is observed in the pre-concentration assay, run an immobilization reaction to immobilize DNA linker covalently onto both flow cells.
Dock a new CM5 sensor chip, or a chip used for pre-concentration assays, into the Biacore instrument. Prime instrument with 1x HBS-N buffer.
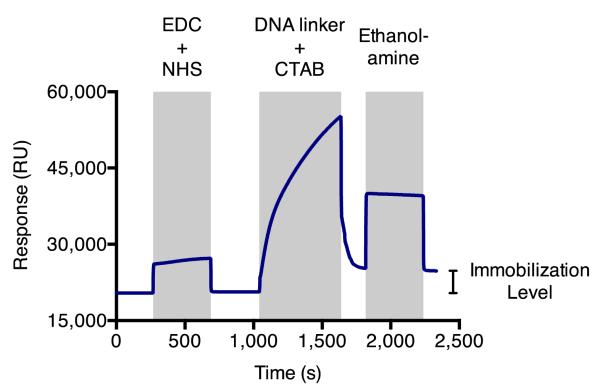
Activate carboxylate groups on chip surface with 1:1 volume ratio of 0.4 M EDC and 0.1 M NHS for 7 min at a flow rate of 10 μL/min. Activation reaction increases observed binding response by approximately 200 RU (Figure 3).
Dilute DNA linker and CTAB in 10 mM HEPES buffer in a 1:30 molar ratio to a final concentration of 20 μM and 0.6 mM, respectively, and inject over the activated surface for 10 min at a flow rate of 5 μL/min.
Block excess activated groups with an injection of 1 M ethanolamine, pH 8.5, for 7 min at a flow rate of 10 μL/min.
Perform immobilization reaction (steps 2 to 4) sequentially on both flow cells (FC1 and FC2). Immobilization reactions yield approximately 3,700 – 4,400 RU of the DNA strand covalently attached to the sensor surface, typically with less than 5% difference between the two flow cells.
Figure 3.
Sensor surface immobilization with poly(T) DNA linker. Amino-modified DNA linker is covalently coupled to carboxylate groups on the sensor surface through an amide bond-forming immobilization reaction.
As with the pre-concentration assay, the immobilization reaction can be optimized by testing different concentrations of surfactant or linker, ratios of surfactant to DNA linker, surfactant used, and duration or flow rate of injection. While solutions of EDC can be stored frozen, use freshly prepared solutions of EDC if low immobilization levels are observed. Immobilized sensor chips remain stable for at least 500 regeneration cycles, with a slight, steady decrease in aptamer capture levels over the lifetime of the chip.
4. CHARACTERIZTION OF APTAMER BINDING PROPERTIES
4.1 Aptamer design and preparation
Aptamers are designed with a 3′ 24-mer poly(A) sequence that is complementary to the DNA linker immobilized on the sensor surface. Check designed aptamer-poly(A) sequences for correct aptamer folding using a secondary structure prediction software, such as RNAstructure. For DNA aptamers, perform steps 1 and 5; for RNA aptamers, perform either step 2 or 3, followed by steps 4 and 5.
DNA aptamers can be synthesized and directly used in the binding assay. For instance, a DNA aptamer for adenosine triphosphate (2) was designed and synthesized as 5′–CCTGGGGGAGTATTGCGGAGGAAGGAAAAAAAAAAAAAAAAAAAAAAAA (1), where the 24-mer poly(A) tail is underlined.
For RNA aptamers, synthesized DNA template sequences contain a 5′ T7 promoter sequence ending with three guanines for RNA transcription and include a short spacer of four cytosines between the aptamer and poly(A) sequences. For example, the DNA template of the RNA aptamer for theophylline (3) was designed and synthesized as 5′–TTCTAATACGACTCACTATAG͇GGAAGTGATACCAGCATCGTCTTGATGCCCTTGGCAGCACTTCCCCCAAAAAAAAAAAAAAAAAAAAAAAA, where the forward primer constant region is in bold, the reverse primer constant region is underlined, and the transcription start site is underlined twice. DNA template oligonucleotides for RNA aptamers must be transcribed into RNA before use. PCR amplify aptamer DNA template using forward and reverse primers, Biacore-fwd and Biacore-rev, respectively, and purify PCR products using a spin column or ethanol precipitation to remove unincorporated nucleotides and DNA polymerase. Check PCR products on an agarose gel for successful amplification and correct product length. Use the purified double-stranded PCR product as a template for preparing RNA aptamers by transcription.
As an alternative to step 2, prepare RNA aptamers by run-off transcription from a synthetic DNA template. For the same theophylline aptamer described in step 2, synthesize the complementary antisense strand, 5′–TTTTTTTTTTTTTTTTTTTTTTTTGGGGGAAGTGCTGCCAAGGGCATCAAGACGATGCTGGTATCACTTCCCTATAGTGAGTCGTATTAGAA, and anneal with the Biacore-fwd primer, which hybridizes to the underlined sequence. Anneal the aptamer antisense strand with the promoter primer by resuspending both in TES buffer at a concentration of approximately 10 – 50 μM in an equimolar ratio or slight excess of primer (e.g., 5:4 ratio of primer to antisense strand), denature at 95 °C for 5 min, and cool to room temperature directly before use. Use this partially double-stranded template for transcription, as only the promoter sequence of the template is required to be double-stranded for transcription. This strategy allows bypassing of the PCR amplification and purification steps in step 2. If low transcription yields are observed, design and synthesize longer, aptamer-specific primers that partially extend into the aptamer sequence to stabilize promoter hybridization during annealing.
Purify RNA transcription products, a minimum yield of 0.5 nmols is required to perform a new aptamer binding experiment (approximately 70 pmol per cycle). Purification methods that remove unincorporated nucleotides and RNA polymerase and enable buffer exchange are preferred and provide more consistent capture levels between experimental runs than not purifying the RNA. Resuspend purified RNA in RNase-free water or binding buffer. DNase treatment to remove DNA template prior to RNA purification is optional, as neither the fully double stranded template from PCR amplification nor the partially double stranded template from run-off transcription should bind to the sensor surface.
Resuspend aptamer in binding buffer, denature at 65 °C for 5 min, and cool to room temperature directly before use.
4.2 Startup cycles
Prior to running the aptamer binding assay, startup cycles stabilize the sensorgram baseline to produce more consistent runs. Typically, three to five startup cycles are run and include injection and regeneration steps. Either binding buffer or aptamer can be injected. Aptamer injection provides a means to verify sufficient aptamer capture before starting the binding assay and allows a user to stop or modify the run if capture levels are too low. To conserve the amount of aptamer used per experiment, particularly for previously verified preparations, buffer injections can equilibrate the system without aptamer consumption.
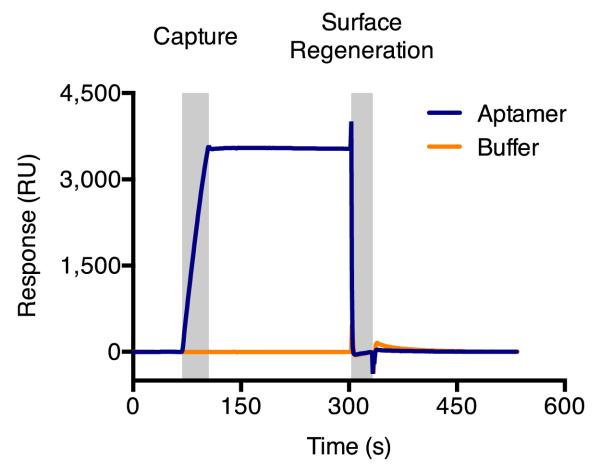
Startup cycles also allow observation of successful regeneration conditions. A regeneration solution of 25 mM NaOH is capable of fully dissociating aptamer and ligand from the DNA linker on the sensor surface (Figure 4). If complete regeneration is not observed, test other bases, acids, denaturants, or salts; modify their concentrations; or adjust the flow rate or duration of the injection to optimize regeneration conditions. Complete regeneration occurs when cycles begin and end at the same response level.
Dock CM5 sensor chip immobilized with DNA linker into Biacore instrument and prime system with binding buffer, typically 1x HBS-N, pH 7.4, supplemented with 5 mM MgCl2, unless another MgCl2 concentration is desired.
Inject binding buffer or aptamer solution over sample flow cell (FC2) for 40 s at a flow rate of 5 μL/min. Approximately 70 pmol (1 – 2 μg) of aptamer per run is sufficient for observing small molecule binding and should yield aptamer capture levels of approximately 2,000 – 5,000 RU. Extend injection duration or increase flow rate for dilute RNA samples or low molecular weight ligands to achieve higher capture levels. For protein ligands, less aptamer needs to be captured, as protein ligands produce a much larger binding response.
Regenerate sensor surface with 25 mM NaOH for 30 s at a flow rate of 30 μL/min.
Repeat steps 2 and 3 two to four more times, or until successful regeneration and stable sensorgram baselines are observed. If binding assays for multiple aptamer sequences are run within a single experiment, each startup cycle can inject a different aptamer.
Figure 4.
Overlaid startup cycle sensorgrams for aptamer capture and a binding buffer control, followed by regeneration of the binding surface. Sensorgram y-axes have been adjusted to set capture baseline levels to y=0. Sensorgrams exhibit complete regeneration and stable baselines, with cycles starting and ending at the same response level.
4.3 Aptamer binding assay
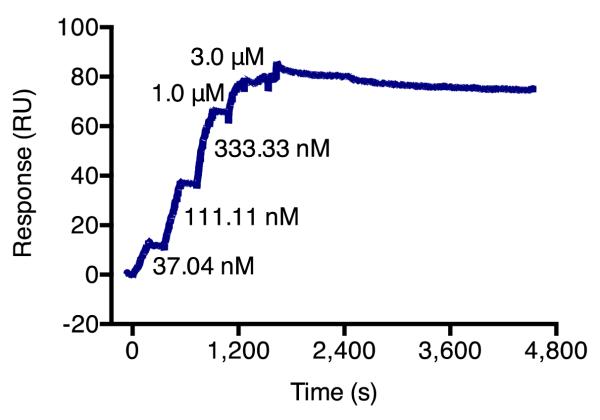
The aptamer binding assay consists of aptamer capture, ligand association and dissociation phases, and surface regeneration (Figure 5). The SPR-based characterization platform is capable of measuring both binding kinetics and equilibrium affinities (1) through multi-cycle kinetics, where each ligand concentration is run in a separate cycle with its own dissociation phase. Alternatively, single-cycle kinetics may be used, wherein increasing concentrations of ligand are injected without surface regeneration in a single cycle with a single dissociation phase. Optimization of association and dissociation phase lengths and ligand concentrations tested are necessary for accurate measurement. Association phase lengths depend on the time needed to reach equilibrium, which can range from less than 5 s to greater than 180 s at a flow rate of 30 μL/min (1). Reaching equilibrium in the ligand association phase is necessary for determining KD through steady-state affinity but not for determining binding kinetics; whether equilibrium is reached may depend on the maximum injection volume of the instrument used, which for the Biacore X100 instrument limits the injection length to 180 s at a flow rate of 30 μL/min. Dissociation phase lengths are chosen so that substantial ligand dissociation is observed, generally with at least a 10-fold greater signal-to-noise ratio for the decrease in ligand binding response. For aptamers with very slow dissociation rates (< 10−3 s−1), dissociation phase lengths greater than 10 min may be necessary and single-cycle kinetic analysis should be considered as described in Section 4.4 (Figure 7). For aptamer–ligand complexes that reach equilibrium, ligand concentrations tested should span approximately 10-fold below and above the KD and cover the 0.2 – 0.8 binding saturation range. This is readily achievable using 6 – 8 concentration points serially diluted by 2 – 2.5-fold. For aptamer–ligand complexes that do not reach equilibrium in the experimental timeframe, higher concentrations of ligand will be required to provide sufficient sensorgram curvature for fitting to a 1:1 kinetic binding model.
Figure 5.
Full-length, multi-cycle aptamer binding assay. Overlaid sensorgrams for seven ligand concentrations are shown. Dashed line indicates transition from association phase to dissociation phase. Data shown is for the theophylline aptamer-ligand pair. Sensorgram y-axes have been adjusted to set aptamer capture level to y=0.
Figure 7.
Single-cycle kinetic analysis of the cyclic di-GMP class I aptamer. For aptamers with very slow dissociation rates, single-cycle kinetics can be used to reduce the length of runs and minimize baseline variability. Adapted, with permission, from reference (1).
Previously uncharacterized aptamers can be rapidly screened to determine the relevant experimental conditions for characterization. Initial association and dissociation phase lengths of 90 to 120 s can be subsequently extended or decreased based on the observed approach to equilibrium and dissociation rate. Running a few concentration points, for example 3 to 5 concentrations at a 10-fold serial dilution, can quickly determine the relevant binding concentration range. Previously reported properties can guide initial screening; for instance, if an aptamer’s binding affinity has previously been reported, ligand concentrations spanning 10-fold below and above the reported KD can initially be tested.
Immediately after startup cycles are run, capture aptamer onto the sensor surface for 40 s at a flow rate of 5 μL/min.
Prepare filtered serial dilution of ligand in binding buffer. Inject binding buffer or ligand solution at a flow rate of 30 μL/min for a ligand association phase length relevant for the aptamer–ligand pair being characterized.
Dissociate ligand by injecting binding buffer at a flow rate of 30 μL/min for a ligand dissociation phase length relevant for the aptamer–ligand pair being characterized.
Regenerate sensor surface with 25 mM NaOH for 30 s at a flow rate of 30 μL/min over both flow cells. Surface regeneration should fully remove aptamer and ligand so that beginning and end response levels of all runs are the same (Figure 5).
Two binding buffer runs are recommended, one before and one after the ligand serial dilution, to check for baseline drift or in case one buffer trace is unsuitable for use as a reference as described in Section 4.4.
4.4 Analysis of aptamer binding properties
Kinetic and equilibrium binding characterization provide two methods for determining aptamer binding affinities. When possible, both kinetic and equilibrium analyses should be conducted as an internal check for confidence; KD’s obtained through both methods should differ by no more than approximately 2-fold (1).
Select runs for analysis. Double-reference all data by calculating the difference between the response from the reference flow cell (FC1) and the response from the sample flow cell (FC2), and then subtracting the reference-subtracted blank injection of binding buffer from reference-subtracted injections of ligand. Check that the resulting aptamer capture baselines (section 1 in Figure 6b) are flat with a binding response of 0 for all analyzed sensorgrams after double referencing. Similarly, for aptamer–ligand pairs that fully dissociate during the ligand dissociation phase, sensorgrams should end with a binding response of 0 and not have a negative value (section 4 in Figure 6b). Most small molecule binding results in maximal response greater than 10 RU; therefore, a non-zero value of ± 0.8 RU is acceptable for both the capture baseline and final binding response. This minor variation is due to noise and will not interfere with the following analysis.
For kinetic analysis, fit a 1:1 binding model to selected sensorgrams (Figure 6b). Fitted parameters include the association rate, ka, and the dissociation rate, kd. The dissociation constant, KD, is calculated as kd/ka.
For equilibrium analysis, plot the binding response averaged over a time window of 5 s versus ligand concentration and fit to a steady-state affinity model. The time window should be selected in the region where the response has fully plateaued and the binding has reached equilibrium (section 3 in Figure 6b, sub-segment 3). If a plateau is not present, the association phase length should be increased or only kinetic analysis should be performed. Ligand concentration range should nearly reach binding saturation (Figure 6c).
Figure 6.
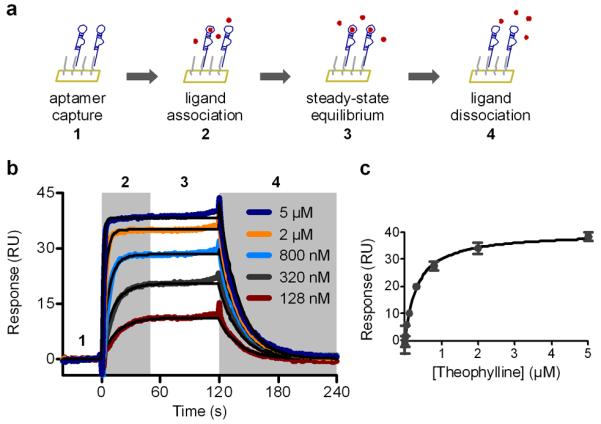
Kinetic and equilibrium binding characterization of aptamers. (a) Schematic diagram of SPR-based aptamer binding characterization. (b) Multi-cycle kinetic analysis of theophylline aptamer binding. Overlaid sensorgrams for five concentrations of theophylline are shown and fit to a 1:1 kinetic binding model shown in black. Overlaid signals are the same as those shown in Figure 5. (c) Equilibrium binding analysis of theophylline aptamer binding fit to a steady-state affinity model shown in black. Adapted, with permission, from reference (1).
For aptamer–ligand interactions with very slow dissociation rates (< 10−4 s−1), single-cycle kinetic analysis may be preferred over multi-cycle analysis. The long timeframe required for observing significant ligand dissociation (> 20 min) would lead to excessively long experimental run times for multi-cycle analysis and more baseline variation, which can negatively affect kinetic analysis. Single-cycle kinetics enables a single, long dissociation phase to be run for multiple ligand concentrations (Figure 7). As for all kinetic analyses, it is critical that the aptamer capture baselines are flat with a binding response of 0 after double referencing.
5. CONCLUSION
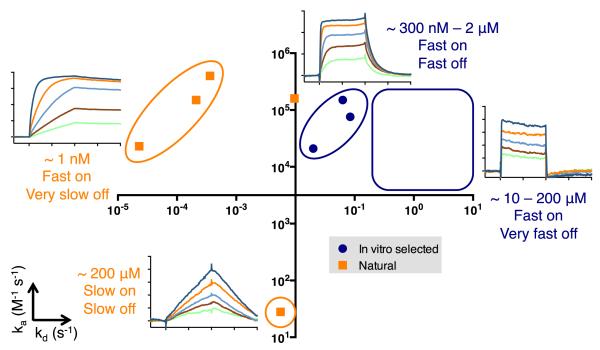
The SPR-based platform for aptamer characterization outlined here is broadly useful for studying and prototyping aptamer function. This method has recently enabled the first side-by-side comparison of aptamer binding properties under consistent characterization conditions for a diverse range of previously reported aptamers (Figure 8) (1). The aptamers so far characterized using this platform span natural and in vitro selected sources, are composed of RNA or DNA, range from 25 to 96 nucleotides in length, and exhibit KD’s covering over five orders of magnitude, from 890 pM to 200 μM (1).
Figure 8.
Comparison of aptamer kinetic properties under consistent characterization conditions. Range of kinetic values for in vitro selected aptamers with fast on and very fast off binding kinetics is estimated, since kinetic constants could not be uniquely determined based on measurement limits of specific instrument used. Kinetic values and representative sensorgrams are reproduced from reference (1).
This characterization platform is a useful tool for comparing aptamer properties and rapidly testing aptamer binding under varying conditions. The set of aptamers characterized so far using this method illustrates distinct clustering of aptamer kinetic properties, each with a distinctive sensorgram shape (Figure 8). SPR enables facile control over multiple binding conditions and aptamer and ligand properties, allowing detailed study of the effects on aptamer binding of pH, temperature, or ion dependence; ligand specificity; ligand structure-activity relationships using ligand analogues; and aptamer sequence-activity relationships using introduced point mutations. In addition, this method is directly extendable to protein ligands and aptamers containing either modified nucleotides or expanded genetic alphabets. This experimental flexibility contrasts with other methods that require specific characterization conditions or intrinsic ligand properties (1). For studying and designing aptamers and aptamer-based gene-regulatory devices (4) for in vivo use, testing relevant physiological conditions is important for understanding aptamer behavior and for measuring quantitative parameters that can be incorporated into computational models of aptamer function (5). The broad screening capabilities of this platform make it compatible with in vitro selection processes (6, 7) for monitoring binding enrichment of bulk sequence libraries and for prototyping candidate aptamer sequences, where functional sequences can be identified, characterized, truncated, and coupled with methods for constructing synthetic RNA regulatory switches or other nucleic acid devices (8). This robust and rapid aptamer characterization platform provides a versatile tool that can be readily combined with other methods for advancing the study, design, and engineering of functional nucleic acids.
ACKNOWLEDGMENTS
We thank J. Liang for contributions to assay development and aptamer characterization.
7. REFERENCES
- 1.Chang AL, McKeague M, Liang JC, Smolke CD. Kinetic and equilibrium binding characterization of aptamers to small molecules using a label-free, sensitive, and scalable platform. Analytical chemistry. 2014;86(7):3273–3278. doi: 10.1021/ac5001527. [DOI] [PMC free article] [PubMed] [Google Scholar]
- 2.Huizenga DE, Szostak JW. A DNA Aptamer That Binds Adenosine and ATP. Biochemistry. 1995;34(2):656–665. doi: 10.1021/bi00002a033. [DOI] [PubMed] [Google Scholar]
- 3.Jenison RD, Gill SC, Pardi A, Polisky B. High-resolution molecular discrimination by RNA. Science. 1994;263(5152):1425–1429. doi: 10.1126/science.7510417. [DOI] [PubMed] [Google Scholar]
- 4.Chang AL, Wolf JJ, Smolke CD. Synthetic RNA switches as a tool for temporal and spatial control over gene expression. Current Opinion in Biotechnology. 2012;23(5):679–688. doi: 10.1016/j.copbio.2012.01.005. [DOI] [PMC free article] [PubMed] [Google Scholar]
- 5.Beisel CL, Smolke CD. Design principles for riboswitch function. PLoS computational biology. 2009;5(4):e1000363. doi: 10.1371/journal.pcbi.1000363. [DOI] [PMC free article] [PubMed] [Google Scholar]
- 6.Ozer A, Pagano JM, Lis JT. New Technologies Provide Quantum Changes in the Scale, Speed, and Success of SELEX Methods and Aptamer Characterization. Molecular therapy. Nucleic acids. 2014;3:e183. doi: 10.1038/mtna.2014.34. [DOI] [PMC free article] [PubMed] [Google Scholar]
- 7.McKeague M, Derosa MC. Challenges and opportunities for small molecule aptamer development. Journal of nucleic acids. 2012;2012:748913. doi: 10.1155/2012/748913. [DOI] [PMC free article] [PubMed] [Google Scholar]
- 8.Liang JC, Chang AL, Kennedy AB, Smolke CD. A high-throughput, quantitative cell-based screen for efficient tailoring of RNA device activity. Nucleic acids research. 2012;40(20):e154. doi: 10.1093/nar/gks636. [DOI] [PMC free article] [PubMed] [Google Scholar]


