

Abstract
Background
Chronic alcohol exposure exerts numerous adverse effects, although the specific mechanisms underlying these negative effects on different tissues are not completely understood. Alcohol also affects core properties of the circadian clock system and it has been shown that disruption of circadian rhythms confers vulnerability to alcohol-induced pathology of the gastrointestinal barrier and liver. Despite these findings, little is known of the molecular interactions between alcohol and the circadian clock system, especially regarding implications for tissue-specific susceptibility to alcohol pathologies. The aim of the present study was to identify changes in expression of genes relevant to alcohol pathologies and circadian clock function in different tissues in response to chronic alcohol intake.
Methods
Wild-type and circadian ClockΔ19 mutant mice were subjected to a 10-week chronic alcohol protocol, after which hippocampal, liver and proximal colon tissues were harvested for gene expression analysis using a custom-designed multiplex magnetic bead hybridization assay that provided quantitative assessment of 80 mRNA targets of interest, including five housekeeping genes and a predetermined set of 75 genes relevant for alcohol pathology and circadian clock function.
Results
Significant alterations in expression levels attributable to genotype, alcohol and/or a genotype by alcohol interaction were observed in all three tissues, with distinct patterns of expression changes observed in each. Of particular interest was the finding that a high proportion of genes involved in inflammation and metabolism on the array was significantly affected by alcohol and the ClockΔ19 mutation in the hippocampus, suggesting a suite of molecular changes that may contribute to pathological change.
Conclusions
These results reveal the tissue-specific nature of gene expression responses to chronic alcohol exposure and the ClockΔ19 mutation, and identify specific expression profiles that may contribute to tissue-specific vulnerability to alcohol-induced injury in the brain, colon and liver.
Keywords: Circadian rhythms, Alcohol, Gene expression, Mouse models, Clock mutation
Introduction
Chronic alcohol consumption is associated with significant mortality and substantial medical, neurological and psychiatric co-morbidity, including steatohepatitis and cirrhosis, pancreatitis, cardiomyopathy, increased risk of hypertension, several cancers (e.g., head and neck, esophagus, colon, pancreas and liver), cognitive impairment, mood disorders and depression (Gao and Bataller, 2011, Kelley and Dantzer, 2011). Interestingly, not all alcoholics develop organ damage (Grant et al., 1988, Keshavarzian et al., 1999). Furthermore, of those alcoholics that do exhibit some degree of alcohol-related toxicity, not all organs are susceptible (Wang et al., 2010, Szabo and Bala, 2010). As such, we sought to understand tissue-specific responses to alcohol by examining three different tissues that are affected by alcohol: hippocampus, liver and colon. These tissues were studied because chronic alcohol exposure contributes to pathological damage and/or functional impairment in each.
The genes examined in each organ encompass mechanisms believed to contribute to the pathogenesis of alcohol-related tissue injury, including inflammation, metabolism, oxidative stress, cell-cell junction and epithelial permeability, brain-gut axis, cell division/cancer and circadian rhythms and circadian clock-controlled genes, to allow us to determine whether these organs affected by alcohol exhibit similar transcriptional profiles. Although broad associations between chronic alcohol consumption and subsequent biological responses have been made, the precise molecular mechanisms leading to alcohol-induced physiological dysfunction, tissue injury and organ dysfunction remain incompletely understood, and we sought to fill this gap in knowledge.
The circadian clock system represents a biological mechanism that may contribute to alcohol-induced tissue injury and organ damage because: (1) disruption of the circadian clock system promotes inflammation (Castanon-Cervantes et al., 2010), and (2) alcohol can impact the circadian clock in different organs (Chen et al., 2004, Spanagel et al., 2005b, Summa et al., 2013, Swanson et al., 2011). Studies using Caco-2 cells, a human epithelial colorectal adenocarcinoma cell line that serves as an in vitro model of intestinal barrier function, have demonstrated that circadian clock genes influence alcohol-induced increases in monolayer permeability: knock-down of the circadian genes Clock and Per2 prevents alcohol-induced increases in permeability, indicating that these genes respond to alcohol and impact the regulation of barrier integrity (Swanson et al., 2011). Additionally, our recent studies have shown that disruption of circadian organization in mice, using independent genetic and environmental strategies, exacerbates alcohol-induced intestinal hyperpermeability and hepatic pathology (Summa et al., 2013). Together, these results suggest complex relationships between the circadian clock system and biological responses to alcohol, however the mechanisms through which alcohol and the circadian system interact to promote tissue injury are not fully understood.
A number of studies have examined how alcohol impacts core properties of the circadian clock system, such as the free-running period, the phase of entrainment and the phase-shifting effects of exposure to light pulses (Brager et al., 2011a, Brager et al., 2010, Brager et al., 2011b, Rosenwasser et al., 2005). There has also been significant interest in identifying and cataloging diurnal and circadian gene expression rhythms, as well as identifying downstream targets and gene networks affected by the circadian clock in various mouse tissues and genetic models, albeit in the absence of alcohol (Miller et al., 2007, Panda et al., 2002, Storch et al., 2002). However, relatively little effort has been made in linking alcohol consumption and circadian rhythm disruption, especially in different genetic models of circadian disruption. Besides liver, other tissues and brain regions most vulnerable to alcohol-related damage have not been well-studied. Therefore not much is known regarding the specific molecular mechanisms underlying the impact of alcohol on circadian clock gene expression in different tissues or on the regulation of molecular/cellular pathways relevant to alcohol-related pathology in mouse models of circadian disruption.
We attempted to understand the relationships between alcohol, alcohol-related pathologies, the circadian clock, and the regulation of gene expression by examining expression patterns in the hippocampus, liver and colon of alcohol-fed or alcohol-free control diet-fed wild-type mice and circadian ClockΔ19 mutant mice (Clock mutant hereafter). Hippocampus, liver and colon were examined in the current study because chronic alcohol exposure contributes to pathological damage and/or functional impairment in each tissue. The results presented in this study were obtained from analyses of tissues collected from mice originally described in a previous publication reporting in vivo physiological measurements as well as post-mortem tissue analyses (Summa et al., 2013). Mutant mice harbor a dominant-negative mutation (Δ19) of the core circadian gene Clock (Clock mutation hereafter) (King et al., 1997a, King et al., 1997b, Vitaterna et al., 1994). Clock mutant mice were utilized as a model of circadian clock disruption to determine whether this particular genetic aberration of the clock affects the regulation of gene expression in response to chronic alcohol consumption in tissues susceptible to alcohol toxicity. These animals have been used widely to study the role of the circadian clock system in various physiological and pathophysiological processes (Naylor et al., 2000, Roybal et al., 2007, Summa et al., 2013, Turek et al., 2005).
We examined the expression of 75 genes (inflammation, metabolism, oxidative stress, cell-cell junction and epithelial permeability, brain-gut axis, cell division/cancer and circadian rhythms and circadian clock-controlled genes) and identified tissue-specific alterations in expression from each functional gene category. Distinct sets of genes were identified that were significantly affected by genotype, alcohol or genotype by alcohol interaction. Such alterations may contribute to pathological transformation in tissues affected by chronic alcohol exposure and may underlie, at least in part, tissue-specific vulnerability to alcohol toxicity and injury.
Materials and Methods
Laboratory Animals
Young adult (7-9 week old) male mice homozygous Clock mutant mice and wild-type littermate mice, obtained from the breeding colony maintained at Northwestern University, were individually housed in light-tight, ventilated cabinets and maintained on a constant 12 hours light:12 hours dark (12:12 LD) cycle at constant temperature and humidity, as described previously (Summa et al., 2013). Locomotor activity rhythms were measured as previously described using cages equipped with infrared beams that cross through the cage and record breaks in the beam as activity (Summa et al., 2013). Upon separation into individual cages, mice were assigned to either the alcohol experimental group or the alcohol-free, dextrose control group for the duration of the experimental protocol described below. Group selection was determined by randomly assigning an individual mouse of each genotype to each dietary group (i.e., alcohol or dextrose control), then matching subsequent animals by body weight such that there were no significant differences in body weight between groups at the onset of the experiment. The experimental design included four groups: 1) Wild-type dextrose diet (WTD), wild-type alcohol diet (WTA), Clock mutant dextrose diet (CD) and Clock mutant alcohol diet (CA). All studies were reviewed and approved in advance by the Institutional Animal Care and Use Committee at Northwestern University.
Experimental Protocol
The experiments utilized the Nanji liquid alcohol diet protocol as described previously (Nanji et al., 1994, Summa et al., 2013). This diet, used to study alcoholic steatohepatitis in rodents (Forsyth et al., 2011, Summa et al., 2013), is a modification of the Lieber-DiCarli rodent alcohol diet. The Nanji diet utilized in the present study is nutritionally balanced, prepared fresh daily and provided to the mice at Zeitgeber Time 4 (i.e., ZT4, four hours after light onset) in specialized individual feeding tubes that allow for daily monitoring of food intake, which was monitored by checking diet levels at light onset and light offset for one or two consecutive 24-hour periods each week of the experimental protocol. There was a two-week gradual introduction to alcohol in the diet (0-29% of total calories from alcohol), followed by eight weeks on the full alcohol-containing diet (29% of total calories from alcohol, 4.5% v/v).
All mice were euthanized by conscious decapitation and tissues were harvested at ZT6 for gene expression analyses. The hippocampus was dissected over dry ice. Isolated hippocampus, liver and proximal colon samples were immediately frozen in liquid nitrogen and stored at -80°C until RNA isolation and subsequent gene expression analysis.
The tissues were harvested for expression analysis at ZT6 because we observed that mice were reliably consuming relatively large portions of their daily diet intake during the light phase after placement of the freshly prepared diet into each animal's home cage daily at ZT4 (Supporting Online Information). Thus, collection at ZT6 was presumed to enable assessment of expression changes occurring near the onset of a predictable daily bout of drinking. In addition, we have data for serum alcohol levels at ZT6 (Summa et al., 2013) and preliminary data suggesting that intestinal permeability peaks near ZT0 (data not shown), therefore we felt that analyzing expression at ZT6 may incorporate biological responses occurring near the apparent peak in daily endotoxin levels.
Assessment and Analysis of Gene Expression
Gene expression analysis was performed at the University of Illinois-Chicago core facility using an Affymetrix (Santa Clara, CA) custom QuantiGene 80 Plex assay. Briefly, this assay provides quantitative measurement of 80 mRNA targets of interest on a single plate. The 80 genes measured in this study included five housekeeping genes and a set of 75 genes selected from nine functional categories, including inflammation, metabolism, oxidative stress, cell-junction and epithelial permeability, brain-gut axis, cell division/cancer and circadian rhythms and circadian clock-controlled genes (CCGs) (Table 1).
Table 1. Genes analyzed for expression levels using a custom-designed Affymetrix 80Plex bead chip.
The selected genes were chosen for analysis because of their classification in one of the following functional categories: circadian clock and clock-controlled genes, inflammation, metabolism, oxidative stress, cell-junction and epithelial permeability, brain-gut axis and cancer.
| Gene Symbol | Gene Name | RefSeq No. | Functional Category |
|---|---|---|---|
| Arntl | aryl hydrocarbon receptor nuclear translocator-like | NM_007489 | clock and clock-controlled genes |
| Clock | circadian locomotor output cycles kaput | NM_007715 | clock and clock-controlled genes |
| Creb1 | cAMP responsive element binding protein 1 | NM_133828 | clock and clock-controlled genes |
| Cry1 | cryptochrome 1 (photolyase-like) | NM_007771 | clock and clock-controlled genes |
| Cry2 | cryptochrome 2 (photolyase-like) | NM_009963 | clock and clock-controlled genes |
| Csnk1e | casein kinase 1, epsilon | NM_013767 | clock and clock-controlled genes |
| Dbp | D site albumin promoter binding protein | NM_016974 | clock and clock-controlled genes |
| Hlf | hepatic leukemia factor | NM_172563 | clock and clock-controlled genes |
| Hnf1a | HNF1 homeobox A | NM_009327 | clock and clock-controlled genes |
| Hnf4a | hepatic nuclear factor 4, alpha | NM_008261 | clock and clock-controlled genes |
| Nampt | nicotinamide phosphoribosyltransferase | NM_021524 | clock and clock-controlled genes |
| Nfil3 | nuclear factor, interleukin 3, regulated | NM_017373 | clock and clock-controlled genes |
| Npas2 | neuronal PAS domain protein 2 | NM_008719 | clock and clock-controlled genes |
| Nr1d1 | nuclear receptor subfamily 1, group D, member 1 | NM_145434 | clock and clock-controlled genes |
| Per1 | period 1 | NM_011065 | clock and clock-controlled genes |
| Per2 | period 2 | NM_011066 | clock and clock-controlled genes |
| Per3 | period 3 | NM_011067 | clock and clock-controlled genes |
| Prkab1 | protein kinase, AMP-activated, beta 1 non-catalytic subunit | NM_031869 | clock and clock-controlled genes |
| Rora | RAR-related orphan receptor alpha | NM_013646 | clock and clock-controlled genes |
| Sirt1 | sirtuin 1 | NM_019812 | clock and clock-controlled genes |
| Tef | thyrotrophic embryonic factor | NM_017376 | clock and clock-controlled genes |
| Akp3 | alkaline phosphatase 3, intestine, not Mn requiring | NM_007432 | inflammation |
| Ccl2 | chemokine (C-C motif) ligand 2 | NM_011333 | inflammation |
| Cxcl1 | chemokine (C-X-C motif) ligand 1 | NM_008176 | inflammation |
| Cxcl10 | chemokine (C-X-C motif) ligand 10 | NM_021274 | inflammation |
| Hmgb1 | high mobility group box 1 | NM_010439 | inflammation |
| Il10 | interleukin 10 | NM_010548 | inflammation |
| Il17a | interleukin 17A | NM_010552 | inflammation |
| Il18 | interleukin 18 | NM_008360 | inflammation |
| Il1b | interleukin 1 beta | NM_008361 | inflammation |
| Il6 | interleukin 6 | NM_031168 | inflammation |
| Lbp | lipopolysaccharide binding protein | NM_008489 | inflammation |
| Nlrp3 | NLR family, pyrin domain containing 3 | NM_145827 | inflammation |
| Pde4b | phosphodiesterase 4B, cAMP specific | NM_019840 | inflammation |
| Ptgs2 | prostaglandin-endoperoxide synthase 2 | NM_011198 | inflammation |
| Rela | v-rel reticuloendotheliosis viral oncogene homolog A (avian) | NM_009045 | inflammation |
| Tlr2 | toll-like receptor 2 | NM_011905 | inflammation |
| Tlr4 | toll-like receptor 4 | NM_021297 | inflammation |
| Tlr5 | toll-like receptor 5 | NM_016928 | inflammation |
| Tlr9 | toll-like receptor 9 | NM_031178 | inflammation |
| Tnf | tumor necrosis factor | NM_013693 | inflammation |
| Adipoq | adiponectin, C1Q and collagen domain containing | NM_009605 | metabolism |
| Ccrn4l | CCR4 carbon catabolite repression 4-like (S. cerevisiae) | NM_009834 | metabolism |
| Cyp7a1 | cytochrome P450, family 7, subfamily a, polypeptide 1 | NM_007824 | metabolism |
| Hmgcr | 3-hydroxy-3-methylglutaryl-Coenzyme A reductase | NM_008255 | metabolism |
| Lep | leptin | NM_008493 | metabolism |
| Nr1h3 | nuclear receptor subfamily 1, group H, member 3 | NM_013839 | metabolism |
| Nr1h4 | nuclear receptor subfamily 1, group H, member 4 | NM_009108 | metabolism |
| Ppara | peroxisome proliferator activated receptor alpha | NM_011144 | metabolism |
| Pparg | peroxisome proliferator-activated receptor gamma | NM_011146 | metabolism |
| Ppargc1a | peroxisome proliferative activated receptor, gamma, coactivator 1 alpha | NM_008904 | metabolism |
| Prkcd | protein kinase C, delta | NM_011103 | metabolism |
| Srebf1 | sterol regulatory element binding transcription factor 1 | NM_011480 | metabolism |
| Cyp2e1 | cytochrome P450, family 2, subfamily e, polypeptide 1 | NM_021282 | oxidative stress |
| Gpx2 | glutathione peroxidase 2 | NM_030677 | oxidative stress |
| Nfe2l2 | nuclear factor, erythroid derived 2, like 2 | NM_010902 | oxidative stress |
| Nos1 | nitric oxide synthase 1, neuronal | NM_008712 | oxidative stress |
| Nos2 | nitric oxide synthase 2, inducible | NM_010927 | oxidative stress |
| Nox1 | NADPH oxidase 1 | NM_172203 | oxidative stress |
| Ucp2 | uncoupling protein 2 (mitochondrial, proton carrier) | NM_011671 | oxidative stress |
| Cdh1 | cadherin 1, type 1, E-cadherin (epithelial) | NM_009864 | cell-junction and epithelial permeability |
| Cldn1 | claudin 1 | NM_016674 | cell-junction and epithelial permeability |
| Cldn2 | claudin 2 | NM_016675 | cell-junction and epithelial permeability |
| Cldn4 | claudin 4 | NM_009903 | cell-junction and epithelial permeability |
| Ocln | occludin | NM_008756 | cell-junction and epithelial permeability |
| Tjp1 | tight junction protein 1 | NM_009386 | cell-junction and epithelial permeability |
| Fos | FBJ osteosarcoma oncogene | NM_010234 | brain-gut axis |
| Gfap | glial fibrillary acidic protein | NM_010277 | brain-gut axis |
| Npy | neuropeptide Y | NM_023456 | brain-gut axis |
| Vip | vasoactive intestinal polypeptide | NM_011702 | brain-gut axis |
| Ccnd1 | cyclin D1 | NM_007631 | cancer |
| Ctnnb1 | catenin (cadherin associated protein), beta 1 | NM_007614 | cancer |
| Hif1a | hypoxia inducible factor 1, alpha subunit | NM_010431 | cancer |
| Mmp9 | matrix metallopeptidase 9 | NM_013599 | cancer |
| Tgfb1 | transforming growth factor, beta 1 | NM_011577 | cancer |
Hippocampus, liver and proximal colon samples were prepared as tissue homogenates in our laboratory using Affymetrix lysis buffer and processed according to the manufacturer's instructions. Raw intensity readings of RNA amount were obtained for subsequent statistical analyses. These values were processed and analyzed as described in the Supporting Online Information. In order to validate results obtained from the analysis of the array expression data, we performed RT-PCR on Tlr9 in the hippocampus, Tlr5 in the liver and Cdh1 in the proximal colon, as described in the Supporting Online Information.
Results
Hippocampus
In total, 56 genes exhibited significantly altered expression patterns in the hippocampus for at least one term (genotype, alcohol or genotype by alcohol interaction) among experimental groups. These genes group into four clusters (i.e., orange, blue, pink and green) based on the similarity of expression changes (Table 2, Figure 1).
Table 2. Genes that varied significantly across experimental groups in the hippocampus.
Genes are grouped into clusters, as shown in Figure 1.
| Gene Symbol | Functional Category | 2-way ANOVA | Clusters | ||
|---|---|---|---|---|---|
|
| |||||
| Genotype | Diet | G × D interaction | |||
| Ocln | cell-junction and epithelial permeability | F1,14 = 6.32, P = 0.0248 | n.s. | n.s. | orange |
| Il18 | inflammation | F1,14 = 6.52, P = 0.023 | n.s. | n.s. | orange |
| Npy | brain-gut axis | F1,14 = 36.01, P = 3.25E-05 | n.s. | n.s. | orange |
| Dbp | clock and clock-controlled genes | F1,14 = 311.04, P = 5.87E-11 | n.s. | n.s. | orange |
| Cry2 | clock and clock-controlled genes | F1,14 = 125.28, P = 2.27E-08 | n.s. | n.s. | orange |
| Nr1d1 | clock and clock-controlled genes | F1,14 = 141.13, P = 1.06E-08 | n.s. | n.s. | orange |
| Per1 | clock and clock-controlled genes | F1,14 = 30.34, P = 7.71E-05 | n.s. | n.s. | orange |
| Tef | clock and clock-controlled genes | F1,14 = 100.31, P = 9.17E-08 | n.s. | n.s. | orange |
| Per3 | clock and clock-controlled genes | F1,14 = 266.57, P = 1.65E-10 | n.s. | n.s. | orange |
| Per2 | clock and clock-controlled genes | F1,14 = 36.92, P = 2.86E-05 | F1,14 = 6.75, P = 0.021 | n.s. | orange |
| Hlf | clock and clock-controlled genes | F1,14 = 34.36, P = 4.13E-05 | n.s. | F1,14 = 15.23, P = 0.0016 | orange |
| Nampt | clock and clock-controlled genes | F1,14 = 13.72, P = 0.00236 | n.s. | n.s. | orange |
| Hif1a | cancer | F1,14 = 18.82, P = 0.000681 | n.s. | n.s. | orange |
| Sirt1 | clock and clock-controlled genes | F1,14 = 6.1, P = 0.027 | n.s. | n.s. | orange |
| Hmgb1 | inflammation | F1,14 = 8.09, P = 0.013 | n.s. | n.s. | orange |
| Rela | inflammation | F1,14 = 4.86, P = 0.0448 | n.s. | n.s. | orange |
| Nfe2l2 | oxidative stress | F1,14 = 13.75, P = 0.00234 | F1,14 = 18.66, P = 0.000707 | n.s. | orange |
| Clock | clock and clock-controlled genes | F1,14 = 15.64, P = 0.00144 | F1,14 = 16.02, P = 0.00131 | n.s. | orange |
| Vip | brain-gut axis | n.s. | n.s. | F1,14 = 6.41, P = 0.0239 | pink |
| Tlr4 | inflammation | n.s. | F1,14 = 13.37, P = 0.00259 | n.s. | blue |
| Cxcl1 | inflammation | n.s. | F1,14 = 10.94, P = 0.00519 | n.s. | blue |
| Ppara | metabolism | F1,14 = 17.61, P = 0.000897 | F1,14 = 14.92, P = 0.00172 | n.s. | green |
| Creb1 | clock and clock-controlled genes | n.s. | F1,14 = 6.69, P = 0.0216 | n.s. | green |
| Mmp9 | cancer | F1,14 = 12.86, P = 0.00298 | n.s. | n.s. | green |
| Pparg | metabolism | F1,14 = 12.19, P = 0.0036 | F1,14 = 10.58, P = 0.00578 | n.s. | green |
| Lep | metabolism | F1,14 = 12.75, P = 0.00307 | F1,14 = 8.95, P = 0.00971 | n.s. | green |
| Cldn4 | cell-junction and epithelial permeability | F1,14 = 22.34, P = 0.000325 | F1,14 = 11.38, P = 0.00455 | n.s. | green |
| Tlr9 | inflammation | F1,14 = 16.83, P = 0.00108 | F1,14 = 13.97, P = 0.00221 | n.s. | green |
| Il17a | inflammation | F1,14 = 9.4, P = 0.00837 | F1,14 = 6.36, P = 0.0244 | n.s. | green |
| Cxcl10 | inflammation | F1,14 = 19.39, P = 0.000601 | F1,14 = 16.4, P = 0.00119 | n.s. | green |
| Hnf4a | clock and clock-controlled genes | F1,14 = 7.98, P = 0.0135 | n.s. | n.s. | green |
| Nlrp3 | inflammation | F1,14 = 16.19, P = 0.00126 | F1,14 = 6.77, P = 0.0209 | n.s. | green |
| Adipoq | metabolism | F1,14 = 29.65, P = 8.63E-05 | F1,14 = 17.33, P = 0.000956 | n.s. | green |
| Tlr5 | inflammation | F1,14 = 13.7, P = 0.00237 | F1,14 = 10.68, P = 0.00561 | n.s. | green |
| Akp3 | inflammation | F1,14 = 24.75, P = 0.000204 | F1,14 = 12.93, P = 0.00293 | n.s. | green |
| Nox1 | oxidative stress | F1,14 = 29.38, P = 9.02E-05 | F1,14 = 12.36, P = 0.00343 | n.s. | green |
| Nfil3 | clock and clock-controlled genes | F1,14 = 36.41, P = 3.07E-05 | F1,14 = 10.29, P = 0.00632 | n.s. | green |
| Tlr2 | inflammation | F1,14 = 18.58, P = 0.000718 | F1,14 = 8.78, P = 0.0103 | n.s. | green |
| Hnf1a | clock and clock-controlled genes | F1,14 = 8.04, P = 0.0132 | F1,14 = 5.1, P = 0.0403 | n.s. | green |
| Il10 | inflammation | F1,14 = 21.07, P = 0.00042 | F1,14 = 9.42, P = 0.00832 | n.s. | green |
| Nr1h4 | metabolism | F1,14 = 4.78, P = 0.0463 | n.s. | n.s. | green |
| Fos | brain-gut axis | F1,14 = 8.91, P = 0.00984 | F1,14 = 10.94, P = 0.00518 | n.s. | green |
| Npas2 | clock and clock-controlled genes | F1,14 = 5.07, P = 0.0409 | n.s. | n.s. | green |
| Cyp2e1 | oxidative stress | F1,14 = 12.16, P = 0.00362 | F1,14 = 9.26, P = 0.00877 | F1,14 = 4.66, P = 0.0487 | green |
| Tnf | inflammation | F1,14 = 8.02, P = 0.0133 | F1,14 = 5.85, P = 0.0298 | n.s. | green |
| Il1b | inflammation | n.s. | F1,14 = 7.2, P = 0.0179 | n.s. | green |
| Cry1 | clock and clock-controlled genes | n.s. | F1,14 = 16.52, P = 0.00116 | n.s. | green |
| Cyp7a1 | metabolism | F1,14 = 5.84, P = 0.0299 | F1,14 = 7.19, P = 0.0179 | F1,14 = 6.71, P = 0.0214 | green |
| Gpx2 | oxidative stress | n.s. | F1,14 = 5.66, P = 0.0321 | n.s. | green |
| Tgfb1 | cancer | n.s. | F1,14 = 11.5, P = 0.00439 | n.s. | green |
| Nr1h3 | metabolism | F1,14 = 6.01, P = 0.028 | F1,14 = 32.14, P = 5.79E-05 | n.s. | green |
| Il6 | inflammation | n.s. | F1,14 = 33.53, P = 4.68E-05 | n.s. | green |
| Srebf1 | metabolism | n.s. | F1,14 = 7.03, P = 0.019 | n.s. | green |
| Nos2 | oxidative stress | F1,14 = 4.9, P = 0.0439 | n.s. | n.s. | green |
| Arntl | clock and clock-controlled genes | F1,14 = 11.51, P = 0.00437 | n.s. | n.s. | green |
| Ptgs2 | inflammation | F1,14 = 12.17, P = 0.00362 | F1,14 = 5.06, P = 0.0412 | n.s. | green |
Figure 1. Hippocampal gene expression levels in wild-type (WT) and Clock mutant (C) mice on either an alcohol (A) or dextrose-containing control (D) diet.

Expression levels of genes exhibiting significant changes in the hippocampus for at least one term (genotype, alcohol or genotype by alcohol interaction) were normalized as Z scores and plotted as a heatmap. Genes with similar expression patterns were grouped into clusters, depicted by colors on the left side of the graph. The orange cluster reflects groups of genes influenced by genotype. The blue cluster includes genes affected by diet. The pink cluster contains a single gene, Vip, that is characterized by a genotype by diet interaction. The green cluster contains genes affected by genotype as well as alcohol. Cluster color was assigned independently and randomly in each tissue, thus there is no implied association between clusters of the same color in different tissues. Gene symbols are listed on the right side. There were four experimental groups: wild-type dextrose (WTD), wild-type alcohol (WTA), Clock mutant dextrose (CD) and Clock mutant alcohol (CA). Each column represents an individual mouse, denoted by the ID number listed after the experimental group designation. Within the heatmap, green indicates increased expression and red indicates reduced expression, with color intensity reflecting the magnitude of the expression change.
Genotype
Genes in the orange cluster were predominantly influenced by genotype. This cluster includes 18 genes, the expression levels of which were lower in Clock mutants compared to wild-type. Notably, several of these genes (i.e., Per1, Per2, Per3 and Cry2, among others) are targets of the transactivating CLOCK-ARTNL dimer, perhaps revealing reduced activation of expression by the mutated Clock gene. Another gene in this cluster is Clock itself, as its expression is affected by the genotype at the Clock locus.
Diet
The blue cluster was small, containing only two genes: Tlr4 and Cxcl1. Alcohol led to increased expression of both of these genes in the hippocampus.
Genotype*Diet
The pink cluster contained a single gene, Vip, and was characterized by a significant genotype by diet interaction. The green cluster was largest in the hippocampus, consisting of 35 genes. The majority of these genes were affected by both genotype and diet. Highest expression levels were typically observed in the alcohol-fed Clock mutant mice compared to all other experimental groups. Expression of the Cyp2e1 gene, which encodes an enzyme important for the metabolism of alcohol, was influenced by a genotype by alcohol interaction, in addition to significant effects of both genotype and diet alone. This increase in Cyp2e1 may be related to alcohol-induced changes in other circadian genes, as we have previously shown in the intestine (Forsyth et al., 2011). Among the entire set of 75 genes examined, 20 were selected because of a functional role in the regulation of inflammation. Twelve of these 20 genes (60%) were significantly altered in the hippocampus and grouped together into the green cluster, with increased expression in alcohol-fed Clock mutants, suggesting a trend for enrichment of inflammation-related genes in this cluster (odds ratio=2.066, P=0.128, Fisher's exact test). A high proportion of the genes involved in metabolism grouped in the green cluster as well, with 8 of 12 selected metabolism-related genes (67%) being present in this cluster (odds ratio=2.632, P=0.115, Fisher's exact test).
Liver
Fewer genes (22 in total) significantly varied across experimental groups in the liver (Table 3), compared to 56 in the hippocampus (Table 2) and 30 in the proximal colon (Table 4). In the liver, those genes with significant expression changes grouped into five clusters (i.e., cyan, green, blue, orange and pink; Table 3, Figure 2).
Table 3. Genes that varied significantly across experimental groups in the liver.
Genes are grouped into clusters, as shown in Figure 2.
| Gene Symbol | Functional Category | 2-way ANOVA | Clusters | ||
|---|---|---|---|---|---|
|
| |||||
| Genotype | Diet | G × D interaction | |||
| Ccnd1 | cancer | n.s. | F1,13 = 6.16, P = 0.0275 | n.s. | cyan |
| Hmgb1 | inflammation | n.s. | F1,13 = 4.72, P = 0.0488 | n.s. | cyan |
| Per3 | clock and clock-controlled genes | F1,13 = 41.56, P = 2.18E-05 | n.s. | n.s. | green |
| Dbp | clock and clock-controlled genes | F1,13 = 76.41, P = 8.37E-07 | n.s. | n.s. | green |
| Tef | clock and clock-controlled genes | F1,13 = 80.18, P = 6.38E-07 | n.s. | n.s. | green |
| Per2 | clock and clock-controlled genes | F1,13 = 10.5, P = 0.00644 | n.s. | n.s. | green |
| Per1 | clock and clock-controlled genes | F1,13 = 18.04, P = 0.000953 | n.s. | n.s. | green |
| Nampt | clock and clock-controlled genes | F1,13 = 17.32, P = 0.00112 | n.s. | n.s. | green |
| Nr1d1 | clock and clock-controlled genes | F1,13 = 27.48, P = 0.000159 | n.s. | n.s. | green |
| Cry2 | clock and clock-controlled genes | F1,13 = 8.03, P = 0.0141 | n.s. | n.s. | green |
| Cdh1 | cell-junction and epithelial permeability | F1,13 = 9.54, P = 0.00862 | n.s. | n.s. | green |
| Clock | clock and clock-controlled genes | F1,13 = 10.05, P = 0.00738 | n.s. | n.s. | green |
| Nos2 | oxidative stress | n.s. | n.s. | F1,13 = 5.76, P = 0.0321 | blue |
| Nfil3 | clock and clock-controlled genes | F1,13 = 62.1, P = 2.64E-06 | n.s. | n.s. | orange |
| Arntl | clock and clock-controlled genes | F1,13 = 25.47, P = 0.000224 | n.s. | n.s. | orange |
| Cry1 | clock and clock-controlled genes | F1,13 = 127.62, P = 4.3E-08 | n.s. | n.s. | orange |
| Pde4b | inflammation | F1,13 = 6.57, P = 0.0236 | n.s. | n.s. | orange |
| Cldn1 | cell-junction and epithelial permeability | n.s. | n.s. | F1,13 = 6.02, P = 0.029 | orange |
| Pparg | metabolism | F1,13 = 7.91, P = 0.0147 | n.s. | n.s. | orange |
| Tlr5 | inflammation | F1,13 = 8.24, P = 0.0131 | n.s. | n.s. | orange |
| Creb1 | clock and clock-controlled genes | F1,13 = 4.89, P = 0.0456 | n.s. | n.s. | orange |
| Hnf4a | clock and clock-controlled genes | n.s. | F1,13 = 5.17, P = 0.0406 | n.s. | pink |
Table 4. Genes that varied significantly across experimental groups in the proximal colon.
Genes are grouped into clusters, as shown in Figure 3.
| Gene Symbol | Functional Category | 2-way ANOVA | Clusters | ||
|---|---|---|---|---|---|
|
| |||||
| Genotype | Diet | G × D interaction | |||
| Rela | inflammation | F1,16 = 7.01, P = 0.0176 | n.s. | n.s. | cyan |
| Vip | brain-gut axis | F1,16 = 6.9, P = 0.0183 | n.s. | n.s. | cyan |
| Nox1 | oxidative stress | F1,16 = 12.18, P = 0.00303 | n.s. | n.s. | cyan |
| Srebf1 | metabolism | F1,16 = 20.28, P = 0.000361 | n.s. | n.s. | cyan |
| Mmp9 | cancer | F1,16 = 8.8, P = 0.00909 | n.s. | n.s. | cyan |
| Tnf | inflammation | F1,16 = 9.83, P = 0.00639 | F1,16 = 7.84, P = 0.0128 | F1,16 = 4.73, P = 0.045 | orange |
| Cxcl10 | inflammation | F1,16 = 5.95, P = 0.0268 | F1,16 = 5.61, P = 0.0308 | n.s. | orange |
| Fos | brain-gut axis | F1,16 = 4.53, P = 0.0493 | n.s. | n.s. | green |
| Cry1 | clock and clock-controlled genes | F1,16 = 16.25, P = 0.000967 | n.s. | n.s. | green |
| Prkcd | metabolism | F1,16 = 9.03, P = 0.00838 | F1,16 = 4.87, P = 0.0423 | n.s. | green |
| Hif1a | cancer | F1,16 = 7.75, P = 0.0133 | n.s. | n.s. | green |
| Cldn1 | cell-junction and epithelial permeability | F1,16 = 6.26, P = 0.0235 | n.s. | n.s. | green |
| Ctnnb1 | cancer | F1,16 = 6.03, P = 0.0259 | n.s. | F1,16 = 4.84, P = 0.0429 | purple |
| Cdh1 | cell-junction and epithelial permeability | F1,16 = 12.03, P = 0.00316 | n.s. | n.s. | purple |
| Hmgcr | metabolism | F1,16 = 11.48, P = 0.00375 | n.s. | n.s. | purple |
| Nfil3 | clock and clock-controlled genes | F1,16 = 16.76, P = 0.000848 | n.s. | n.s. | purple |
| Arntl | clock and clock-controlled genes | F1,16 = 110.22, P = 1.39E-08 | n.s. | n.s. | purple |
| Hnf1a | clock and clock-controlled genes | n.s. | n.s. | F1,16 = 12.02, P = 0.00318 | pink |
| Ocln | cell-junction and epithelial permeability | n.s. | n.s. | F1,16 = 5.51, P = 0.0321 | pink |
| Il17a | inflammation | n.s. | n.s. | F1,16 = 5.53, P = 0.0318 | yellow |
| Lep | metabolism | n.s. | n.s. | F1,16 = 5.22, P = 0.0363 | yellow |
| Cxcl1 | inflammation | n.s. | n.s. | F1,16 = 4.53, P = 0.0492 | yellow |
| Akp3 | inflammation | n.s. | F1,16 = 8.79, P = 0.00912 | n.s. | yellow |
| Clock | clock and clock-controlled genes | F1,16 = 9.37, P = 0.00746 | n.s. | n.s. | yellow |
| Ccl2 | Inflammation | n.s. | n.s. | F1,16 = 4.6, P = 0.0477 | yellow |
| Per3 | clock and clock-controlled genes | F1,16 = 17.39, P = 0.000722 | n.s. | n.s. | blue |
| Dbp | clock and clock-controlled genes | F1,16 = 23.98, P = 0.000161 | n.s. | n.s. | blue |
| Tef | clock and clock-controlled genes | F1,16 = 17.54, P = 0.000696 | n.s. | n.s. | blue |
| Cry2 | clock and clock-controlled genes | F1,16 = 18.4, P = 0.000562 | n.s. | n.s. | blue |
| Nr1d1 | clock and clock-controlled genes | F1,16 = 28.07, P = 7.22E-05 | n.s. | n.s. | blue |
Figure 2. Liver gene expression levels in wild-type (WT) and Clock mutant (C) mice on either an alcohol (A) or dextrose-containing control (D) diet.

Expression levels of genes exhibiting significant changes for at least one term (genotype, alcohol or genotype by alcohol interaction) in the liver were normalized as Z scores and plotted as a heatmap. Genes with similar expression patterns were grouped into clusters, depicted by colors on the left side of the graph. The green and orange clusters include genes influenced by genotype. The pink and cyan clusters include genes affected by diet. The blue cluster contains a single gene influenced by a genotype by diet interaction (Nos2). Cluster color was assigned independently and randomly in each tissue, thus there is no implied association between clusters of the same color in different tissues. Gene symbols are listed on the right side. There were four experimental groups: wild-type dextrose (WTD), wild-type alcohol (WTA), Clock mutant dextrose (CD) and Clock mutant alcohol (CA). Each column represents an individual mouse, denoted by the ID number listed after the experimental group designation. Within the heatmap, green indicates increased expression and red indicates reduced expression, with color intensity reflecting the magnitude of the expression change.
Genotype
Genes significantly influenced by genotype grouped into two clusters, with opposing directions of impact. In the green cluster, nine circadian clock genes or CCGs (including the Pers, Tef, Dbp and Nampt), as well as one cell-cell junction related gene (Cdh1), were decreased in Clock mutant mice, while in the orange cluster four other clock genes or CCGs (including Arntl and Cry1), two inflammation genes (Pde4b and Tlr5), one metabolism gene (Pparg) and one cell-cell junction related gene (Cldn1) were increased.
Diet
Both genes in the cyan cluster and the only gene in the pink cluster were significantly affected by alcohol, although the direction of the effect differed: in the pink cluster, alcohol resulted in increased expression of the circadian clock controlled gene Hnf4a, whereas it decreased expression of the inflammation-related gene Hmgb1 and the cancer-related gene Ccnd1 (cyan cluster).
Genotype*Diet
The blue cluster contained only the oxidative stress-related gene, Nos2. Its expression was significantly affected by a genotype by alcohol interaction: expression levels increased in wild-type mice with alcohol, but decreased in alcohol-fed Clock mutants.
Proximal Colon
A total of 30 genes were significantly affected by genotype, diet and/or the interaction between the two in the proximal colon (Table 4). These genes grouped into seven clusters (i.e., cyan, orange, green, purple, pink, yellow and blue; Table 4, Figure 3), which revealed distinct effects on gene expression by alcohol and the Clock mutation.
Figure 3. Proximal colon expression levels in wild-type (WT) and Clock mutant (C) mice on either an alcohol (A) or dextrose-containing control (D) diet.

Expression levels of genes exhibiting significant changes for at least one term (genotype, alcohol or genotype by alcohol interaction) in the proximal colon were normalized as Z scores and plotted as a heatmap. Genes with similar expression patterns were grouped into clusters, depicted by colors on the left side of the graph. The cyan, blue, green and purple clusters contain genes influenced by genotype. The orange cluster includes genes significantly affected by diet. The pink, orange and yellow clusters contain genes impacted by a genotype by alcohol interaction. Cluster color was assigned independently and randomly in each tissue, thus there is no implied association between clusters of the same color in different tissues. Gene symbols are listed on the right side. There were four experimental groups: wild-type dextrose (WTD), wild-type alcohol (WTA), Clock mutant dextrose (CD) and Clock mutant alcohol (CA). Each column represents an individual mouse, denoted by the ID number listed after the experimental group designation. Within the heatmap, green indicates increased expression and red indicates reduced expression, with color intensity reflecting the magnitude of the expression change.
Genotype
Genes in the cyan, green and purple clusters contained high proportions of genes affected by genotype, with higher expression levels in Clock mutants, regardless of diet. These three clusters include genes belonging to several functional groups, including metabolism (Srebf1 and Prkcd), cell division/cancer (Mmp9), oxidative stress (Nox1), brain-gut axis (Vip) and cell-cell junction and epithelial permeability (Cldn1 and Cdh1). The blue cluster, which included five genes, showed a significant genotype effect in the opposite direction, with low expression levels in Clock mutants regardless of diet. All of the genes in this cluster are under direct control of the CLOCK-ARNTL transcriptional machinery.
Diet
Only four genes were significantly affected by alcohol, including two inflammation-related genes from the orange cluster (Tnf and Cxcl10), one metabolism gene from the green cluster (Prkcd) and one inflammation-related gene from the yellow cluster (Akp3).
Genotype*Diet
Several genes in the orange, pink and yellow clusters exhibited complex responses to alcohol and the Clock mutation, with a high proportion being significantly affected by a genotype by alcohol interaction. For the pink cluster, higher expression levels tended to be present in the alcohol-fed Clock mutants, whereas in the orange and yellow clusters lower levels were observed.
The two genes of the pink cluster exhibited a significant genotype by alcohol interaction. Hnf1a belongs to the circadian clock/circadian clock controlled gene category and Ocln is an epithelial permeability-related gene. Expression levels were reduced by alcohol in wild-type mice and increased by alcohol in Clock mutants.
Four of the six genes in the yellow cluster were significantly affected by a genotype by alcohol interaction. These genes belong to the functional categories of inflammation (Il17a, Cxcl1 and Ccl2) and metabolism (Lep). Generally, expression was slightly increased by alcohol in the wild-type mice but reduced by alcohol in Clock mutants. The two remaining genes in the yellow cluster include an inflammation-related gene that was significantly affected by diet (Akp3) and the circadian gene Clock, which was significantly affected by genotype, indicating cis regulation of expression at the Clock locus.
Both genes in the orange cluster, which are inflammation-related genes, were affected by genotype alone and by diet alone. In addition, the gene Tnf was affected by a genotype by alcohol interaction: expression levels were not affected by alcohol in wild-type mice, but alcohol led to reduced expression in the Clock mutants.
RT-PCR Validation
In order to validate results obtained from the analysis of the array expression data, we performed RT-PCR on Tlr9 in the hippocampus, Tlr5 in the liver and Cdh1 in the proximal colon. In each tissue, expression patterns in different groups observed with RT-PCR generally matched those detected by the array (i.e., the directions of expression changes between groups in the RT-PCR data were consistent with those observed in the analysis of the array data). Although the directions of expression patterns seen in the RT-PCR studies were qualitatively similar to those of the array, the differences between groups failed to reach statistical significance, likely due to the small number of samples available for validation studies (Supporting Information Online).
Discussion
Alterations in expression levels attributed to genotype (i.e., Clock mutant vs. wild-type), alcohol (i.e., alcohol vs. dextrose control) and/or a genotype by alcohol interaction were observed in all three tissues, with differing patterns of effect and little overlap observed in each (Figure 4). Of the 75 genes examined, 38 were significantly altered by alcohol in at least one tissue. None of these genes were altered in three tissues simultaneously, and only two were shared across more than one tissue: Tnf and Cxcl10 were both significantly affected in the hippocampus and proximal colon (Figure 4A). A total of 56 genes were significantly altered by the Clock mutation in at least one tissue. Eight genes, all of which are involved in the regulation of circadian rhythms or of rhythmic gene expression, were affected in all three tissues and 16 of the remaining 48 genes were affected in two tissues (Figure 4B). Thus, only 43% (24/56) of the genes significantly affected by the mutation were affected in multiple tissues despite the presence of the mutation in all cells and tissues of the body.
Figure 4. Alcohol (A) and the circadian ClockΔ19 mutation (B) exert tissue-specific effects on gene expression in the mouse hippocampus, liver and proximal colon.
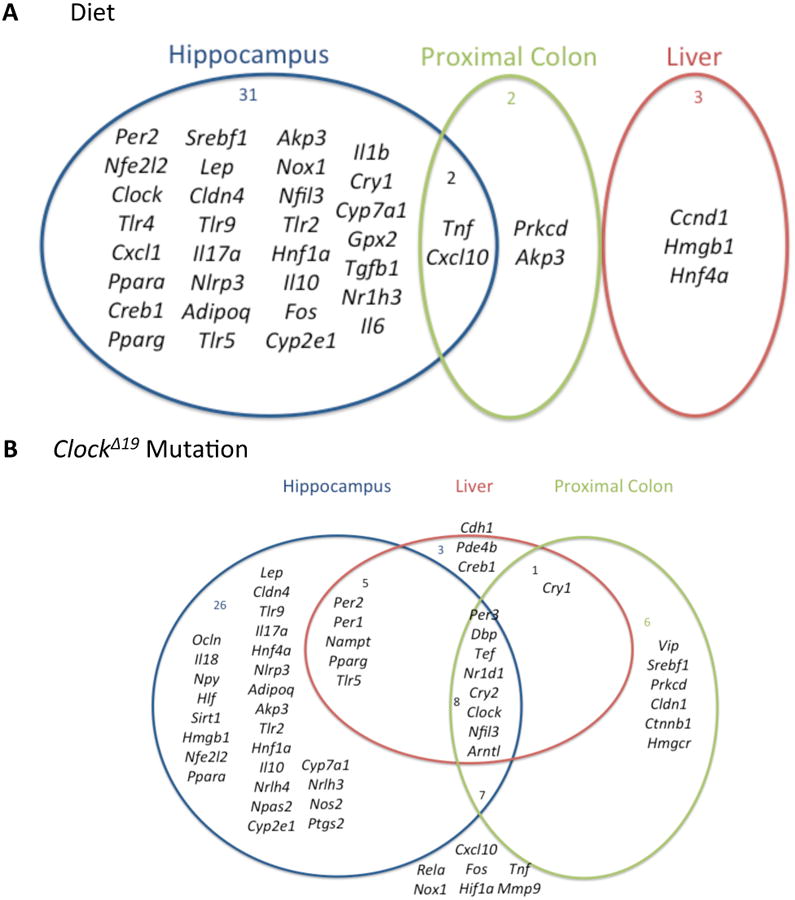
(A) Venn diagram listing genes significantly affected by alcohol in the hippocampus (blue circle), liver (red circle) and proximal colon (green circle) in this study. There was very little overlap of significantly affected genes across tissues. (B) Venn diagram listing genes significantly affected by the circadian ClockΔ19 mutation in the hippocampus (blue circle), liver (red circle) and proximal colon (green circle) in this study.
Interestingly, there were no genes significantly affected by alcohol in more all three tissues simultaneously and only two were affected in more than one tissue, which suggests that tissues exhibit distinct gene expression response patterns in the presence of alcohol, at least with respect to the genes analyzed in the present study. In contrast, several genes involved or associated with circadian rhythms were significantly affected by the Clock mutation in multiple tissues, which supports a molecular circadian clock mechanism that is conserved across tissues, although we do note that the majority of genes examined did exhibit tissue-specificity. Such prominent tissue-specific responses to alcohol and, to a lesser degree, circadian disruption, at least in the case of the Clock mutation, may contribute to tissue-specific susceptibility to alcohol toxicity.
In the present study, the hippocampus contained the most genes significantly affected by alcohol, compared to liver and proximal colon, and genes in all categories (circadian rhythms, metabolism, oxidative stress, inflammation, brain-gut axis, cell division/cancer, cell-cell junction and intestinal permeability) were affected. The master circadian clock in the suprachiasmatic nucleus (SCN) of the hypothalamus was not examined because SCN expression responses to alcohol have been studied previously (Filiano et al., 2013) and the primary purpose of the current study was to determine whether expression changes and/or genetic clock disruption in different tissues contribute to alcohol toxicity, not to assess the impact of alcohol on the central circadian timekeeping system. Interestingly, a large proportion of the genes (the green cluster) were significantly affected by both genotype and alcohol in the hippocampus. A high proportion of the genes involved in inflammation and metabolism present on the array were present in this cluster (60% and 67%, respectively), suggesting that the circadian clock and alcohol combine to influence the regulation of inflammatory and metabolic gene expression in the hippocampus.
Given recent evidence linking neuroinflammation to alcohol-induced cognitive dysfunction and brain damage (Kelley and Dantzer, 2011), our results suggest that disruption of circadian rhythms may contribute to the development of cognitive impairment and neurological damage associated with chronic alcoholism through up-regulation of proinflammatory and metabolic gene expression. Furthermore, the alcohol-metabolizing enzyme Cyp2e1, which contributes to the generation of reactive oxygen species (ROS), is significantly affected by a genotype by alcohol interaction, with the highest expression levels observed in Clock mutants on the alcohol-containing diet. This implies that the combination of genetic circadian disruption and chronic alcohol exposure interacts to activate Cyp2e1 expression, which may promote or exacerbate pathological transformation through increased oxidative stress burden.
The fewest number of significantly affected genes were observed in the liver, as compared to the hippocampus and proximal colon. Of these, the majority belonged to the functional group of circadian clock and clock-controlled genes, and most were significantly affected by genotype (Table 3). These results suggest a particularly strong role for the circadian clock in regulating gene expression in the liver, which is known to exhibit robust rhythms of gene expression and physiology (Hughes et al., 2009, Lamia et al., 2008). Indeed, it has been reported that diurnal rhythms of expression of core circadian clock genes and certain metabolic genes are altered in mice exposed to a chronic alcohol consumption protocol (Filiano et al., 2013).
There are several potential reasons that we did not observe greater differential expression in the liver, including: the number and specific functions of genes included in the assay, the duration of the experimental protocol, the possible effects of feeding rhythms on liver gene expression (Vollmers et al., 2009), especially considering the observed changes in diurnal activity rhythms we observed in the present study (Supporting Information), the limitation of gene expression analysis to a single time point and considerations regarding how gene expression changes translate into changes in protein level or function. Interestingly, bone marrow-derived macrophages (BMDMs) from Clock mutant mice are less responsive to LPS or TNF and exhibit reduced expression of inflammatory, metabolic and circadian genes (Bellet et al., 2013). The Clock mutation may suppress gene expression to a relatively large degree in specific cell types and tissues, perhaps explaining, at least in part, the relative lack of robust, significant changes in expression in the liver observed in this study.
The results of the current study and findings described by Bellet et al. (Bellet et al., 2013), may also explain our previously reported finding that alcohol-fed Clock mutant mice failed to exhibit significant liver inflammation or liver cell injury despite increased intestinal permeability and endotoxin levels (Summa et al., 2013). However, these potential limitations seem unlikely to completely explain the findings in the liver because of the significant interaction between alcohol and the circadian clock system in the hippocampus and intestine. To clarify these potential issues, further studies are required to more completely characterize and understand the expression changes in the liver in response to circadian disruption and alcohol.
Within the proximal colon, the majority of genes were significantly affected by genotype. Significantly affected genes belonged to each of functional categories examined (Table 4). The expression of the gene encoding the tight junction protein Ocln (occludin) was decreased by alcohol in wild-type mice, which likely contributes to increased alcohol-induced gut leakiness, as we have shown in these mice (Summa et al., 2013). Another example that may impact intestinal barrier integrity is increased expression of the gene encoding the tight junction protein Cldn1 (claudin-1), which was increased in Clock mutant mice. Cldn1 encodes a tight junction protein that has paradoxically been associated with increases in intestinal permeability (Han et al., 2003, Prasad et al., 2005, Al-Sadi and Ma, 2007), an effect that appears to be cell-type specific and sensitive to certain environmental exposures. We have previously shown that Clock mutant mice have increased intestinal permeability, and these findings suggest that decreased Ocln as well as increased Cldn1 expression may be part of the mechanism underlying this effect. Taken together, our results suggest that interactions between alcohol and the circadian clock are particularly prominent and functionally relevant within the proximal colon, which supports previous in vitro and in vivo evidence linking the circadian clock and alcohol to the regulation of intestinal barrier integrity (Summa et al., 2013, Swanson et al., 2011).
Our results reveal interesting new details regarding the complex biological effects of alcohol on different tissues; however, we recognize certain limitations inherent in our experimental design. Only a single time point (ZT6) was used for gene expression measurement, thus we were unable to determine whether or not changes in expression exist at other times in the diurnal cycle. However, the mean phase angle of entrainment to a 12:12 LD cycle in Clock mutant mice has been shown to be normal with respect to wild-type mice (Vitaterna et al., 1994, Vitaterna et al., 2006), indicating that there is no a priori rationale to test for differences in the phase angle of expression rhythms between wild-type and Clock mutants. While it has been reported that there is increased ethanol preference in a two-bottle choice paradigm and sensitivity to ethanol-induced sedation in Clock mutant mice (Ozburn et al., 2013), suggesting that the Clock mutation contributes to alcohol sensitivity and the regulation of alcohol intake. However, those studies used examined mice with a genetic background (BALB/c coisogenic) than ours (C57BL/6J coisogenic). Differences between these strains in responses to alcohol are well-known (Kakihana et al., 1966). We did not observe any differences in alcohol intake between the Clock mutants and wild-type mice in our studies (Supporting Online Information). This discrepancy may be due, at least in part, to differences in the genetic background of the mutant strains and/or to the specific diet, source of ethanol and experimental protocols used in each respective study.
Another limitation is that the analysis was restricted to the pre-selected set of 75 genes included in the assay, which may therefore overlook other expression changes. We selected these genes based on their potential importance for: (1) the mechanism(s) of alcohol-induced organ pathology, (2) answering specific questions regarding interactions between alcohol consumption and the circadian clock system, and (3) determining if alcohol and/or circadian-induced effects are universal for all tissues or are specific for a given organ or tissue, which may contribute to tissue-specific susceptibility to alcohol toxicity. Thus, our inclusion of the selected 75 genes in the three different organs was appropriate for the aims and scope of the present study. Finally, gene expression does not always directly translate into changes in protein levels or function. Thus, future studies to evaluate the functional consequences of the observed changes in gene expression will be necessary.
In summary, these results facilitate a maturing understanding of the nature of the molecular changes that occur in response to chronic alcohol consumption and disruption of circadian rhythms. In particular, they help fill the gap in our knowledge of how alcohol and circadian clock system interactions contribute to adverse pathological consequences in diverse tissues, they may explain in part why different organs have differential susceptibility to alcohol toxicity and they suggest that disruption of circadian rhythms in the context of chronic alcohol use may be a previously unrecognized, and potentially modifiable, risk factor for the development or progression of alcohol-related pathologies. While these studies utilized a genetic model of circadian disruption, we recently observed similar alcohol-induced physiological responses in the intestine of both Clock mutant and phase-shifted mice (Summa et al., 2013), the latter likely being a more accurate model for humans with disrupted circadian rhythms, suggesting that responses at the level of gene expression may be similar. Strategies designed to limit circadian misalignment or that target the circadian clock to improve organization of circadian rhythms may provide useful approaches for the prevention and/or mitigation of alcohol-related pathologies. This study provides strong scientific rationale to study the efficacy of circadian clock-directed interventions, such as chronotherapy, for the prevention and/or treatment of alcohol-related pathologies.
Supplementary Material
Acknowledgments
Support: This work was supported by the National Institutes of Health (award R01 AA020216 to AK and FWT, with support for CBF and RMV). KCS was supported in part by the National Center for Research Resources (NCRR) and the National Center for Advancing Translational Sciences (NCATS) at the National Institutes of Health through a Northwestern University Clinical and Translational Sciences Institute Predoctoral Training Grant (8UL1TR000150). KCS and KF also received support from a National Institutes of Health Training Grant (award T32 HL007909 to FWT).
References
- Al-Sadi RM, Ma TY. IL-1beta causes an increase in intestinal epithelial tight junction permeability. Journal of immunology. 2007;178:4641–4649. doi: 10.4049/jimmunol.178.7.4641. [DOI] [PMC free article] [PubMed] [Google Scholar]
- Bellet MM, Deriu E, Liu JZ, Grimaldi B, Blaschitz C, Zeller M, Edwards RA, Sahar S, Dandekar S, Baldi P, George MD, Raffatellu M, Sassone-Corsi P. Circadian clock regulates the host response to Salmonella. Proceedings of the National Academy of Sciences of the United States of America. 2013;110:9897–9902. doi: 10.1073/pnas.1120636110. [DOI] [PMC free article] [PubMed] [Google Scholar]
- Brager AJ, Prosser RA, Glass JD. Circadian and acamprosate modulation of elevated ethanol drinking in mPer2 clock gene mutant mice. Chronobiol Int. 2011a;28:664–672. doi: 10.3109/07420528.2011.601968. [DOI] [PMC free article] [PubMed] [Google Scholar]
- Brager AJ, Ruby CL, Prosser RA, Glass JD. Chronic ethanol disrupts circadian photic entrainment and daily locomotor activity in the mouse. Alcoholism, clinical and experimental research. 2010;34:1266–1273. doi: 10.1111/j.1530-0277.2010.01204.x. [DOI] [PMC free article] [PubMed] [Google Scholar]
- Brager AJ, Ruby CL, Prosser RA, Glass JD. Acute ethanol disrupts photic and serotonergic circadian clock phase-resetting in the mouse. Alcoholism, clinical and experimental research. 2011b;35:1467–1474. doi: 10.1111/j.1530-0277.2011.01483.x. [DOI] [PMC free article] [PubMed] [Google Scholar]
- Castanon-Cervantes O, Wu M, Ehlen JC, Paul K, Gamble KL, Johnson RL, Besing RC, Menaker M, Gewirtz AT, Davidson AJ. Dysregulation of inflammatory responses by chronic circadian disruption. Journal of immunology. 2010;185:5796–5805. doi: 10.4049/jimmunol.1001026. [DOI] [PMC free article] [PubMed] [Google Scholar]
- Chen CP, Kuhn P, Advis JP, Sarkar DK. Chronic ethanol consumption impairs the circadian rhythm of pro-opiomelanocortin and period genes mRNA expression in the hypothalamus of the male rat. J Neurochem. 2004;88:1547–1554. doi: 10.1046/j.1471-4159.2003.02300.x. [DOI] [PubMed] [Google Scholar]
- Filiano AN, Millender-Swain T, Johnson R, Jr, Young ME, Gamble KL, Bailey SM. Chronic ethanol consumption disrupts the core molecular clock and diurnal rhythms of metabolic genes in the liver without affecting the suprachiasmatic nucleus. PLoS One. 2013;8:e71684. doi: 10.1371/journal.pone.0071684. [DOI] [PMC free article] [PubMed] [Google Scholar]
- Forsyth CB, Tang Y, Shaikh M, Zhang L, Keshavarzian A. Role of snail activation in alcohol-induced iNOS-mediated disruption of intestinal epithelial cell permeability. Alcoholism, clinical and experimental research. 2011;35:1635–1643. doi: 10.1111/j.1530-0277.2011.01510.x. [DOI] [PMC free article] [PubMed] [Google Scholar]
- Gao B, Bataller R. Alcoholic liver disease: pathogenesis and new therapeutic targets. Gastroenterology. 2011;141:1572–1585. doi: 10.1053/j.gastro.2011.09.002. [DOI] [PMC free article] [PubMed] [Google Scholar]
- Grant BF, Dufour MC, Harford TC. Epidemiology of alcoholic liver disease. Seminars in liver disease. 1988;8:12–25. doi: 10.1055/s-2008-1040525. [DOI] [PubMed] [Google Scholar]
- Han X, Fink MP, Delude RL. Proinflammatory cytokines cause NO*-dependent and -independent changes in expression and localization of tight junction proteins in intestinal epithelial cells. Shock. 2003;19:229–237. doi: 10.1097/00024382-200303000-00006. [DOI] [PubMed] [Google Scholar]
- Hughes ME, DiTacchio L, Hayes KR, Vollmers C, Pulivarthy S, Baggs JE, Panda S, Hogenesch JB. Harmonics of circadian gene transcription in mammals. PLoS Genet. 2009;5:e1000442. doi: 10.1371/journal.pgen.1000442. [DOI] [PMC free article] [PubMed] [Google Scholar]
- Kakihana R, Brown DR, McClearn GE, Tabershaw IR. Brain sensitivity to alcohol in inbred mouse strains. Science. 1966;154:1574–1575. doi: 10.1126/science.154.3756.1574. [DOI] [PubMed] [Google Scholar]
- Kelley KW, Dantzer R. Alcoholism and inflammation: neuroimmunology of behavioral and mood disorders. Brain Behav Immun. 2011;25(Suppl 1):S13–20. doi: 10.1016/j.bbi.2010.12.013. [DOI] [PMC free article] [PubMed] [Google Scholar]
- Keshavarzian A, Holmes EW, Patel M, Iber F, Fields JZ, Pethkar S. Leaky gut in alcoholic cirrhosis: a possible mechanism for alcohol-induced liver damage. Am J Gastroenterol. 1999;94:200–207. doi: 10.1111/j.1572-0241.1999.00797.x. [DOI] [PubMed] [Google Scholar]
- King DP, Vitaterna MH, Chang AM, Dove WF, Pinto LH, Turek FW, Takahashi JS. The mouse Clock mutation behaves as an antimorph and maps within the W19H deletion, distal of Kit. Genetics. 1997a;146:1049–1060. doi: 10.1093/genetics/146.3.1049. [DOI] [PMC free article] [PubMed] [Google Scholar]
- King DP, Zhao Y, Sangoram AM, Wilsbacher LD, Tanaka M, Antoch MP, Steeves TD, Vitaterna MH, Kornhauser JM, Lowrey PL, Turek FW, Takahashi JS. Positional cloning of the mouse circadian clock gene. Cell. 1997b;89:641–653. doi: 10.1016/s0092-8674(00)80245-7. [DOI] [PMC free article] [PubMed] [Google Scholar]
- Lamia KA, Storch KF, Weitz CJ. Physiological significance of a peripheral tissue circadian clock. Proceedings of the National Academy of Sciences of the United States of America. 2008;105:15172–15177. doi: 10.1073/pnas.0806717105. [DOI] [PMC free article] [PubMed] [Google Scholar]
- Miller BH, McDearmon EL, Panda S, Hayes KR, Zhang J, Andrews JL, Antoch MP, Walker JR, Esser KA, Hogenesch JB, Takahashi JS. Circadian and CLOCK-controlled regulation of the mouse transcriptome and cell proliferation. Proc Natl Acad Sci U S A. 2007;104:3342–3347. doi: 10.1073/pnas.0611724104. [DOI] [PMC free article] [PubMed] [Google Scholar]
- Nanji AA, Zhao S, Sadrzadeh SM, Dannenberg AJ, Tahan SR, Waxman DJ. Markedly enhanced cytochrome P450 2E1 induction and lipid peroxidation is associated with severe liver injury in fish oil-ethanol-fed rats. Alcohol Clin Exp Res. 1994;18:1280–1285. doi: 10.1111/j.1530-0277.1994.tb00119.x. [DOI] [PubMed] [Google Scholar]
- Naylor E, Bergmann BM, Krauski K, Zee PC, Takahashi JS, Vitaterna MH, Turek FW. The circadian clock mutation alters sleep homeostasis in the mouse. J Neurosci. 2000;20:8138–8143. doi: 10.1523/JNEUROSCI.20-21-08138.2000. [DOI] [PMC free article] [PubMed] [Google Scholar]
- Ozburn AR, Falcon E, Mukherjee S, Gillman A, Arey R, Spencer S, McClung CA. The role of clock in ethanol-related behaviors. Neuropsychopharmacology: official publication of the American College of Neuropsychopharmacology. 2013;38:2393–2400. doi: 10.1038/npp.2013.138. [DOI] [PMC free article] [PubMed] [Google Scholar]
- Panda S, Antoch MP, Miller BH, Su AI, Schook AB, Straume M, Schultz PG, Kay SA, Takahashi JS, Hogenesch JB. Coordinated transcription of key pathways in the mouse by the circadian clock. Cell. 2002;109:307–320. doi: 10.1016/s0092-8674(02)00722-5. [DOI] [PubMed] [Google Scholar]
- Prasad S, Mingrino R, Kaukinen K, Hayes KL, Powell RM, MacDonald TT, Collins JE. Inflammatory processes have differential effects on claudins 2, 3 and 4 in colonic epithelial cells. Laboratory investigation; a journal of technical methods and pathology. 2005;85:1139–1162. doi: 10.1038/labinvest.3700316. [DOI] [PubMed] [Google Scholar]
- Rosenwasser AM, Fecteau ME, Logan RW. Effects of ethanol intake and ethanol withdrawal on free-running circadian activity rhythms in rats. Physiol Behav. 2005;84:537–542. doi: 10.1016/j.physbeh.2005.01.016. [DOI] [PubMed] [Google Scholar]
- Roybal K, Theobold D, Graham A, DiNieri JA, Russo SJ, Krishnan V, Chakravarty S, Peevey J, Oehrlein N, Birnbaum S, Vitaterna MH, Orsulak P, Takahashi JS, Nestler EJ, Carlezon WA, Jr, McClung CA. Mania-like behavior induced by disruption of CLOCK. Proceedings of the National Academy of Sciences of the United States of America. 2007;104:6406–6411. doi: 10.1073/pnas.0609625104. [DOI] [PMC free article] [PubMed] [Google Scholar]
- Spanagel R, Rosenwasser AM, Schumann G, Sarkar DK. Alcohol consumption and the body's biological clock. Alcoholism, clinical and experimental research. 2005;29:1550–1557. doi: 10.1097/01.alc.0000175074.70807.fd. [DOI] [PubMed] [Google Scholar]
- Storch KF, Lipan O, Leykin I, Viswanathan N, Davis FC, Wong WH, Weitz CJ. Extensive and divergent circadian gene expression in liver and heart. Nature. 2002;417:78–83. doi: 10.1038/nature744. [DOI] [PubMed] [Google Scholar]
- Summa KC, Voigt RM, Forsyth CB, Shaikh M, Cavanaugh K, Tang Y, Vitaterna MH, Song S, Turek FW, Keshavarzian A. Disruption of the Circadian Clock in Mice Increases Intestinal Permeability and Promotes Alcohol-Induced Hepatic Pathology and Inflammation. PloS one. 2013;8:e67102. doi: 10.1371/journal.pone.0067102. [DOI] [PMC free article] [PubMed] [Google Scholar]
- Swanson G, Forsyth CB, Tang Y, Shaikh M, Zhang L, Turek FW, Keshavarzian A. Role of intestinal circadian genes in alcohol-induced gut leakiness. Alcoholism, clinical and experimental research. 2011;35:1305–1314. doi: 10.1111/j.1530-0277.2011.01466.x. [DOI] [PMC free article] [PubMed] [Google Scholar]
- Szabo G, Bala S. Alcoholic liver disease and the gut-liver axis. World journal of gastroenterology: WJG. 2010;16:1321–1329. doi: 10.3748/wjg.v16.i11.1321. [DOI] [PMC free article] [PubMed] [Google Scholar]
- Turek FW, Joshu C, Kohsaka A, Lin E, Ivanova G, McDearmon E, Laposky A, Losee-Olson S, Easton A, Jensen DR, Eckel RH, Takahashi JS, Bass J. Obesity and metabolic syndrome in circadian Clock mutant mice. Science. 2005;308:1043–1045. doi: 10.1126/science.1108750. [DOI] [PMC free article] [PubMed] [Google Scholar]
- Vitaterna MH, King DP, Chang AM, Kornhauser JM, Lowrey PL, McDonald JD, Dove WF, Pinto LH, Turek FW, Takahashi JS. Mutagenesis and mapping of a mouse gene, Clock, essential for circadian behavior. Science. 1994;264:719–725. doi: 10.1126/science.8171325. [DOI] [PMC free article] [PubMed] [Google Scholar]
- Vitaterna MH, Ko CH, Chang AM, Buhr ED, Fruechte EM, Schook A, Antoch MP, Turek FW, Takahashi JS. The mouse Clock mutation reduces circadian pacemaker amplitude and enhances efficacy of resetting stimuli and phase-response curve amplitude. Proceedings of the National Academy of Sciences of the United States of America. 2006;103:9327–9332. doi: 10.1073/pnas.0603601103. [DOI] [PMC free article] [PubMed] [Google Scholar]
- Vollmers C, Gill S, DiTacchio L, Pulivarthy SR, Le HD, Panda S. Time of feeding and the intrinsic circadian clock drive rhythms in hepatic gene expression. Proc Natl Acad Sci U S A. 2009;106:21453–21458. doi: 10.1073/pnas.0909591106. [DOI] [PMC free article] [PubMed] [Google Scholar]
- Wang HJ, Zakhari S, Jung MK. Alcohol, inflammation, and gut-liver-brain interactions in tissue damage and disease development. World journal of gastroenterology: WJG. 2010;16:1304–1313. doi: 10.3748/wjg.v16.i11.1304. [DOI] [PMC free article] [PubMed] [Google Scholar]
Associated Data
This section collects any data citations, data availability statements, or supplementary materials included in this article.