Abstract
Using a simple approach for coding pain severity, the present study describes self-reported pain in U.S. adults. Data are included for 8,781 adults who completed the Functioning and Disability Supplement of the 2012 National Health Interview Survey. An internationally piloted pain severity coding system was used to group participants into 5 discrete ordered pain categories based on their pain persistence (days with pain in last 3 months) and bothersomeness (little, lot, somewhere in between): pain free and categories 1 (low) to 4 (high). It is estimated that 126.1 million adults reported some pain in the previous 3 months, with 25.3 million adults (11.2%) suffering from daily (chronic) pain and 23.4 million (10.3%) reporting a lot of pain. Based on the persistence and bothersomeness of their pain, 14.4 million adults (6.4%) were classified as having the highest level of pain, category 4, with an additional 25.4 million adults (11.3%) experiencing category 3 pain. Individuals with category 3 or 4 pain were likely to have worse health status, to use more health care, and to suffer from more disability than those with less severe pain. Associations were seen between pain severity and selected demographic variables, including race, ethnicity, preferred language, sex, and age.
Perspective
U.S. estimates of pain prevalence are presented using a simple approach for assigning pain severity developed by the Washington Group on Disability Statistics. Concurrent validity is assessed. Although this approach is promising, additional work is required to determine the usefulness of the Washington Group pain categories for pain research or clinical practice.
Keywords: Cross-sectional study, pain frequency, pain severity, language preference, minority groups
“Pain is always subjective”.18 Because there are no objective measures of pain, patient reports are necessarily the primary source of estimates of pain prevalence and severity. Nevertheless, as stated by the Institute of Medicine (IOM),17 “obtaining a definitive picture of the extent and significance of pain is difficult. Current data on the incidence, prevalence and consequences of pain are not consistent or complete, in part because in many cases pain is treated as a symptom and what is collected is data on underlying conditions or events.” The IOM further states: “data weaknesses previously discussed are particularly important when one is examining racial and ethnic disparities.”17
Most available survey data on the prevalence of pain in demographic groups in the U.S. population have focused on the prevalence of chronic or persistent pain (eg, Refs.15,21,23) or health conditions associated with pain (eg, Refs.3,8,35,40). These studies found almost uniformly that whites have higher prevalence rates of chronic pain and painful conditions than minority groups. The picture from surveys that compare pain frequency or intensity across racial/ethnic groups is not so clear: whereas some studies report more pain or greater pain severity in minorities,14,16,28,33 others report less5,21 or no difference.36,37 These surveys differed in the population sampled, the definition of pain, the methods to measure pain frequency and severity, and how minorities groups are combined for the analyses. There are few data on Asians and other nonblack, non-Hispanic minority groups in these analyses. Also absent from this literature are age-specific and sex-specific prevalence rates of pain frequency and severity in minority groups.
Data from the 2012 National Health Interview Survey (NHIS) provide a unique opportunity to develop a broader picture of pain within the U.S. adult population. The 2012 NHIS asked participants about the persistence (frequency) and bothersomeness (intensity) of pain experienced in the previous 3 months. Questions included in the 2012 NHIS allow a graded assessment of pain severity, using methods developed and validated qualitatively by the Washington Group on Disability Statistics.26,27,29,44 Also available in NHIS is information on an extended list of potentially painful health conditions. The complex sampling design of the NHIS allows some confidence in extrapolations to the U.S. adult population, and the survey is of sufficient size to examine differences among subpopulations.
The purpose of this article is 2-fold. First, we present data on the concurrent validity of the Washington Group categories of pain severity. We then use these pain categories to investigate whether there is significant heterogeneity in pain status between whites and minority groups. The data presented here begin to answer the IOM’s17 call for national data “to describe the nature and extent of the [pain] problem” and “to identify subpopulations that will benefit more from future interventions.”
Methods
Population
The data used in this report are from the 2012 NHIS Sample Adult Core and the NHIS Adult Functioning and Disability Supplement (AFD).31 The NHIS is an annual survey of the health of the U.S. civilian, noninstitutionalized population conducted by the National Center for Health Statistics, Centers for Disease Control and Prevention. This in-person survey contains 4 main modules: household, family, sample child, and sample adult. The first 2 modules collect health and sociodemographic information on each member of all families residing within a sampled household. Within each family, additional information is collected from 1 randomly selected adult (the sample adult) aged 18 years or older. Bilingual interviewers or interpreters were recruited to interview all respondents who preferred the use of a language other than English. A Spanish language version is available for participants who prefer speaking in Spanish. The survey uses a multistage clustered sample design and over-samples black, Asian, and Hispanic populations. When combined with sampling weights derived from the Centers for Disease Control and Prevention, this design allows accurate extrapolation of findings to the civilian, noninstitutionalized U.S. adult population.
For the 2012 interview sample, there were 42,366 households, consisting of 108,131 persons in 43,345 families. The total household response rate was 77.6%. From the households interviewed, 34,525 adults completed interviews, resulting in an overall sample adult response rate of 79.7%. Approximately one-quarter of sampled adults were randomly chosen to participate in the AFD supplement. Almost all chosen adults (8,781) completed the supplement, resulting in a 98% supplement response.
The 2012 NHIS was approved by the National Center for Health Statistics Research Ethics Review Board. Verbal consent was obtained from all survey respondents.
Dependent Variable: Assessment of Pain
The AFD collected information on the persistence and bothersomeness of self-reported pain in the previous 3 months. The Washington Group on Disability Statistics, constituted by the United Nations Statistical Commission, developed and validated these questions through cognitive testing and pilot surveys in the United States and internationally.26,27,29,44 Respondents were first asked how often they had pain in the previous 3 months: never, some days, most days, or every day. Data from this question provide estimates of the 3-month persistence (period prevalence) of pain. For those who had pain on at least some days, a follow-up question assessing bothersomeness was asked: “Thinking about the last time you had pain, how much pain did you have - a little, between a little and a lot, or a lot.” Ninety-six percent of AFD participants completed these pain questions. Given this high response rate, no attempt was made to impute missing data. To compare the present data with the literature on the prevalence of chronic pain (defined here as pain for at least half the days in a 6-month period7,32), individuals who reported having pain every day in the previous 3 months were coded as having chronic pain.
For individuals reporting pain at least some days, the Washington Group29 has suggested a coding scheme that combines persistence and bothersomeness of pain to create 4 discrete categories of increasingly severe pain (Table 1). This coding scheme was tested and validated in a number of countries using a variety of qualitative assessments such as cognitive testing.26,27,29,44
Table 1.
Pain Severity Categories Based on Pain Persistence and Bothersomeness
| Category | Pain Persistence (Last 3 Months) | Pain Bothersomeness (Last Time You Had Pain) |
|---|---|---|
| Pain free | No pain in last 3 months | Not applicable |
| Category 1 pain | ||
| Definition | Some days | A little pain |
| Category 2 pain | ||
| Definition 1 | Most or every day | A little pain |
| Or | ||
| Definition 2 | Some days | Between a little and a lot |
| Category 3 pain | ||
| Definition 1 | Some days | A lot |
| Or | ||
| Definition 2 | Most or every day | Between a little and a lot |
| Category 4 pain | ||
| Definition | Most or every day | A lot of pain |
Demographic Variables
Language of Interview, Ethnicity, and Race
Based on self-identified race and ethnicity, and on the language of interview as reported by the interviewers, individuals were codes into 16 discrete categories. Data for the following 7 groups are presented in Table 2: 1) non-Hispanic whites (NHW) who preferred English (reference group); 2) non-Hispanic blacks (NHB) who preferred English; 3) non-Hispanic Asians (NHA) who preferred English; 4) non-Hispanic individuals who did not self-report as white, black, or Asian (“other races” includes those self-reporting as of mixed race) who preferred English; 5) Hispanic whites (HW) who preferred English, 6) NHA who did not prefer English; and 7) HW who did not prefer English. Because of small sample sizes and resulting large variance (greater than 25% of the point estimate), data for other race/ethnic/ language groups are not presented in the tables but were included in the regression models. No Hispanic Asians (any language) were identified in the sample.
Table 2.
Demographic Characteristics of the Study Population
| Sample Population
|
% Reporting Pain†,‡ (Total = 55.7) | SE | ||||
|---|---|---|---|---|---|---|
| N (Total = 8,781) | Weighted N (Millions) (Total = 234.9) | Weighted %* (Total = 100) | SE | |||
| Race, ethnicity, and language of interview | ||||||
| White | ||||||
| Non-Hispanic English | 5,393 | 157.6 | 67.1 | .7 | 59.7 | .9 |
| Black | ||||||
| Non-Hispanic English | 1,290 | 27.7 | 11.8 | .5 | 53.5 | 2.0 |
| Asian | ||||||
| Non-Hispanic English | 497 | 11.7 | 5.0 | .3 | 38.6 | 3.0 |
| Asian | ||||||
| Non-Hispanic Not English | 35 | .7 | .3 | .1 | 29.2 | 9.3 |
| Other race§ | ||||||
| Non-Hispanic English | 89 | 1.7 | .7 | .1 | 59.6 | 7.1 |
| White | ||||||
| Hispanic English | 779 | 19.0 | 8.1 | .4 | 49.3 | 2.3 |
| White | ||||||
| Hispanic Not English | 551 | 13.3 | 5.7 | .4 | 38.4 | 2.6 |
| Sex | ||||||
| Male | 3914 | 113.1 | 48.1 | .7 | 53.3 | 1.0 |
| Female | 4867 | 121.9 | 51.9 | .7 | 57.3 | .9 |
| Age (y) | ||||||
| 18–44 | 3857 | 110.8 | 47.2 | .7 | 46.7 | 1.1 |
| 45–64 | 3037 | 82.1 | 35.0 | .7 | 63.3 | 1.1 |
| 65 or more | 1874 | 42.0 | 17.9 | .5 | 64.7 | 1.5 |
| Number of painful health conditions|| | ||||||
| 0 | 2454 | 70.5 | 30.0 | .7 | 25.1 | 1.1 |
| 1 | 1696 | 46.0 | 19.6 | .5 | 48.0 | 1.5 |
| 2 | 1247 | 33.3 | 14.2 | .5 | 62.2 | 1.8 |
| 3 or 4 | 1753 | 45.2 | 19.2 | .5 | 75.8 | 1.2 |
| 5+ | 1631 | 40.0 | 17.0 | .5 | 90.8 | .9 |
|
| ||||||
| N | Weighted N (Millions) | Weighted %* | SE | % of Those With Pain¶ | SE | |
|
| ||||||
| Pain persistence within last 3 months | ||||||
| None | 3663 | 100.3 | 44.3 | .7 | ||
| Some days | 3258 | 86.6 | 38.3 | .7 | 68.7 | .9 |
| Most days | 553 | 14.0 | 6.2 | .4 | 11.1 | .6 |
| Every day | 992 | 25.5 | 11.1 | .4 | 20.2 | .8 |
| Pain bothersomeness for those reporting pain | ||||||
| A little | 2373 | 62.9 | 27.8 | .6 | 49.9 | .9 |
| Between a little and a lot | 1499 | 39.8 | 17.6 | .5 | 31.6 | .8 |
| A lot | 926 | 23.4 | 10.3 | .4 | 18.6 | .7 |
Column percentage; denominator is the total number of adults. As a result of rounding, in some cases, group percentages do not total 100%.
Defined as pain on at least some days in the last 3 months.
Row percentage; denominator is the number of individuals in each demographic group.
individuals who did not self-report as white, black, or Asian as well as those self-reporting as of mixed race.
The following potentially painful health conditions were included in the count: abdominal pain, arthritis, back pain, fibromyalgia, gout, jaw pain, joint pain or stiffness, knee problems or stiffness, lupus, muscle or bone pain, neck pain, poor circulation in legs, recurring headache, rheumatoid arthritis, sprain or strain, severe headache or migraine, and other types of chronic pain.
Column percentage; denominator is the total number of adults with pain on at least some days in the last 3 months.
Pain prevalence by sex and age is also examined, because these characteristics have previously been shown to be associated with pain prevalence15,21,36–38: Age was coded as 18 to 44 years; 45 to 64 years; and 65 years and older.
Number of Painful Health Conditions
The 2012 NHIS Adult Core included questions on the presence or absence of 17 health conditions frequently associated with acute, recurring, or chronic pain: abdominal pain, arthritis, back pain, fibromyalgia, gout, jaw pain, joint pain or stiffness, knee problems or stiffness, lupus, muscle or bone pain, neck pain, poor circulation in legs, recurring headache, rheumatoid arthritis, sprain or strain, severe headache or migraine, and other types of chronic pain. From this list, we created a 5-level count variable, which had a roughly quintile distribution: none of the conditions; 1, 2, 3, or 4; and 5 or more.
Concurrent Validity
The concurrent (known-group) validity of the Washington Group pain categories was assessed by examining the relationship of these categories to NHIS questions (see later discussion) that are reasonable surrogates for measures of pain dysfunction.7,17,32,41,43
Physical impairment was assessed with the survey question: “Do you have difficulty walking or climbing steps? Would you say no difficulty, some difficulty, a lot of difficulty, or are you unable to do this?” Data from this question were recoded into 2 categories: 1) no or some difficulty; 2) a lot of difficulty or unable to do.
Psychological impairment was addressed with 2 survey questions: 1) “Do you take medication for depression? (Yes, No); 2) “How often do you feel worried, nervous or anxious? Would you say daily, weekly, monthly, a few times a year, or never?” Data from the second question were recoded into 2 categories: 1) less than daily; 2) daily.
Fatigue was assessed with the survey question: “In the past 3 months, how often did you feel very tired or exhausted? Would you say never, some days, most days, or every day?’ Data from this question were recoded into 2 categories: 1) never or some days; 2) most days or every day.
Health-related unemployment was addressed with the survey question: “I am unable to work NOW due to health problem? (Yes, No):
Health-related bed-disability days were assessed with the survey question: “During the PAST 12 MONTHS, ABOUT how many days did illness or injury keep you in bed more than half of the day (include days while an overnight patient in a hospital)? This category was examined both as a continuous variable and as a dichotomous variable (less than 5 days, 5 days or more).
We also examined the association between the Washington Group pain categories and 3 survey questions measuring health care use: 1) “During the past 12 MONTHS did you receive care from doctors or other health care professionals 10 or more times? Do not include telephone calls” (Yes, No); 2) “How many times did you visit a doctor or other health care professional DURING THE LAST 2 WEEKS?”; and 3) DURING THE PAST 12 MONTHS, HOW MANY TIMES have you gone to a HOSPITAL EMERGENCY ROOM about your own health (This includes emergency room visits that resulted in a hospital admission.)?” The data from the latter 2 questions were treated as both continuous and dichotomous variables: 1) fewer than 2 office visits versus 2 or more office visits; 2) fewer than 4 emergency room visits versus 4 or more visits.
We assessed the association of the pain categories with a global measure of self-reported health status: “Would you say your health in general is excellent, very good, good, fair, or poor?” Following normal convention, data were recoded into 2 categories: 1) fair or poor; 2) good, very good, and excellent.
Statistical Analyses
Contingency tables were used to assess associations between the ordinal pain categories and all other variables. One-way analysis of variance with pain category as the classification variable was used to assess the association of pain category with continuous independent variables: number of comorbid painful health conditions; number of bed-days; number of physician visits in the last 2 weeks; and number of emergency room visits. The χ2 test for linear trends (extended Mantel-Haenszel) was used to assess the association between the ordinal pain categories and dichotomous variables. The Z-test was used to compare individual prevalence rates. All estimates were generated using SUDAAN software (version 9.0; Research Triangle Institute, Research Triangle Park, NC). For inferences about the U.S. population, we used the National Center for Health Statistics sampling weights assigned to the AFD.
Results
Table 2 presents selected demographic and health status characteristics of the study population, as well as the proportion of individuals who reported at least some pain in the last 3 months. We found that 44.3% (SE .71) of adults, or 100.3 million individuals, were pain free, whereas 126.1 million adults (55.7%, SE .71) reported some pain in the previous 3 months. We found that females, older individuals, and non-Hispanics were more likely to report any pain, whereas Asians were less likely.
Table 2 also presents the distribution of the adult population according to their response to questions on the persistence and bothersomeness of pain in the previous 3 months. There is a moderate association between pain persistence and bothersomeness (τ-b = .38, χ2(4) = 824.9, P < .001). The scaling differences between having “a lot of pain” and having “somewhere between a little and a lot of pain” disappear in those with pain every day (chronic pain). During the 3 months before the survey, 86.6 million adults had pain on some days, 14 million had pain on most days, and 25.5 million had pain every day and are classified as having chronic pain. Of all adults, 62.9 million reported only a little pain, 23.4 million reported a lot of pain, and 39.8 million reported that their pain fell between a little and a lot. An estimated 10.5 million adults reported a lot of pain every day.
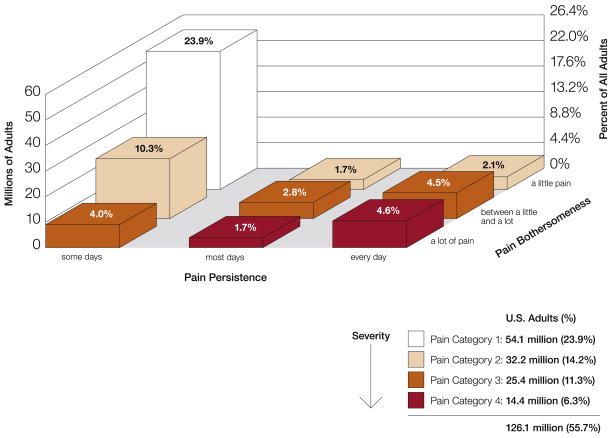
Based on the relationship between pain persistence and bothersomeness (Fig 1), 54.1 million adults (23.9% of all adults, SE .59) would be classified as belonging to pain category 1 (least severe); 32.2 million (14.2%, SE .49) to pain category 2; 25.4 million (11.3%, SE .43) to pain category 3; and 14.4 million (6.3%, SE .36) to pain category 4 (most severe).
Figure 1.
Prevalence of Washington Group pain categories 1 to 4 in the U.S. adult population by pain persistence and bothersomeness.
Concurrent Validity
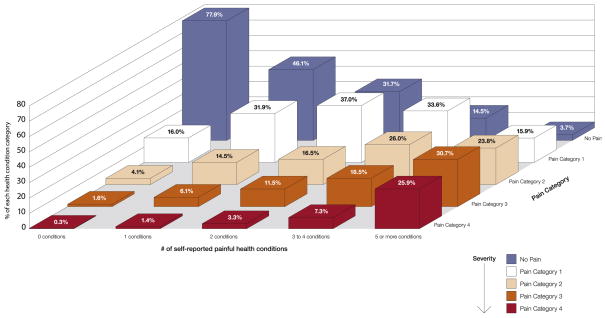
Fig 2 and Table 3 examine the association between the reported number of painful health conditions and the pain categories. The mean number of comorbid health conditions increased from .6 conditions in those with no pain to 6.05 conditions in those with category 4 pain (P < .001). We found that 46% of those with 1 condition did not report any pain in the last 3 months (Fig 2). For those with 5 or more conditions, more than half had either category 3 or category 4 pain. About 2% of those without any painful health conditions had category 3 or 4 pain, and 3.7% of individuals reporting 5 or more health conditions had no pain.
Figure 2.
Association between the reported number of painful health conditions and Washington Group pain categories.
Table 3.
Associations Between Pain Categories and Health Status, Health Care Use, and Disability Variables
| Type of Measure | Pain Categories
|
Extended Mantel-Haenszel χ2 | DF | P Value | |||||||||
|---|---|---|---|---|---|---|---|---|---|---|---|---|---|
| No Pain
|
Category 1
|
Category 2
|
Category 3
|
Category 4
|
|||||||||
| N = 3663
|
N = 2,029
|
N = 1,217
|
N = 983
|
N = 575
|
|||||||||
| %* | SE | %* | SE | %* | SE | %* | SE | %* | SE | ||||
| Health status | |||||||||||||
| Poor/fair overall health | 5.4 | .4 | 9.6 | .8 | 16.2 | 1.4 | 26.1 | 1.9 | 50.3 | 3.1 | 882.5 | 4 | <.001 |
| Exhausted most/every day | 2.6 | .3 | 6.9 | .7 | 16.2 | 1.3 | 25.1 | 1.8 | 46.4 | 2.8 | 1020.4 | 4 | <.001 |
| Taking medication for depression | 3.7 | .4 | 5.7 | .6 | 12.9 | 1.2 | 16.6 | 1.4 | 31.7 | 2.7 | 482.8 | 4 | <.001 |
| Worried, nervous, anxious every day | 4.1 | .4 | 5.3 | .6 | 10.1 | 1.0 | 14.8 | 1.4 | 28.3 | 2.8 | 365.4 | 4 | <.001 |
| Health care use | |||||||||||||
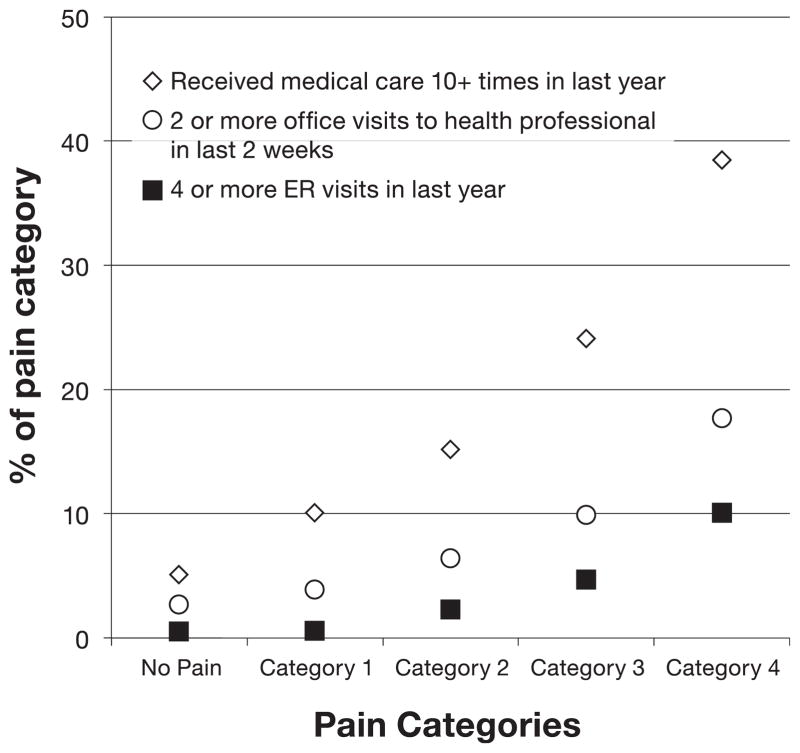
| Received medical care ≥10 times in last year | 5.1 | .4 | 10.1 | .8 | 15.2 | 1.3 | 24.1 | 1.7 | 38.5 | 2.4 | 580.9 | 4 | <.001 |
| ≥2 office visits with health professional in last 2 weeks | 2.7 | .3 | 3.9 | .5 | 6.4 | .9 | 9.9 | 1.2 | 17.7 | 2.0 | 426.6 | 4 | <.001 |
| ≥4 visits to emergency room in last year | .5 | .1 | .6 | .2 | 2.3 | .6 | 4.7 | 1.0 | 10.1 | 1.5 | 532.5 | 4 | <.001 |
| Disability | |||||||||||||
| Unable to work because of health problem | 2.3 | .3 | 4.3 | .5 | 8 | .8 | 17.8 | 1.6 | 36.7 | 2.5 | 709.7 | 4 | <.001 |
| A lot of difficulty walking or climbing steps | 1 | .2 | 2.7 | .4 | 5.2 | .7 | 11.4 | 1.2 | 28.3 | 2.2 | 1441.9 | 8 | <.001 |
| ≥5 bed-disability days | 6 | .5 | 8.9 | .8 | 17.4 | 1.4 | 24 | 1.5 | 37.8 | 2.4 | 701.2 | 16 | <.001 |
|
| |||||||||||||
| Mean* | SD | Mean* | SD | Mean* | SD | Mean* | SD | Mean* | SD | F† | DF | P Value | |
|
| |||||||||||||
| Health status | |||||||||||||
| Number of painful health conditions | .6 | 1.21 | 2.05 | 2.25 | 3.33 | 3.14 | 4.45 | 3.45 | 6.05 | 3.6 | 1107 | 4 | <.001 |
| Health care use | |||||||||||||
| Number of health professional visits in last 2 weeks | 0.17 | 0.55 | 0.24 | 0.61 | 0.35 | 0.81 | 0.56 | 1.34 | 0.74 | 1.13 | 102.5 | 4 | p<0.001 |
| Number of visits to the emergency room in last year | 0.21 | 0.78 | 0.27 | 0.79 | 0.46 | 1.08 | 0.69 | 1.49 | 1.36 | 2.52 | 149.9 | 4 | p<0.001 |
| Disability | |||||||||||||
| Number of health-related bed-disability days in last year | 1.46 | 11.03 | 2.41 | 14.45 | 4.8 | 22.9 | 7.71 | 27.87 | 15.26 | 38.39 | 74.5 | 4 | p<0.001 |
Denominator is the total number of individuals in each pain category.
F statistic calculated from 1-way ANOVA.
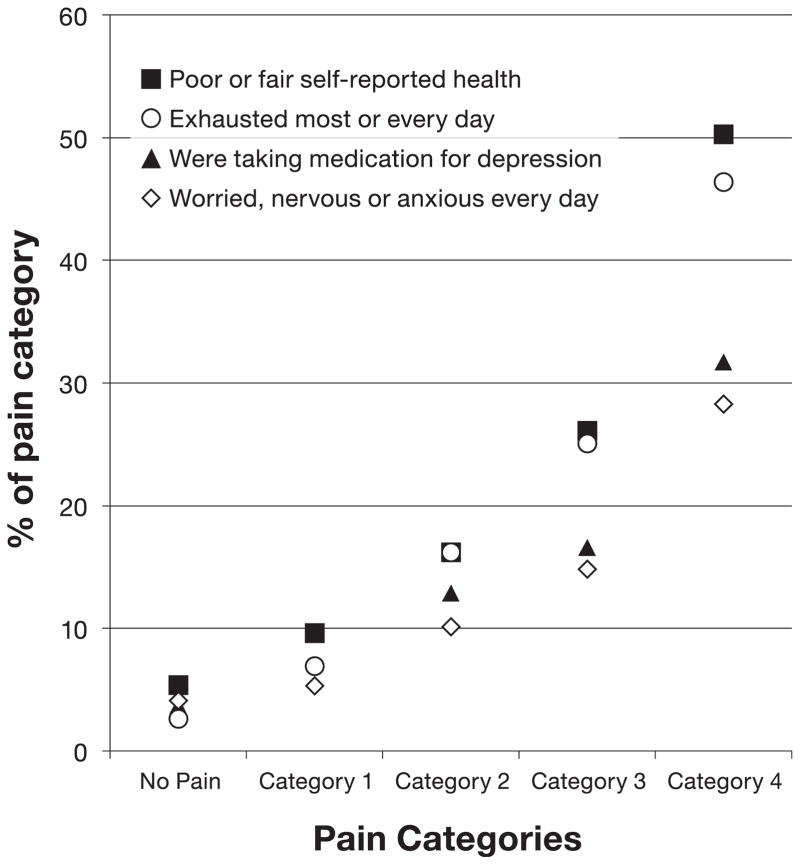
Fig 3 and Table 3 show the relationship between the pain categories and other measures of health status. As one moves to successively more severe pain states, there is increased probability of being in a poorer health state. For instance, although 5.4% of individuals reporting no pain rated their overall health as poor or fair, this increased to 9.6 in those with category 1 pain, 16.2% in those with category 2 pain, 26.1% in those with category 3 pain, and 50.3% in those with category 4 pain (P < .001) Similarly, those with category 4 pain were more likely to report being exhausted most or every day (46.4%), to be taking medication to treat their depression (31.7%), and to be worried, nervous, or anxious every day (28.3%).
Figure 3.
Association between Washington Group pain categories and measures of health status.
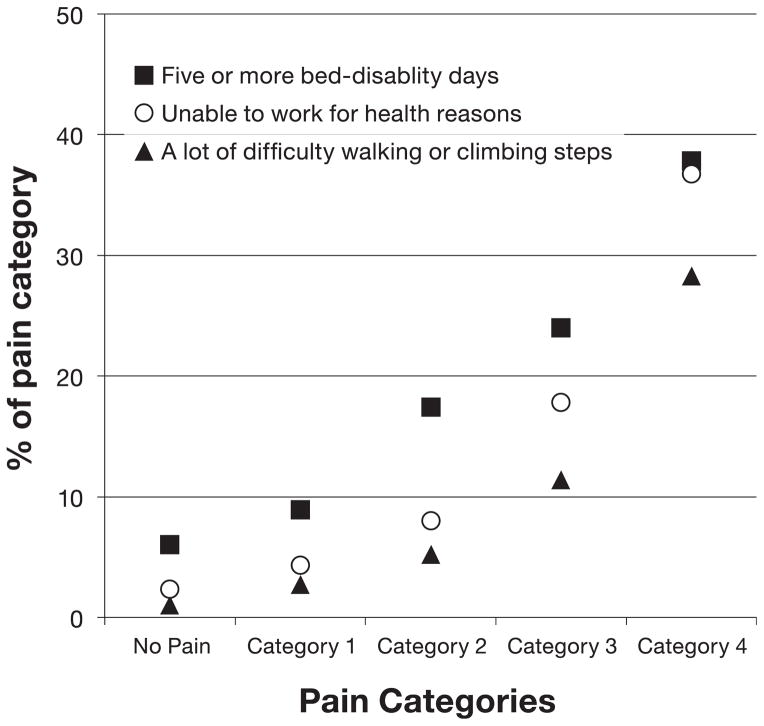
The association between pain category and disability is shown in Fig 4 and Table 3. The number of bed-disability days increased from 1.46 days in those with no pain to 15.26 days in those with category 4 pain (P < .001). Similarly, 38.7% of those with category 4 pain had at least 5 bed-disability days versus 6.0% of those with no pain. Although 2.3% of those without pain were unable to work for health reasons, this increased to 36.7% in those with category 4 pain. Those with category 4 pain were more likely to have a lot of difficulty walking or climbing steps (28.3%) versus those in lower pain states.
Figure 4.
Association between Washington Group pain categories and measures of disability.
Fig 5 and Table 3 show that individuals in more severe pain have greater use of health care than those in less severe pain. A significant increase was seen in the number of visits to a health profession within the previous 2 weeks (P < .001), with a mean of .17 visits seen in those not reporting pain to .74 visits seen in those with category 4 pain. Similarly, 17.7% of those with category 4 pain had 2 or more office visits in the previous 2 weeks versus 2.7% in those not reporting pain (P < .001). Individuals with category 4 pain were likely to have had 4 or more visits to the emergency room in the last year (10.1%) and to have received medical care 10 or more times in the last year (38.5%) compared with those in lower pain states (P < .001).
Figure 5.
Association between Washington Group pain categories and measures of healthcare utilization.
Demographic Variables
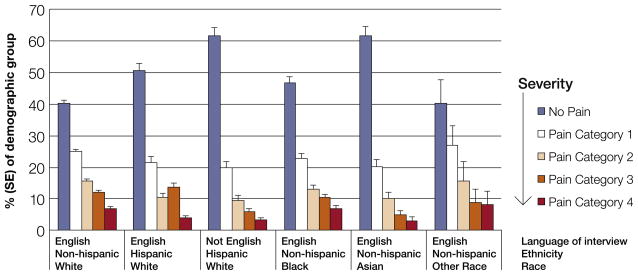
The distribution of pain categories across language/ethnic/racial groups was consistent with prevalence decreasing as one moves to more severe pain categories (Fig 6). Despite this similarity, some significant differences between groups were noted. NHA who preferred English and HW who did not prefer English were significantly more likely to be pain free than NHW who preferred English (P < .001), NHB who preferred English (P < .001), HW who preferred English (P = .004), and non-Hispanic individuals who did not self-report as white, black, or Asian who preferred English (P = .007). NHA who preferred English and HW who did not prefer English were also 1) significantly less likely to have category 3 pain (P < .001) than NHW who preferred English, NHB who preferred English, and HW who preferred English and 2) less likely to have category 4 pain than NHW who preferred English (P = .004) and NHB who preferred English (P = .011).
Figure 6.
Distribution of Washington Group pain categories across selected language/ethnic/racial groups.
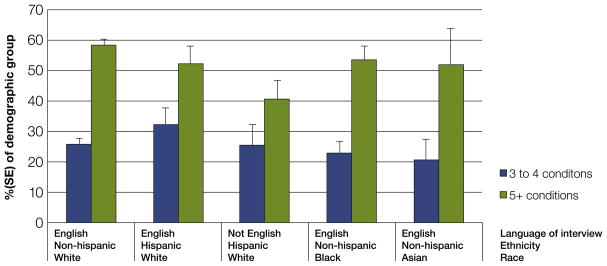
We further explored whether the observed differences in pain severity between language/ethnic/racial groups were consistent across the reported number of painful health conditions. As shown in Fig 7, for each demographic group except HW who did not prefer English, the prevalence of category 3 or 4 pain is substantially higher in those with 5 or more conditions compared with those with 3 to 4 conditions (P < .05). It was found that HW who preferred English with 5 or more health conditions had lower prevalence of category 3 or 4 pain than NHW who preferred English (P = .006). No difference was noted between HW who did not prefer English and any other group.
Figure 7.
Impact of the number of painful health conditions on the prevalence of category 3 or 4 pain across selected language/ethnic/racial groups.
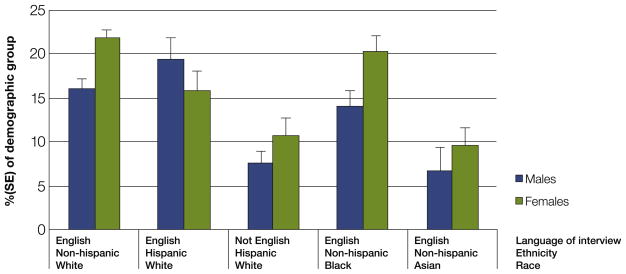
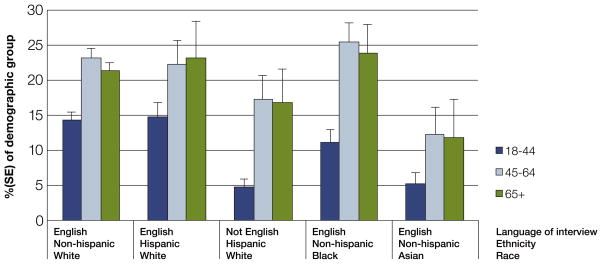
The impact of sex and age on the prevalence of category 3 or 4 pain varies by the specific language/ethnic/racial group. Although female NHW who preferred English and female NHB who preferred English have higher rates of category 3 or 4 pain than males (P < .001 and P = .016, respectively), no gender difference was seen for the other language/ethnic/racial group (Fig 8). Although 18-year-olds to 44-year-olds had a lower prevalence of category 3 or 4 pain then older age groups across language/ethnic/racial groups (Fig 9), no difference was seen between individuals 45 to 64 years old and 65 years or older. Those HWNE and NHA aged 18 to 44 years who preferred English had substantially lower rates of category 3 or 4 pain compared with this same age group in NHW who preferred English, HW who preferred English, and NHB who preferred English (P < .001). NHA who preferred English aged 45 to 64 years also had substantially lower rates of category 3 or 4 pain than NHW who preferred English and NHB who preferred English. No other age differences were seen between language/ethnic/racial groups.
Figure 8.
Impact of sex on the prevalence of category 3 or 4 pain across selected language/ethnic/racial groups.
Figure 9.
Impact of age on the prevalence of category 3 or 4 pain across selected language/ethnic/racial groups.
Discussion
Using data from a large, national survey, we estimate that 55.7% of American adults (approximately 126 million individuals) reported having some level of pain within the 3 months before the survey. Substantially fewer individuals (11.2 % or 25.3 million adults) had experienced chronic pain (pain every day for the past 3 months), a lot of pain (10.3% or 23.4 million adults), or were coded to the most severe Washington Group pain category (category 4: 6.4% or 14.4 million adults).
This study provides evidence on the concurrent (known-group) validity of the Washington Group pain categories in the general population, in that the pain categories clearly discriminate between different levels of health status, disability, and health care use. Although there was a strong relation been pain categories, and health status and disability variables, about 50% of individuals with category 4 pain reported their overall health status as good or better. This finding is similar to those by Von Korff and colleagues43 and Kamaleir and colleagues,22 who used different measures of pain severity. In a series of studies examining the impact of multiple painful musculoskeletal sites, Kamaleri and colleagues22 found that about 50% of individuals reporting as many as 10 painful musculoskeletal sites still rated their overall health status as good or better. In an early evaluation of the Chronic Pain Grade, Von Korff and colleagues43 found that many individuals with a Chronic Pain Grade of IV (most severe) still reported their overall health status as good or better: 45% in those with temporomandibular pain, 75.3% in those with headache, and 79.4% in those with back pain. These data show the heterogeneity of responses to pain even in those with similar levels of pain.
The Washington Group pain category approach used in this analysis has both substantial strengths and limitations. The approach has been tested and validated in a number of countries using a variety of qualitative assessments, such as cognitive testing,26,27,29,44 and, as shown in the present report, has concurrent validity. Importantly, the category assignment is based on just 2 questions. This brevity makes it easy to understand and to apply the scoring system and should ease its inclusion into epidemiological studies in which participant burden is already high. In this regard, the approach has met many of the criteria that Elliott and colleagues9 suggest for measures of chronic pain severity in epidemiological research: be brief, be simple, be acceptable, be reliable, and ask about appropriate duration of symptoms. However, the Washington Group pain categories have not yet been evaluated using psychometric approaches and clearly do not meet a critical criterion for a pain scale: multidimensionality. By multidimensional, Elliott and colleagues9 specifically mean the “psychological and social dimensions of chronic pain” and cite trying to combine multidimensionality with simplicity and brevity as the great challenge in designing new pain measures. Of the current pain measures, perhaps the one that comes closest to balancing brevity and multidimensionality is the Chronic Pain Grade approach developed and initially validated by Von Korff and colleagues,43 with subsequent replication completed across multiple countries,11,25,45 for both cross-sectional and longitudinal purposes,4,10,12,24,34 and in both the general population and clinical cohorts.4,24,25,34,43 When developing this approach, Von Korff and colleagues41,43 considered several additional criteria not listed by Elliot and colleagues9: 1) be a mutually exclusive and exhaustive set of ordered categories of rank, which correspond to qualitative differences in chronic pain severity; 2) be an important indicator of chronic pain severity and ability to predict patient outcomes; and 3) be generalizable across different anatomical sites and heterogeneous causes of chronic pain. In the present report, we have shown that the Washington Group approach meets some of these criteria by producing discrete ordinal categories that can discriminate levels of health status, health care use, and disability. However, to fully meet the 2 sets of criteria listed earlier, some additional studies are needed to explore the Washington Group approach, including, but not limited to 1) psychometric analyses to confirm the category cutoffs identified in qualitative studies; 2) longitudinal studies to assess changes in the pain severity category over time and the predictors of this change; 3) direct comparisons with established measures of pain and function, including but not limited to the Chronic Pain Grade, PROMIS (Patient Reported Outcomes Measurement Information System) measures of pain, and the Short Form 36 questionnaire (especially, body pain domain); 4) studies to assess the usefulness of the Washington Group pain categories in the clinic to aid diagnosis, guide treatment, and assess treatment outcomes; and 4) exploring the usefulness of the Washington Group approach in pediatric populations and other populations who might require a proxy respondent.
Although the Washington Group approach and the Chronic Pain Grades appear similar on first glance in that both divide pain status into 5 (including no pain) discrete ordinal categories, the domains creating the pain categories and grades differ substantially. The Washington Group categorization is based on questions assessing pain persistence and bothersomeness (which is related to pain intensity), whereas the Chronic Pain Grades I to IV are assigned based on pain intensity and pain-related disability. Originally, Von Korff and colleagues41,43 had considered pain persistence as an additional fact in grade assignment, but psychometric analysis found43 that persistence “was inconsistently and weakly associated with intensity and disability,” and that “it did not appear that the product of pain intensity and pain persistence substantially increase the prediction of threshold at which significant disability was present.” Persistence was eliminated from the scale. In the present analysis, we found that overall persistence had a moderate association with bothersomeness, but that the scaling differences between having “a lot of pain” and having “somewhere between a little and a lot of pain” disappear in those with pain every day (chronic pain). The differences in the present finding and that of Von Korff and colleagues41,43 might have several explanations, most especially differences in how pain persistence and intensity (bothersomeness) were assessed. For instance, in the Washington Group approach, bothersomeness was based on a single question with only 3 options (a little pain, between a little and a lot of pain, and a lot of pain), whereas the Chronic Pain Grades averaged 0 to 10 ratings of pain right now, average pain (last 6 months), and worst pain (in the last 6 months). Given these differences, additional studies are needed to directly compare the 2 pain assessment approaches.
Our finding that 55.7% of adults reported any pain is a higher prevalence rate than reported in previous U.S. national surveys. The difference probably reflects the questions used to assess pain. The initial pain question in the 2012 NHIS simply asked if the participant had pain in the last 3 months without any qualifiers. Studies using National Health and Nutrition Examination Survey (NHANES) data reported prevalence ranging from 26 to 34%,30,38,39 but the initial question asked participants if they had any pain within the last month that lasted at least 24 hours. Data from the Health and Retirement Study (HRS)37 produced similar prevalence rates (27–33%) to NHANES estimates. The Health and Retirement Study also qualified its question on pain by asking participants if they “were often troubled with pain.” In contrast, national surveys of the general population that have collected information on more severe pain (eg, VAS score of 8 or above), found prevalence rates between 7 and 11%,1,13,21 consistent with our observation that 10.3% of adults reported a lot of pain. Similar to our data, analysis of NHANES data consistently estimated chronic pain (pain ≥3 months) prevalence at 13 to 15%.6,15,38 The slightly lower rate we observed (11.1%) most likely results from our requirement that defined chronic pain as daily pain. These consistencies across national surveys reinforce our confidence that the pain questions in the NHIS provide reliable national estimates of pain prevalence.
To the best of our knowledge, these are the first data to assess the interactions of race, ethnicity, and language preference in relation to pain severity. In contrast to the present results, the 2 previous national studies of which were are aware that considered the impact of language20,36 did not find associations between the use of Spanish or English and pain. However, these studies differed from the present report in several substantial ways. Portenoy and colleagues36 collected data only from whites, blacks, and Hispanics and limited the regression analysis to those with disabling pain (both high pain severity and high life interference). The Health and Retirement Study analyzed by Jimenez and colleagues21 was limited to participants at least 50 years old who were “often troubled by pain.” In addition, neither of these studies presented age-specific and sex-specific prevalence rates of pain in whites and minority groups. Thus, although both studies present unique insights into specific populations, they do not reflect the association between race, ethnicity, and language and the spectrum of pain in the U.S. adult population.
The current study has several limitations beyond those already mentioned. First, because these are cross-sectional data, the study cannot assess clinical outcomes associated with pain severity. Second, because the NHIS did not collect pain treatment information, we were unable to determine whether differences in treatment could have further explained the difference in pain experiences of the participants. Third, although the NHIS sampling design allows for unbiased estimates of national trends, the data are limited to the noninstitutionalized population. Future research should consider nationally representative pain assessment for persons in nursing home, hospice, and other residential health care facilities, because these persons are likely to be disproportionately affected by chronic conditions. Because of sample size limitations, 1) we were not able to examine Asians and Hispanic subpopulations (eg, Koreans, Chinese, Puerto Ricans, Mexicans), who vary in their underlying health status2,19; 2) we were not able to examine Native Americans, Native Alaskans, Native Hawaiians, and Pacific Islanders individually but had to combine them into a single group; and 3) we had to code preferred languages into 2 broad groups: those who preferred English and those who preferred another language.
In 2012, nearly 40 million adults (17.6% of all adults) were classified as falling within the 2 most severe Washington Group pain categories (3 and 4). Individuals with category 3 or 4 pain were more likely to have worse health status, to use more health care, and to suffer from more disability than those with less severe pain. Associations were seen between pain severity and selected demographic variables, including race, ethnicity, preferred language, sex, and age. Although these data are promising, additional work is required to determine the usefulness of the Washington Group pain categories for pain research or clinical practice.
Highlights.
2012 estimates of pain prevalence and severity are presented for U.S. adults.
A simple, 2-item measure for categorizing pain severity is introduced.
Pain persistence and bothersomeness designate 5 discrete categories of pain severity.
The study describes the concurrent validation of the measure.
Pain severity is associated with race, ethnicity, preferred language, sex, and age.
Acknowledgments
The author performed this work as part of his official federal duties. No outside financial support was provided.
The author’s time and effort on this project were supported as part of his official duties as a federal employee. No other sources of funding were involved. The data contained within this report have not been previously reported in any other manuscript or meeting abstract.
The author thanks Dr. Laura Lee Johnson, PhD, of National Center for Complementary and Integrative Health (NCCIH), National Institutes of Health for her statistical advice, Ms. Danita Byrd-Clark, BBA, of Social & Scientific Systems, for her programming skills, Mr. Bryan Ewsichek, BA, of NCCIH, National Institutes of Health for his help with graphic design, and the many NCCIH staff who read and commented on earlier versions of this work.
Footnotes
The author has no competing interests.
Uncited Reference
42.
The author met all criteria for authorship as stated in the Journal of Pain instructions for authors. The author does not have a conflict to disclose.
References
- 1.Banks J, Kapteyn A, Smith JP, van Soest A. Work disability is a pain in the ****, especially in England, the Netherlands, and the United States. In: Cutler D, Wise D, editors. Health at Older Ages: The Causes and Consequences of Declining Disability among the Elderly. Chicago, Ill: University of Chicago Press; 2009. [Google Scholar]
- 2.Barnes PM, Adams PF, Powell-Griner E. Advance data from vital and health statistics. 394. Hyattsville, MD: National Center for Health Statistics; 2008. [Accessed April 22, 2015]. Health characteristics of the Asian adult population: United States, 2004–2006. Available at: http://www.cdc.gov/nchs/data/ad/ad394.pdf. [PubMed] [Google Scholar]
- 3.Bolen J, Schieb L, Hootman JM, Helmick CG, Theis K, Murphy LB, Langmaid G. Differences in the prevalence and severity of arthritis among racial/ethnic groups in the United States, National Health Interview Survey, 2002, 2003, and 2006. Prev Chronic Dis. 2010;7:A64. [PMC free article] [PubMed] [Google Scholar]
- 4.Bruhn H, Bond CM, Elliott AM, Hannaford PC, Lee AJ, McNamee P, Smith BH, Watson MC, Holland R, Wright D. Pharmacist-led management of chronic pain in primary care: Results from a randomised controlled exploratory trial. BMJ Open. 2013;3:e002361. doi: 10.1136/bmjopen-2012-002361. [DOI] [PMC free article] [PubMed] [Google Scholar]
- 5.Chowdhury PP, Balluz L, Strine TW. Health-related quality of life among minority populations in the United States, BRFSS 2001–2002. Ethn Dis. 2008;18:483–487. [PubMed] [Google Scholar]
- 6.Dansie EJ, Turk DC, Martin KR, Van Domelen DR, Patel KV. Association of chronic widespread pain with objectively measured physical activity in adults: Findings from the National Health and Nutrition Examination Survey. J Pain. 2014;15:507–515. doi: 10.1016/j.jpain.2014.01.489. [DOI] [PubMed] [Google Scholar]
- 7.Deyo RA, Dworkin SF, Amtmann D, Andersson G, Borenstein D, Carragee E, Carrino J, Chou R, Cook K, DeLitto A, Goertz C, Khalsa P, Loeser J, Mackey S, Panagis J, Rainville J, Tosteson T, Turk D, Von Korff M, Weiner DK. Report of the NIH Task Force on research standards for chronic low back pain. J Pain. 2014;15:569–585. doi: 10.1016/j.jpain.2014.03.005. [DOI] [PMC free article] [PubMed] [Google Scholar]
- 8.Deyo RA, Mirza SK, Martin BI. Back pain prevalence and visit rates: Estimates from U.S. national surveys, 2002. Spine. 2006;31:2724–2727. doi: 10.1097/01.brs.0000244618.06877.cd. [DOI] [PubMed] [Google Scholar]
- 9.Elliott AM, Smith BH, Chambers WA. Measuring the severity of chronic pain: A research perspective. Expert Rev Neurother. 2003;3:581–590. doi: 10.1586/14737175.3.5.581. [DOI] [PubMed] [Google Scholar]
- 10.Elliott AM, Smith BH, Hannaford PC, Smith WC, Chambers WA. The course of chronic pain in the community: Results of a 4-year follow-up study. Pain. 2002;99:299–307. doi: 10.1016/s0304-3959(02)00138-0. [DOI] [PubMed] [Google Scholar]
- 11.Elliott AM, Smith BH, Penny KI, Smith WC, Chambers WA. The epidemiology of chronic pain in the community. Lancet. 1999;354:1248–1252. doi: 10.1016/s0140-6736(99)03057-3. [DOI] [PubMed] [Google Scholar]
- 12.Elliott AM, Smith BH, Smith WC, Chambers WA. Changes in chronic pain severity over time: The Chronic Pain Grade as a valid measure. Pain. 2000;88:303–308. doi: 10.1016/S0304-3959(00)00337-7. [DOI] [PubMed] [Google Scholar]
- 13.Gaskin DJ, Richard P. The economic costs of pain in the United States. J Pain. 2012;13:715–724. doi: 10.1016/j.jpain.2012.03.009. [DOI] [PubMed] [Google Scholar]
- 14.Grubert E, Baker TA, McGeever K, Shaw BA. The role of pain in understanding racial/ethnic differences in the frequency of physical activity among older adults. J Aging Health. 2013;25:405–421. doi: 10.1177/0898264312469404. [DOI] [PMC free article] [PubMed] [Google Scholar]
- 15.Hardt J, Jacobsen C, Goldberg J, Nickel R, Buchwald D. Prevalence of chronic pain in a representative sample in the United States. Pain Med. 2008;9:803–812. doi: 10.1111/j.1526-4637.2008.00425.x. [DOI] [PubMed] [Google Scholar]
- 16.Hitt HC, McMillen RC, Thornton-Neaves T, Koch K, Cosby AG. Comorbidity of obesity and pain in a general population: Results from the Southern Pain Prevalence Study. J Pain. 2007;8:430–436. doi: 10.1016/j.jpain.2006.12.003. [DOI] [PubMed] [Google Scholar]
- 17.Institute of Medicine. Relieving Pain in American: A Blueprint for Transforming Prevention, Care, Education and Research. Washington, DC: The National Academies Press; 2011. [PubMed] [Google Scholar]
- 18.International Association for the Study of Pain, Task Force on Taxonomy. Pain terms, a current list with definitions and notes on usage. In: Merskey H, Bogduk N, editors. Classification of Chronic Pain. 2. Seattle: IASP Press; 1994. [Google Scholar]
- 19.Jerant A, Arellanes R, Franks P. Health status among US Hispanics: Ethnic variation, nativity, and language moderation. Med Care. 2008;46:709–717. doi: 10.1097/MLR.0b013e3181789431. [DOI] [PubMed] [Google Scholar]
- 20.Jimenez N, Dansie E, Buchwald D, Goldberg J. Pain among older Hispanics in the United States: Is acculturation associated with pain? Pain Med. 2013;14:1134–1139. doi: 10.1111/pme.12147. [DOI] [PMC free article] [PubMed] [Google Scholar]
- 21.Johannes CB, Le TK, Zhou X, Johnston JA, Dworkin RH. The prevalence of chronic pain in United States adults: Results of an Internet-based survey. J Pain. 2010;11:1230–1239. doi: 10.1016/j.jpain.2010.07.002. [DOI] [PubMed] [Google Scholar]
- 22.Kamaleri Y, Natvig B, Ihlebaek CM, Benth JS, Bruusgaard D. Number of pain sites is associated with demographic, lifestyle, and health-related factors in the general population. Eur J Pain. 2008;12:742–748. doi: 10.1016/j.ejpain.2007.11.005. [DOI] [PubMed] [Google Scholar]
- 23.Kennedy J, Roll JM, Schraudner T, Murphy S, McPherson S. Prevalence of persistent pain in the U.S. adult population: New data from the 2010 National Health Interview Survey. J Pain. 2014;15:979–984. doi: 10.1016/j.jpain.2014.05.009. [DOI] [PubMed] [Google Scholar]
- 24.Khan F, Amatya B, Kesselring J. Longitudinal 7-year follow-up of chronic pain in persons with multiple sclerosis in the community. J Neurol. 2013;260:2005–2015. doi: 10.1007/s00415-013-6925-z. [DOI] [PubMed] [Google Scholar]
- 25.Klasen BW, Hallner D, Schaub C, Willburger R, Hasenbring M. Validation and reliability of the German version of the Chronic Pain Grade questionnaire in primary care back pain patients. Psychosoc Med. 2004;1:Doc07. [PMC free article] [PubMed] [Google Scholar]
- 26.Madans JH, Loeb ME, Altman BM. Measuring disability and monitoring the UN Convention on the Rights of Persons with Disabilities: The work of the Washington Group on Disability Statistics. BMC Public Health. 2011;11(Suppl 4):S4. doi: 10.1186/1471-2458-11-S4-S4. [DOI] [PMC free article] [PubMed] [Google Scholar]
- 27.Madans JH, Loeb M. Methods to improve international comparability of census and survey measures of disability. Disabil Rehabil. 2013;35:1070–1073. doi: 10.3109/09638288.2012.720353. [DOI] [PubMed] [Google Scholar]
- 28.Meghani SH, Cho E. Self-reported pain and utilization of pain treatment between minorities and nonminorities in the United States. Public Health Nurs. 2009;26:307–316. doi: 10.1111/j.1525-1446.2009.00785.x. [DOI] [PubMed] [Google Scholar]
- 29.Miller K, Loeb M. Mixed-Method Assessment of Validity and Cross-Subgroup Comparability. AAPOR 69th Annual Conference; Anaheim, CA. 2014. [Accessed April 22, 2014]. Available at: http://www.aapor.org/AAPORKentico/AAPOR_Main/media/MainSiteFiles/Abstract_Book_FNL.pdf. [Google Scholar]
- 30.National Center for Health Statistics. Health, United States, 2006 With Chartbook on Trends in the Health of Americans. Hyattsville, MD: 2006. [PubMed] [Google Scholar]
- 31.National Center for Health Statistics. Data File Documentation, National Health Interview Survey, 2012. Hyattsville, MD: National Center for Health Statistics, Centers for Disease Control and Prevention; 2013. [Google Scholar]
- 32.National Pain Strategy Task Force. [Accessed April 23, 2015];Draft National Pain Strategy. 2015 Available at: http://iprcc.nih.gov/National_Pain_Strategy/NPS_Main.htm.
- 33.Nguyen M, Ugarte C, Fuller I, Haas G, Portenoy RK. Access to care for chronic pain: Racial and ethnic differences. J Pain. 2005;6:301–314. doi: 10.1016/j.jpain.2004.12.008. [DOI] [PubMed] [Google Scholar]
- 34.Ohrbach R, Turner JA, Sherman JJ, Mancl LA, Truelove EL, Schiffman EL, Dworkin SF. The Research Diagnostic Criteria for Temporomandibular Disorders. IV: Evaluation of psychometric properties of the Axis II measures. J Orofac Pain. 2010;24:48–62. [PMC free article] [PubMed] [Google Scholar]
- 35.Plesh O, Adams SH, Gansky SA. Racial/ethnic and gender prevalences in reported common pains in a national sample. J Orofac Pain. 2011;25:25–31. [PMC free article] [PubMed] [Google Scholar]
- 36.Portenoy RK, Ugarte C, Fuller I, Haas G. Population-based survey of pain in the United States: Differences among white, African American, and Hispanic subjects. J Pain. 2004;5:317–328. doi: 10.1016/j.jpain.2004.05.005. [DOI] [PubMed] [Google Scholar]
- 37.Reyes-Gibby CC, Aday LA, Todd KH, Cleeland CS, Anderson KO. Pain in aging community-dwelling adults in the United States: Non-Hispanic whites, non-Hispanic blacks, and Hispanics. J Pain. 2007;8:75–84. doi: 10.1016/j.jpain.2006.06.002. [DOI] [PMC free article] [PubMed] [Google Scholar]
- 38.Riskowski JL. Associations of socioeconomic position and pain prevalence in the United States: Findings from the National Health and Nutrition Examination Survey. Pain Med. 2014;15:1508–1521. doi: 10.1111/pme.12528. [DOI] [PubMed] [Google Scholar]
- 39.Slade GD, Sanders AE, By K. Role of allostatic load in sociodemographic patterns of pain prevalence in the U.S. population. J Pain. 2012;13:666–675. doi: 10.1016/j.jpain.2012.04.003. [DOI] [PMC free article] [PubMed] [Google Scholar]
- 40.Strine TW, Hootman JM. US national prevalence and correlates of low back and neck pain among adults. Arthritis Rheum. 2007;57:656–665. doi: 10.1002/art.22684. [DOI] [PubMed] [Google Scholar]
- 41.Von Korff M, Dworkin SF, Le Resche L. Graded chronic pain status: An epidemiologic evaluation. Pain. 1990;40:279–291. doi: 10.1016/0304-3959(90)91125-3. [DOI] [PubMed] [Google Scholar]
- 42.Von Korff M, Jensen MP, Karoly P. Assessing global pain severity by self-report in clinical and health services research. Spine (Phila Pa 1976) 2000;25:3140–3151. doi: 10.1097/00007632-200012150-00009. [DOI] [PubMed] [Google Scholar]
- 43.Von Korff M, Ormel J, Keefe FJ, Dworkin SF. Grading the severity of chronic pain. Pain. 1992;50:133–149. doi: 10.1016/0304-3959(92)90154-4. [DOI] [PubMed] [Google Scholar]
- 44. [Accessed April 23, 2015];Washington Group on Disability Statistics. Available at: http://www.cdc.gov/nchs/washington_group.htm.
- 45.Wong WS, Fielding R. Prevalence and characteristics of chronic pain in the general population of Hong Kong. J Pain. 2011;12:236–245. doi: 10.1016/j.jpain.2010.07.004. [DOI] [PubMed] [Google Scholar]


