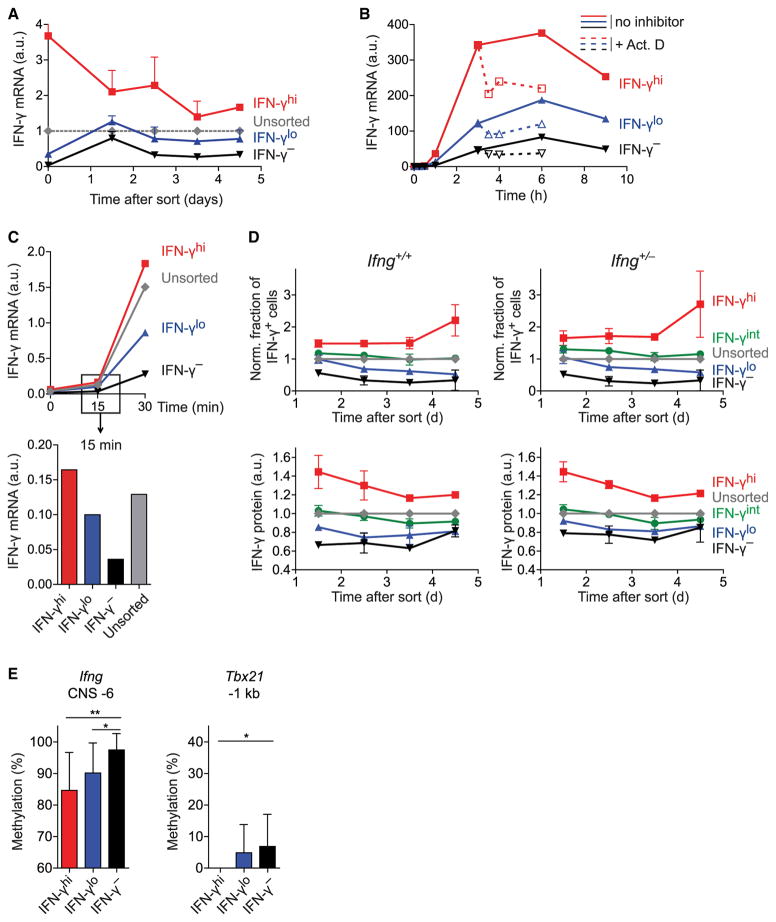
Figure 4. The Quantitative Memory for IFN-γ Production Is Regulated at the Level of Transcription at Individual Alleles.
(A–C) Th1 cells were sorted by secreted IFN-γ amounts and tracked.
(A) IFN-γ mRNA upon restimulation was normalized to HPRT (means + SD).
(B) On day 3 after sort, cells were restimulated. 3 hr after onset, transcription was inhibited in some cells (dotted line, open symbols). IFN-γ mRNA normalized to HPRT over the course of stimulation is shown.
(C) Data as in (B) with a focus on early time points after stimulation onset.
Data are pooled from (A) or are representative of (B, C) two independent experiments.
(D) Ifng+/+ or Ifng+/− Th1 cells were sorted by secreted IFN-γ amounts and cultured. Top, frequency of IFN-γ+ cells in sorted fractions normalized to that in unsorted cells. Bottom, normalized IFN-γ amount per cell in the sorted fractions. Means ± SD of two independent experiments are shown.
(E) Degree of DNA methylation (means + SD) is depicted in Th1 cells sorted by graded IFN-γ secretion and analyzed by bisulfite sequencing at a CpG island corresponding to CNS −6 at the Ifng locus (left) and at a CpG island approximately 1 kb upstream of the Tbx21 promoter (right).
See also Figure S4.

