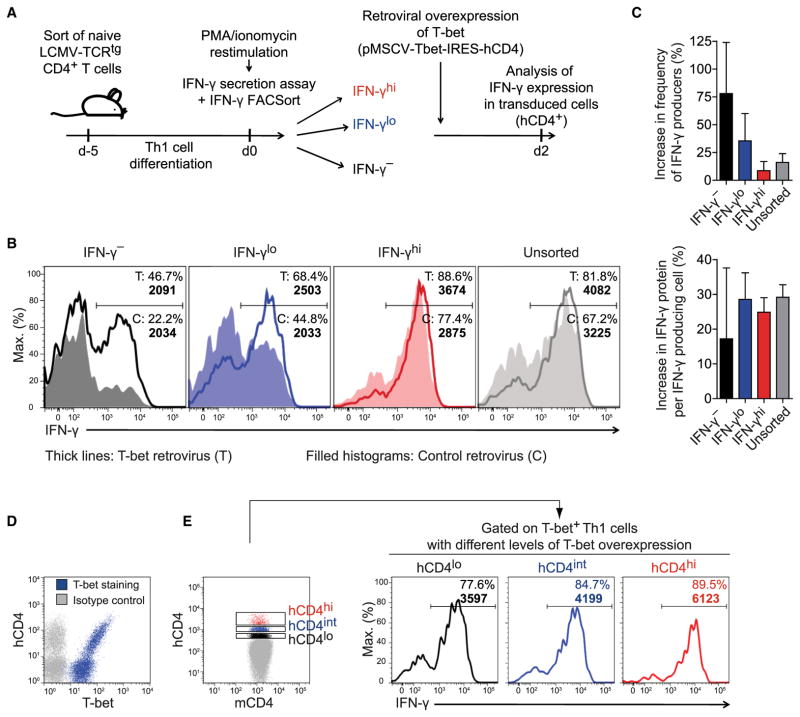
Figure 6. T-bet Quantitatively Controls IFN-γ Expression in Fully Differentiated Th1 Cells.
(A) Experimental setup. Th1 cells were sorted by secreted IFN-γ amounts and transduced with a T-bet-encoding or control retrovirus. IFN-γ expression was analyzed in transduced (hCD4+) cells 2 days later.
(B) Frequencies of IFN-γ+ cells and geometric mean of IFN-γ in IFN-γ+ cells (bold numbers).
(C) Relative increase in IFN-γ expression probability and per-cell amount upon T-bet overexpression (means + SD).
(D and E) Unsorted Th1 cells were transduced with a T-bet-encoding retrovirus and analyzed 2 days later.
(D) Counterstaining of T-bet and hCD4.
(E) Frequencies of IFN-γ+ cells and geometric mean of IFN-γ in IFN-γ+ cells (bold numbers) in cells overexpressing different amounts of hCD4, i.e., T-bet.
Representative results of (B, D, E) or pooled data from (C) two independent experiments are shown.

