

Abstract
Purpose
Numerous studies establish associations between adverse perinatal outcomes/complications and autism spectrum disorder (ASD). There has been little assessment of population attributable fractions (PAFs).
Methods
We estimated average ASD PAFs for preterm birth (PTB), small for gestational age (SGA), and Cesarean delivery (CD) in a U.S. population. Average PAF methodology accounts for risk factor co-occurrence. ASD cases were singleton non-Hispanic white, non-Hispanic black, and Hispanic children born in 1994 (n = 703) or 2000 (n = 1339) who resided in 48 U.S. counties included within eight Autism and Developmental Disabilities Monitoring Network sites. Cases were matched on birth year, sex, and maternal county of residence, race-ethnicity, age, and education to 20 controls from U.S. natality files. Results: For the 1994 cohort, average PAFs were 4.2%, 0.9%, and 7.9% for PTB, SGA, and CD, respectively. The summary PAF was 13.0% (1.7%–19.5%). For the 2000 cohort, average PAFs were 2.0%, 3.1%, and 6.7% for PTB, SGA, and CD, respectively, with a summary PAF of 11.8% (7.5%–15.9%).
Conclusions
Three perinatal risk factors notably contribute to ASD risk in a U.S. population. Because each factor represents multiple etiologic pathways, PAF estimates are best interpreted as the proportion of ASD attributable to having a suboptimal perinatal environment resulting in PTB, SGA, and/or CD.
Keywords: Autism, Birth weight, Cesarean section, Population, Premature birth, Risk factors
Introduction
Autism spectrum disorders (ASDs) are characterized by social and communication impairments and restricted, stereotyped patterns of behavior [1]. ASD prevalence in the U.S. [2–4] and other populations [5–9] has increased markedly and is currently estimated at 1%–2% [2–9]. Numerous genetic factors are implicated in the etiology of ASDs [10] and twin studies suggest high heritability [11]; the composite evidence supports gene-environment interactions. Research on nongenetic risk factors is evolving. Numerous studies document associations between ASD and various adverse perinatal outcomes and complications [12]. Limited studies suggest associations between ASD and more specific maternal exposures such as infections [13,14], medications [15–17], and environmental pollutants [18,19].
For most ASD risk factors, there has been no assessment of population attributable fractions (PAFs). We estimated PAFs for three perinatal risk factors, preterm birth (PTB), small for gestational age (SGA), and Cesarean delivery (CD) among U.S. children included in the Autism and Developmental Disabilities Monitoring (ADDM) Network and compared PAFs from the most recent ADDM surveillance year with those from an earlier time. We chose factors that were both relatively common (≥10% population prevalence) and thus could substantively contribute to the population ASD burden and established as ASD risk factors through multiple studies in a range of populations [12]. Nonetheless, each factor represents a composite of multiple potential underlying etiologic mechanisms. Their PAF estimates are thus best interpreted as the proportion of ASD attributable to having a suboptimal perinatal environment resulting in PTB, SGA, and/or CD.
Methods
Study population
The ADDM Network is an ongoing ASD surveillance program among 8-year-old children residing in selected U.S. population–based sites. Thirteen sites participated in the 2002 ADDM surveillance year and 14 participated in the 2008 surveillance year.
For children meeting birth year and residence eligibility criteria, each ADDM site reviews special education records and medical records from providers who conduct developmental evaluations. Records with documentation of an ASD diagnosis or education classification or behavioral characteristics consistent with possible ASD are fully abstracted. Data abstracted include demographics, ASD and other disability diagnoses, behavioral descriptions from developmental evaluations, and intelligence quotient (IQ) score. Abstractions from different sources for the same child are concatenated. Trained clinicians review the composite abstractions using a standardized protocol based on the Diagnostic and Statistical Manual of Mental Disorders (Fourth Edition Text Revision) to classify children as having or not having ASDs [1]. Sites link their final data for ASD cases to state natality files; across sites 70% of children are born in-state and match a birth record.
Study population, cases
Our sample selection strategy is outlined in the Appendix. We initially selected children classified as ASD cases in 2002 or 2008 from 13 sites that participated in ADDM both years. Because ADDM tracks children aged 8 years, these children were born in 1994 and 2000. We further selected children residing both at birth and during the surveillance year in counties included in ADDM sites' catchment areas in both 2002 and 2008. This narrowed our population, as the geographic boundaries changed for some sites. In addition, the birth residence restriction (which was necessary to ensure comparability with controls) meant that we pragmatically restricted our population to sites that included the maternal residence county indicator in their submitted ADDM-natality data set (three sites did not) and to children linked to their birth record. We further excluded two sites that did not provide other needed variables. These selection criteria, although not impacting internal validity, did narrow the generalizability. Nonetheless, our defined study population still included 48 counties from eight states. Because of subgroup sample size constraints, we further limited the population to singleton non-Hispanic white (NHW), non-Hispanic black (NHB), and Hispanic children (n = 747 and 1406 cases from 2002 and 2008, respectively).
During analysis, we excluded a small percentage of children (3% from 2002 and 1% from 2008) missing data on one or more study variables and a small percentage of children (3% from both 2002 and 2008) included in a final matching stratum with a low number of potential controls per case (see the following section). Our final analytic sample included 703 children from 2002 ADDM (1994 birth cohort) and 1339 children from 2008 ADDM (2000 cohort).
Study population, controls
Although sites link their ADDM and natality datafiles, the deidentified data they submit for the pooled data set include only ASD cases (i.e., unlinked births from sites' natality files are not provided). Thus, we selected controls from public-use 1994 and 2000 U.S. natality files. We could not discern which births within those files were subsequently identified as ADDM cases (and thus, already included in our sample). Given the relatively low ASD population prevalence, the overall probability of selecting a case as a control was low.
To carefully and efficiently consider confounders, we used a matched design. We matched each case to 20 controls from the same birth year on sex, maternal race-ethnicity (NHW, NHB, Hispanic), county of residence, age (<20, 20–29, 30–34, 35+ years), and education (high school or less, greater than high school) at birth. We selected a high number of controls because the PAF methodology combined with modeling methods used resulted in a loss of controls within certain strata.
Public-use natality files do not include the specific maternal residence county for county populations less than 100,000. Rather, a general “small-county” indicator is provided. Thus, cases with a maternal county population of 100,000 or higher were exactly matched to controls on maternal residence county, whereas cases born to mothers from small-population counties were matched on the general small-county indicator for the state.
Given both number and type of matching factors, our sample was subdivided into numerous matching strata, some with a small number of births. Thus, one study selection criterion was birth within a study-matching stratum including a minimum of 20 potential controls.
Even still, some included strata were small and there was a nonnegligible possibility that we inadvertently selected the case as one of the controls. We conducted sensitivity analyses to assess the impact of this possible problem (see the following section).
Perinatal factors
PTB, SGA, and CD were derived from natality file data. PTB was defined as gestational age less than 37 completed weeks. Gestational age was based on last menstrual period or clinical estimate when last menstrual period was missing. SGA was defined as birth weight for gestational age less than 10th percentile of sex-specific referent curves for U.S. singleton livebirths between 1999 and 2000 [20]. CD included both primary and secondary CD.
Statistical methods
We estimated the summary PAF of exposure to any one of the three risk factors (PTB, SGA, or CD), alone or in any combination with any of the other factors. This represents the maximum proportion of ASD cases attributable to this risk factor set. Then, we partitioned the summary PAF into unique average PAFs for each risk factor to estimate proportions of ASD cases attributable to each factor on average, while considering the interaction among factors and the dynamic nature of the risk factors in the population. Average PAFs account for co-occurrence among the three factors while adjusting for other potential confounders; thus, in general, average PAFs address the inherent over-estimation that occurs when computing separate crude or adjusted PAFs [21].
The average PAF is a summary estimate that considers all possible sequences of eliminating risk factors in a defined risk factor set. This methodology requires estimation of multiple sequential PAFs. For example, one sequence for this analysis addresses the hypothetical question, what would be the impact on ASD prevalence if one could first eliminate PTB from the population, followed by SGA, followed by CD. One sequential PAF is estimated for each factor in this sequence and an average PAF for each risk factor is derived using the simple average of all sequential PAFs for that factor.
Calculation of average PAFs for our defined risk factor set required 18 stratum-specific odds ratios (ORs) (six/factor) and a summary OR for the association with any one or more of the factors. Strata were defined based on the presence or absence of the perinatal factor(s) in the risk factor set that were not being assessed in a given calculation. Summary PAFs, then sequential and average PAFs, were derived using the stratum-specific ORs and corresponding proportions of exposed cases [22,23].
Given the matched design, we used conditional logistic regression to calculate ORs adjusted for the matching factors. In sequential PAF calculations, not all cases and controls in a matched analysis are informative because some controls matched to a case on demographic factors are not included in the same perinatal risk factor strata as the case. Our selection of 20 controls per case helped stabilize stratum-specific estimations.
In addition, we re-estimated ORs using an unmatched methodology, unconditional logistic regression, in which none of the cases or controls dropped out of the models. We included four of the five matching factors as independent variables: child sex, maternal race-ethnicity, age, and education. However, we could not adjust for maternal residence county because of the large number of distinct counties in our population. The findings from conditional and unconditional logistic regression were very similar; thus, we only present the former.
We also performed sensitivity analyses to consider the potential problem that in some case-control sets, one selected control was actually the case. For 25% of 1994 birth cohort cases and 31% of 2000 cohort cases, one of the 20 controls had exact or nearly exact (one minor discrepancy only) values for seven birth variables (exact birth weight, exact gestational age, exact maternal and paternal ages, years of education, marital status, and parity). We re-estimated PAFs after excluding these questionable controls. All re-estimates matched our original findings within one-tenth of a percent.
We analyzed the 1994 and 2000 birth cohorts separately and calculated summary PAFs for subgroups based on sex and co-occurring intellectual disability (ID, defined as IQ score <70).
We estimated 95% confidence limits (CLs) for average and summary PAFs using a bootstrap technique with 1000 replicates. Each resampled data set comprised case-control sets from the original study sample randomly selected with replacement. CLs were estimated as the 2.5 and 97.5 percentiles of the 1000 replica estimates. Small sample sizes precluded CL estimation for average PAFs among the 1994 birth cohort. We thus developed a hybrid method, in which we applied information gleaned from the 2000 cohort to the 1994 cohort. For the 2000 cohort, we compared variance estimates based on the bootstrap methodology to those based on a simplistic calculation that assumed all covariances were 0 (the most naïve assumption). We assumed that relative differences between bootstrap and naive variance estimates were similar for the two cohorts and thus applied the 2000 cohort variance ratio (bootstrap/naive) to naive variance estimates for the 1994 cohort.
Naive variance estimates were generated in the Interactive Risk Assessment Program version 2.2 (U.S. National Cancer Institute, Bethesda, MD) [24,25]. All other analyses were performed using SAS version 9.2 (SAS Institute Inc., Cary, NC) [26,27].
Human subjects review was not required for this secondary analysis of de-identified data.
Results
The majority of ASD cases from both birth cohorts were male, NHW, and were from three sites: Arizona, Georgia, and Missouri (Table 1). For more than 40%, maternal age at birth was 30 years or older and for more than 50%, maternal education was greater than high school.
Table 1. Characteristics of study cases, 1994 versus 2000 birth cohorts.
| Characteristic | 1994 Birth cohort | 2000 Birth cohort |
|---|---|---|
|
|
|
|
| % Distribution | % Distribution | |
| Study site | ||
| Alabama | 12.2 | 9.8 |
| Arizona | 18.8 | 20.7 |
| Arkansas | 4.1 | 2.5 |
| Georgia | 23.5 | 24.4 |
| Maryland | 9.5 | 9.6 |
| Missouri | 19.9 | 19.0 |
| North Carolina | 10.4 | 12.0 |
| Utah | 1.6 | 2.0 |
| Child sex | ||
| Male | 82.5 | 83.4 |
| Female | 17.5 | 16.7 |
| Maternal race-ethnicity | ||
| Non-Hispanic white | 69.7 | 68.6 |
| Non-Hispanic black | 25.8 | 24.1 |
| Hispanic | 4.6 | 7.3 |
| Maternal age at birth, y | ||
| <20 | 7.3 | 7.0 |
| 20–29 | 48.2 | 45.6 |
| 30–34, | 28.6 | 28.6 |
| 35+ | 15.9 | 18.9 |
| Maternal education at birth | ||
| High school or less | 42.4 | 38.2 |
| Greater than high school | 57.6 | 61.8 |
Overall, the frequencies of PTB, SGA, and CD among cases were 13%–14%, 11%–12%, and 27%–28%, respectively, for both cohorts (Table 2). The proportion of cases with any of the three was 44% for both cohorts. The proportion of cases with all three factors was 0.7% and 1.0%, for the 1994 and 2000 cohorts, respectively. For both cohorts, the percentages of the risk factors, overall, and in various strata of the other factors was lower among the controls than cases, with only one exception (SGA without PTB or CD in the 1994 cohort).
Table 2. Prevalence of perinatal risk factors, overall and in various combinations, for study cases and controls.
| Risk factor(s) | 1994 Birth cohort | 2000 Birth cohort | ||
|---|---|---|---|---|
|
|
|
|||
| Cases % | Controls % | Cases % | Controls % | |
| PTB (overall) | 13.5 | 10.7 | 13.1 | 10.6 |
| SGA (overall) | 11.2 | 10.3 | 12.0 | 9.3 |
| CD (overall) | 27.5 | 20.8 | 28.3 | 22.7 |
| PTB or SGA or CD | 44.2 | 36.1 | 44.0 | 36.7 |
| PTB only | 9.3 | 7.2 | 7.4 | 6.9 |
| SGA only | 6.4 | 7.3 | 7.5 | 6.4 |
| CD only | 21.3 | 16.3 | 20.6 | 17.9 |
| PTB + SGA | 1.1 | 0.7 | 0.8 | 0.6 |
| PTB + CD | 2.4 | 2.4 | 4.0 | 2.6 |
| SGA + CD | 3.0 | 1.7 | 2.8 | 1.7 |
| PTB + SGA + CD | 0.7 | 0.5 | 1.0 | 0.5 |
Adjusted (matched) ORs for each risk factor indicated modest associations with ASD (Table 3). Moreover, within both cohorts, nearly all the 18 stratum-specific ORs were greater than 1.0 (although some CLs included 1.0), indicating that children with ASD were more likely to have each risk factor alone or together with other risk factors. The summary OR for having at least one of the factors was 1.4 for both cohorts.
Table 3. Total and sequential associations between ASD and perinatal risk factors.
| Risk factor(s) | 1994 Birth cohort | 2000 Birth cohort | ||||
|---|---|---|---|---|---|---|
|
|
|
|||||
| No. of exposed cases | No. of exposed controls | Matched ORs (95% CL) | No. of exposed cases | No. of exposed controls | Matched ORs (95% CL) | |
| Estimates for each risk factor overall | ||||||
| PTB | 95 | 1511 | 1.3 (1.0–1.6) | 176 | 2839 | 1.3 (1.1–1.5) |
| SGA | 79 | 1444 | 1.1 (0.9–1.4) | 161 | 2488 | 1.3 (1.1–1.6) |
| CD | 193 | 2927 | 1.5 (1.2–1.7) | 379 | 6074 | 1.4 (1.2–1.5) |
| Estimates for risk factor sequences | ||||||
| PTB, when SGA = no and CD = no | 65 | 1010 | 1.5 (1.1–2.0) | 99 | 1854 | 1.2 (1.0–1.5) |
| PTB, when SGA = yes and CD = no | 8 | 104 | 2.2 (0.9–5.5) | 11 | 172 | 1.0 (0.5–2.1) |
| PTB, when SGA = no and CD = yes | 17 | 332 | 0.7 (0.4–1.3) | 53 | 686 | 1.4 (1.0–1.9) |
| PTB, when SGA = yes and CD = yes | 5 | 65 | 1.7 (0.5–6.3) | 13 | 127 | 1.0 (0.4–2.2) |
| SGA, when PTB = no and CD = no | 45 | 1030 | 1.0 (0.7–1.4) | 100 | 1724 | 1.3 (1.1–1.6) |
| SGA, when PTB = yes and CD = no | 8 | 104 | 1.2 (0.5–2.7) | 11 | 172 | 1.6 (0.8–3.3) |
| SGA, when PTB = no and CD = yes | 21 | 245 | 1.4 (0.8–2.3). | 37 | 465 | 1.3 (0.9–2.0) |
| SGA, when PTB = yes and CD = yes | 5 | 65 | 1.7 (0.5–5.5) | 13 | 127 | 1.4 (0.7–3.0) |
| CD, when PTB = no and SGA = no | 150 | 2285 | 1.5 (1.2–1.8) | 276 | 4796 | 1.3 (1.1–1.5) |
| CD, when PTB = yes and SGA = no | 17 | 332 | 0.7 (0.4–1.3) | 53 | 686 | 1.5 (1.0–2.2) |
| CD, when PTB = no and SGA = yes | 21 | 245 | 1.9 (1.0–3.5) | 37 | 465 | 1.3 (0.9–2.0) |
| CD, when PTB = yes and SGA = yes | 5 | 65 | 0.3 (0.0–2.8) | 13 | 127 | 2.2 (0.7–7.1) |
| PTB or SGA, when CD = no | 118 | 2144 | 1.3 (1.0–1.6) | 210 | 3750 | 1.3 (1.1–1.5) |
| PTB or SGA, when CD = yes | 43 | 642 | 1.0 (0.7–1.5) | 103 | 1278 | 1.4 (1.1–1.8) |
| PTB or CD, when SGA = no | 232 | 3627 | 1.5 (1.3–1.8) | 428 | 7336 | 1.3 (1.2–1.5) |
| PTB or CD, when SGA = yes | 34 | 414 | 2.1 (1.3–3.6) | 61 | 764 | 1.2 (0.9–1.8) |
| SGA or CD, when PTB = no | 216 | 3560 | 1.4 (1.2–1.7) | 413 | 6985 | 1.4 (1.2–1.5) |
| SGA or CD, when PTB = yes | 30 | 501 | 0.9 (0.6, 1.5) | 77 | 985 | 1.5 (1.1, 2.1) |
| Summary estimates | ||||||
| PTB or SGA or CD | 311 | 5071 | 1.4 (1.2–1.7) | 589 | 9824 | 1.4 (1.2–1.5) |
For the 1994 cohort, average PAFs for PTB, SGA, and CD were 4.2%, 0.9%, and 7.9% respectively, with a summary PAF of 13.0% (7.7%–19.5%) (Table 4 and Fig. 1). For the 2000 cohort, average PAFs for PTB, SGA, and CD were 2.0%, 3.1%, and 6.7%, respectively, with a summary PAF of 11.8% (7.5%–15.9%). The slight difference in summary PAFs between cohorts was not statistically significant. Subgroup analyses for both cohorts (Table 4) were suggestive of a slightly higher summary PAF for ASD cases with co-occurring ID; however, CLs for the two subgroups with and without ID overlapped and the large PAF difference for the subgroup with ID unknown is difficult to interpret. The findings for males versus females were imprecise and inconsistent.
Table 4. Average and summary ASD PAFs for PTB, SGA, and CD.
| Risk factor(s) | 1994 Birth cohort | 2000 Birth cohort | Change in PAF (95% CL*) | ||
|---|---|---|---|---|---|
|
|
|
||||
| No. of cases | Average PAF, % (95% CL*) | No. of cases | Average PAFs, % (95% CL*) | ||
| PTB | 703 | 4.2 (0.0† to 8.7)‡ | 1339 | 2.0 (0.0 to 4.0) | |
| SGA | 703 | 0.9 (0.0 to 3.5)‡ | 1339 | 3.1 (1.0 to 5.0) | |
| CD | 703 | 7.9 (6.2 to 9.5)‡ | 1339 | 6.7 (3.0 to 10.0) | |
| PTB or SGA or CD (summary measure) | 703 | 13.0 (7.7 to 19.5) | 1339 | 11.8 (7.5 to 15.9) | 1.2 (−9.3 to 5.4) |
| Subgroup analyses: summary PAFs | |||||
| ASD with ID | 234 | 12.3 (1.8 to 23.0) | 377 | 17.1 (8.5 to 25.9) | 4.8 −9.1 to 18.6) |
| ASD without ID | 305 | 9.6 (0.8 to 18.6) | 680 | 12.2 (6.2 to 18.5) | 2.6 −8.3 to 13.1) |
| ASD, ID Unknown | 164 | 20.5 (9.0 to 31.7) | 282 | 3.4 (0.0 to 12.7) | −17.1 (−31.3 to −2.3) |
| Males | 580 | 13.6 (6.9 to 20.2) | 1116 | 10.8 (6.2 to 15.4) | −2.8 (−11.2 to 4.8) |
| Females | 123 | 10.2 (0.0 to 24.8) | 223 | 16.3 (6.1 to 26.8) | 6.1 (−12.0 to 24.3) |
Bootstrap CLs based on 1000 replications. A 95% CL was estimated as the 2.5 and 97.5 percentiles of the 1000 replica estimates; each resampled data set comprised case-control sets from the original study sample randomly selected with replacement.
For average PAF estimates, lower bound of CL is reported as 0.0 for all instances in which lower bound estimate was <0.0.
Bootstrap CL could not be directly estimated due to small sample sizes. A hybrid method was used in which information gleaned from the 2000 birth cohort variance estimation was applied to the 1994 cohort data.
Fig. 1.
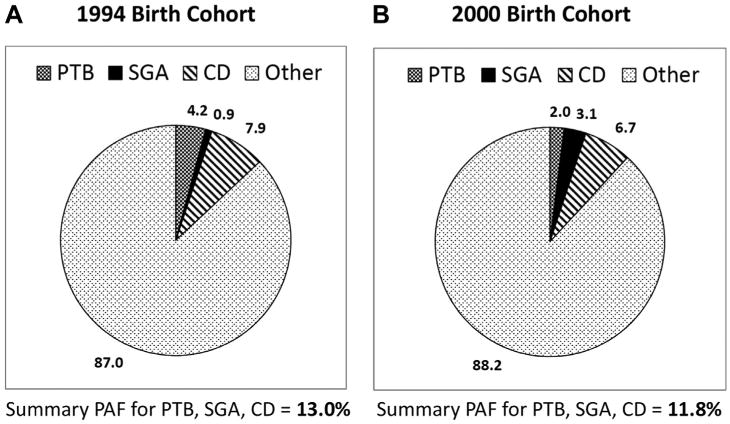
Average and summary ASD PAFs for PTB, SGA, and CD for the 1994 birth cohort (part A) and 2000 birth cohort (part B).
Discussion
The trend of increasing prevalence of diagnosed/identified ASDs has not yet abated [2–4]. We recently developed a mathematical model to quantify possible contributions of given risk factors to the trend and assessed several factors in depth including PTB, SGA, and CD [12]. We demonstrated that none contributed substantively to the recent ASD prevalence increases. Nonetheless, relative associations between ASD and each factor are well documented [12]. Thus, these factors might still contribute to the population prevalence of ASD at a point in time. In addition, the individual PAFs for ASD risk factors might change over time (if the magnitude of the risk factor-ASD association or proportion of exposed cases changes).
We found that 12%–13% of ASDs among children born in 1994 and 2000 in the 48 U.S. counties represented in this analysis were attributable to the underlying pathways leading to PTB, SGA, and/or CD. There was no change over time in this summary PAF. Nonetheless, individual PAFs fluctuated slightly. Both the ORs and proportion of cases “exposed” to SGA overall and alone (i.e., without either PTB or CD) increased between 1994 and 2000, resulting in an increase in average PAF. Conversely, the ORs and proportion of cases exposed to CD decreased slightly resulting in a slight decrease in average PAF. Finally, although ORs for PTB did not change over time, the proportion exposed to PTB alone decreased notably, which again resulted in a decrease in average PAF. The increase in the PAF for SGA offset the declines in PAFs for CD and PTB. Thus, the summary PAF, which more globally represents suboptimal perinatal environment, remained stable.
This study has several strengths including use of data from a well-defined consistent population at two time points, use of a matched design to efficiently consider potential confounders, and use of a rigorous PAF estimation methodology that addressed inherent biases present in most PAF studies. By calculating average PAFs that considered three factors as a risk factor set, rather than separately calculating adjusted PAFs, we accounted for the known co-occurrence between perinatal factors.
Several study limitations should also be considered. Average PAF estimation methodology becomes computationally intensive for assessment of more than three risk factors. We examined three prevalent but heterogeneous perinatal risk factors, each with multiple potential underlying pathways. For example, it is unknown whether the PTB-ASD association is directly causal or represents another mechanism such as maternal infection or inflammation. Likewise, the PAF for CD represents a composite of all reasons for having a CD along with any direct effects. Thus, although the findings are informative on a population level, they do not indicate which etiologic subgroups of PTB, SGA, and CD most contribute to ASD. This is perhaps particularly important with regard to CD, as these study findings point to risk contributions from a suboptimal perinatal environment generally but are not sufficiently detailed to make recommendations about any specific clinical practices. Currently, none of the available software for calculating average PAFs includes variance estimation when confounder adjustment is taken into account. Thus, we developed a general CL estimation method based on a bootstrap sampling technique. In addition to being computationally complex, we encountered sample size constraints, necessitating the development of a hybrid method for some estimations. Nonetheless, to our knowledge, this is the first study to report the precision of average PAF estimates. Finally, generalizability should be considered, given our study population was limited to NHW, NHB, and Hispanic children born in singleton deliveries in 48 U.S. counties from eight states.
For most sites included in our study population, the ASD prevalence was near the ADDM average; however, some sites with lower-and higher-than-average prevalence estimates were also included [2]. Our study populations for both cohorts were comparable with the total ADDM populations on sex and maternal age (data not shown). The 2000 birth cohort was also comparable on race-ethnicity and maternal education, although proportions of His-panics and advanced maternal education were slightly lower for the 1994 cohort study population. For both cohorts, our study populations had slightly lower preterm and SGA rates and slightly higher CD rates than the total ADDM populations. The risk factor-ASD matched ORs reported here (1.1–1.5, for each perinatal factor overall) are in line with previous studies, albeit toward the more conservative end of the range of estimates we recently reported from a systematic literature review [12]. Thus, PAFs for other U.S. populations might vary slightly from those reported here. Because we noted variability in risk factor prevalences across the eight included sites, we conducted sensitivity analyses in which we recalculated PAFs after removing each site's data; none of these findings were substantively different from the original (data not shown).
This study establishes that perinatal risk factors (or suboptimal perinatal environment) make a notable contribution to ASD risk in a U.S. population. However, a large proportion (87%) of the ASD burden was not attributed to the three factors we examined. Further study is needed to investigate PAFs in other populations, for other risk factors, and in the context of gene-environment interactions. The summary and average PAFs reported here represent the impact of this risk factor set on the population burden of ASD. Complete prevention of these risk factors in the population would be necessary to reduce the ASD prevalence by the proportion suggested by the PAFs. Given that complete elimination of PTB, SGA, and CD is improbable, potential impact fractions could be estimated in future research assessing the relative efficacy of interventions for PTB, SGA, and CD.
Appendix. Sample selection steps by birth cohort
| Selection criteria | 1994 Birth cohort (ascertained as having ASD in 2002 ADDM) | 2000 Birth cohort (ascertained as having ASD in 2008 ADDM) | ||||
|---|---|---|---|---|---|---|
|
|
|
|||||
| No. of sites | No. of counties | No. of cases | No. of sites | No. of counties | No. of cases | |
| Selection of final study population (population to which results can be generalized) | ||||||
| ADDM sites included in both 2002 and 2008 surveillance years | 13 | 175 | 2529 | 13 | 98 | 3609 |
| Limit to: counties included in both 2002 and 2008* | 13 | 94 | 1825 | 13 | 94 | 3285 |
| Limit to: children residing in same county at birth and age 8† | 10 | 69 | 951 | 10 | 69 | 1880 |
| Limit to: ADDM site that provided all necessary study variables | 8 | 48 | 786 | 8 | 48 | 1551 |
| Limit to: singletons | 8 | 48 | 762 | 8 | 48 | 1489 |
| Limit to: race-ethnicity NHW, NHB, Hispanic | 8‡ | 48 | 747 | 8 | 48 | 1406 |
| Sample exclusions | ||||||
| Children excluded if they lacked data on any study variable | 726 | 1386 | ||||
| Children in matching stratum with <20 controls/case excluded§ | 703 | 1339 | ||||
Not all ADDM sites included the same counties in their surveillance area in 2002 and 2008.
In addition to limiting to children identified as ASD cases in ADDM who were linked to a birth record indicating birth residence was within the ADDM catchment area, this restriction also pragmatically limited our sample to ADDM sites that included the maternal county of residence indicator in their submitted ADDM-natality data set; three sites did not.
Final study population included NHW, NHB, and Hispanic children born as singletons in 48 counties within eight ADDM sites.
Twenty controls per case were selected using a matched design in which cases and controls were matched on five sociodemographic factors. Thus, for control selection, the study population was subdivided into numerous matching strata and some included a small number of births. The final sample selection criterion was birth within a study-matching stratum including a minimum of 20 potential controls.
Footnotes
Disclaimer: The findings and conclusions in this report are those of the authors and do not necessarily represent the official position of the Centers for Disease and Control and Prevention.
References
- 1.American Psychiatric Association. Diagnostic and statistical manual of mental disorders: DSM-IV-TR. 4th. Washington, DC: American Psychiatric Association; 2000. American Psychiatric Association. Task Force on DSM-IV. [Google Scholar]
- 2.Autism and Developmental Disabilities Monitoring Network Surveillance Year 2008 Principal Investigators. Centers for Disease Control and Prevention. Prevalence of autism spectrum disorders—Autism and Developmental Disabilities Monitoring Network, 14 sites, United States, 2008. MMWR Surveill Summ. 2012;61(3):1–19. [PubMed] [Google Scholar]
- 3.Blumberg SJ, Bramlett MD, Kogan MD, Schieve LA, Jones JR, Lu MC. National health statistics reports. 65. Hyattsville, MD: National Center for Health Statistics; 2013. Changes in prevalence of parent-reported autism spectrum disorder in school-aged U.S. children: 2007 to 2011–2012. [PubMed] [Google Scholar]
- 4.Schieve LA, Rice C, Yeargin-Allsopp M, Boyle CA, Kogan MD, Drews C, et al. Parent-reported prevalence of autism spectrum disorders in US-born children: an assessment of changes within birth cohorts from the 2003 to the 2007 National Survey of Children's Health. Matern Child Health J. 2012;16(Suppl 1):S151–7. doi: 10.1007/s10995-012-1004-0. [DOI] [PubMed] [Google Scholar]
- 5.Baron-Cohen S, Scott FJ, Allison C, Williams J, Bolton P, Matthews FE, et al. Prevalence of autism-spectrum conditions: UK school-based population study. Br J Psychiatry. 2009;194(6):500–9. doi: 10.1192/bjp.bp.108.059345. [DOI] [PubMed] [Google Scholar]
- 6.Lazoff T, Zhong L, Piperni T, Fombonne E. Prevalence of pervasive developmental disorders among children at the English Montreal School Board. Can J Psychiatry. 2010;55(11):715–20. doi: 10.1177/070674371005501105. [DOI] [PubMed] [Google Scholar]
- 7.Roelfsema MT, Hoekstra RA, Allison C, Wheelwright S, Brayne C, Matthews FE, et al. Are autism spectrum conditions more prevalent in an information-technology region? A school-based study of three regions in the Netherlands. J Autism Dev Disord. 2012;42(5):734–9. doi: 10.1007/s10803-011-1302-1. [DOI] [PubMed] [Google Scholar]
- 8.Brugha TS, McManus S, Bankart J, Scott F, Purdon S, Smith J, et al. Epidemiology of autism spectrum disorders in adults in the community in England. Arch Gen Psychiatry. 2011;68(5):459–65. doi: 10.1001/archgenpsychiatry.2011.38. [DOI] [PubMed] [Google Scholar]
- 9.Kim YS, Leventhal BL, Koh YJ, Frombonne E, Laska E, Lim EC, et al. Prevalence of autism spectrum disorders in a total population sample. Am J Psychiatry. 2011;168(9):904–12. doi: 10.1176/appi.ajp.2011.10101532. [DOI] [PubMed] [Google Scholar]
- 10.Miles JH. Autism spectrum disorders—a genetics review. Genet Med. 2011;13(4):278–94. doi: 10.1097/GIM.0b013e3181ff67ba. [DOI] [PubMed] [Google Scholar]
- 11.Hallmayer J, Cleveland S, Torres A, Phillips J, Cohen B, Torigoe T, et al. Genetic heritability and shared environmental factors among twin pairs with autism. Arch Gen Psychiatry. 2011;68(11):1095–102. doi: 10.1001/archgenpsychiatry.2011.76. [DOI] [PMC free article] [PubMed] [Google Scholar]
- 12.Schieve LA, Rice C, Devine O, Maenner MJ, Lee LC, Fitzgerald R, et al. Have secular changes in perinatal risk factors contributed to the recent autism prevalence increase? Development and application of a mathematical assessment model. Ann Epidemiol. 2011;21(12):930–45. doi: 10.1016/j.annepidem.2011.08.009. [DOI] [PMC free article] [PubMed] [Google Scholar]
- 13.Hagberg H, Gressens P, Mallard C. Inflammation during fetal and neonatal life: implications for neurologic and neuropsychiatric disease in children and adults. Ann Neurol. 2012;71(4):444–57. doi: 10.1002/ana.22620. [DOI] [PubMed] [Google Scholar]
- 14.Zerbo O, Iosif AM, Walker C, Ozonoff S, Hansen RL, Hertz-Picciotto I. Is maternal influenza or fever during pregnancy associated with autism or developmental delays? Results from the CHARGE (CHildhood Autism Risks from Genetics and Environment) Study. J Autism Dev Disord. 2013;43(1):25–33. doi: 10.1007/s10803-012-1540-x. [DOI] [PMC free article] [PubMed] [Google Scholar]
- 15.Croen LA, Grether JK, Yoshida CK, Odouli R, Hendrick V. Antidepressant use during pregnancy and childhood autism spectrum disorders. Arch Gen Psychiatry. 2011;68(11):1104–12. doi: 10.1001/archgenpsychiatry.2011.73. [DOI] [PubMed] [Google Scholar]
- 16.Ornoy A. Valproic acid in pregnancy: how much are we endangering the embryo and fetus? Reprod Toxicol. 2009;28(1):1–10. doi: 10.1016/j.reprotox.2009.02.014. [DOI] [PubMed] [Google Scholar]
- 17.Croen LA, Connors SL, Matevia M, Qian Y, Newschaffer C, Zimmerman AW. Prenatal exposure to β2-adrenergic receptor agonists and risk of autism spectrum disorders. J Neurodev Disord. 2011;3(4):307–15. doi: 10.1007/s11689-011-9093-4. [DOI] [PMC free article] [PubMed] [Google Scholar]
- 18.Roberts EM, English PB, Grether JK, Windham GC, Somberg L, Wolff C. Maternal residence near agricultural pesticide applications and autism spectrum disorders among children in the California Central Valley. Environ Health Perspect. 2007;115(10):1482–9. doi: 10.1289/ehp.10168. [DOI] [PMC free article] [PubMed] [Google Scholar]
- 19.Windham GC, Zhang L, Gunier R, Croen LA, Grether JK. Autism spectrum disorders in relation to distribution of hazardous air pollutants in the San Francisco bay area. Environ Health Perspect. 2006;114(9):1438–44. doi: 10.1289/ehp.9120. [DOI] [PMC free article] [PubMed] [Google Scholar]
- 20.Oken E, Kleinman KP, Rich-Edwards J, Gillman MW. A nearly continuous measure of birth weight for gestational age using a United States national reference. BMC Pediatr. 2003;3:6. doi: 10.1186/1471-2431-3-6. [DOI] [PMC free article] [PubMed] [Google Scholar]
- 21.Rockhill B, Newman B, Weinberg C. Use and misuse of population attributable fractions. Am J Public Health. 1998;88(1):15–9. doi: 10.2105/ajph.88.1.15. [DOI] [PMC free article] [PubMed] [Google Scholar]
- 22.Eide GE, Gefeller O. Sequential and average attributable fractions as aids in the selection of preventive strategies. J Clin Epidemiol. 1995;48(5):645–55. doi: 10.1016/0895-4356(94)00161-i. [DOI] [PubMed] [Google Scholar]
- 23.Gefeller O, Land M, Eide GE. Averaging attributable fractions in the multifactorial situation: assumptions and interpretation. J Clin Epidemiol. 1998;51(5):437–41. doi: 10.1016/s0895-4356(98)00002-x. [DOI] [PubMed] [Google Scholar]
- 24.Benichou J, Gail MH. Variance calculations and confidence intervals for estimates of the attributable risk based on logistic models. Biometrics. 1990;46:991–1003. [PubMed] [Google Scholar]
- 25.Gail DM. Interactive Risk Assessment Program. Version 2.2. [Accessed February 03, 2014];2002 Available from http://dceg.cancer.gov/tools/risk-assessment/irap.
- 26.SAS Institute Inc. SAS/STAT® 9.2 User's Guide. Cary, NC: SAS Institute Inc; 2008. [Google Scholar]
- 27.SAS Institute Inc. SAS® 9.2 Macro Language: Reference. Cary, NC: SAS Institute Inc; 2009. [Google Scholar]