

In anemic patients with chronic inflammatory conditions, the assessment of iron status and the selection of those who may benefit from iron therapy frequently presents diagnostic challenges.1,2 Traditional biochemical iron parameters, such as ferritin, serum iron and transferrin, are affected by inflammation making them less suitable indicators.3
Recently, iron parameters have become available that provide direct information on iron availability for erythropoiesis: the central iron regulatory hormone hepcidin4–7 and the hemoglobin content of reticulocytes and erythrocytes (Ret-He and RBC-He).8–11 We hypothesized that changes in these functional iron parameters shortly after start of iron supplements may predict an increase in hemoglobin in a longer course of iron supplements in patients with chronic inflammation.
Forty adult patients diagnosed with a chronic rheumatic disease and anemia were selected during routine visits in 2012 at the rheumatology outpatient clinic of the Radboud University Medical Center, Nijmegen, the Netherlands. Anemia was defined as a hemoglobin concentration below 12.1 g/dL for males and below 11.3 g/dL for female, respectively. Exclusion criteria were signs of hemolysis (increased levels of lactate dehydrogenase), end stage renal disease, liver disease (two times the upper limit of the reference value of alanine aminotransaminase (ALT)), known malignancies, vitamin B12 or folic acid deficiency, use of iron supplements, erythropoietin or medications with potential drug interactions with the iron supplements and a blood transfusion in the previous two months. Patients’ characteristics, including age, sex, medication and the type of inflammatory condition, were recorded at baseline (Table 1).
Table 1.
Base-line characteristics of study population.
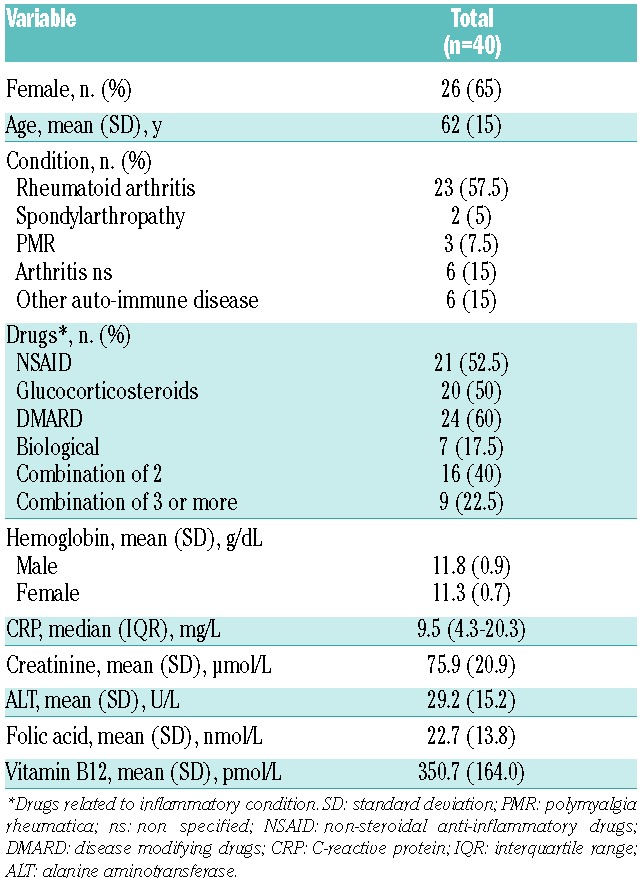
Rheumatoid arthritis was the most common diagnosis (58%) and disease-modifying drugs (60%) and non-steroidal anti-inflammatory drugs (53%) were frequently used. Ethical clearance was granted by the Radboud University Medical Center, and written informed consent was obtained from all participants.
Ferrofumarate 200 mg BD (130 mg of elemental iron per day) was prescribed during six weeks. Blood samples were collected at baseline, after one, two and six weeks. Responders to iron therapy were defined as patients with an increase in hemoglobin of at least 0.81 g/dL (0.5 mmol/L) after six weeks of oral iron supplementation. The hemoglobin content parameters were measured on a Sysmex XE5000 analyer (Sysmex Corporation). Serum hepcidin-25 measurements were performed using a combination of weak cation exchange chromatography and time-of-flight mass spectrometry as described previously.12 The other iron parameters were determined as previously described.7
At week 6, 2 patients had withdrawn from the study: one at personal request and one because of pneumonia. Sixteen of 38 participants who completed the study were responders. Responders had significantly lower base-line values of ferritin, hepcidin, Ret-He and RBC-He and transferrin saturation (TS), and higher total iron binding capacity (TIBC), soluble transferrin receptor (sTfR) and its ratio to log ferritin (sTfR-index) levels in comparison to non-responders (Figure 1). Levels of CRP were similar between the groups. At one week of iron therapy, responders had a significantly larger increase in Ret-He level (0.28 ± 0.26 fmol) compared to the non-responders (0.18 ±0.04 fmol) (P<0.000) and a larger change in reticulocyte numbers (Figure 1). There was no increase in Ret-He between weeks 1 and 2. In contrast, there were no significant differences in the change in hepcidin levels at either time point. Moreover, responders had significantly larger increases in serum iron and TS values at one week with a concurrent significant decline in sTfR-index levels after two weeks of iron therapy.
Figure 1.
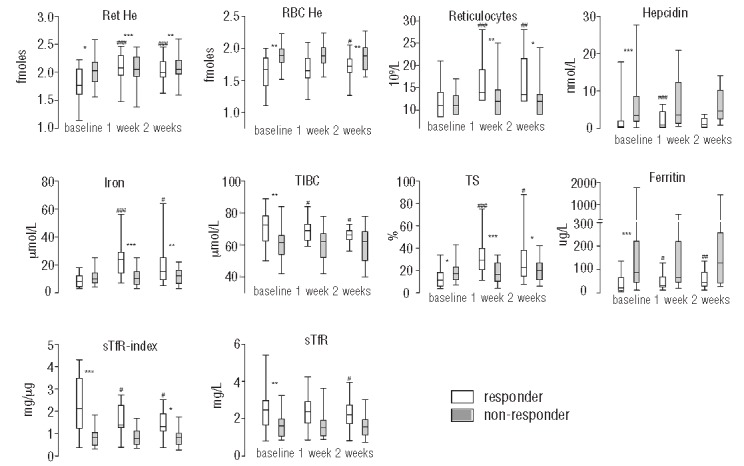
Box and whisker plots of iron status parameters at baseline and after one and two weeks of iron supplementation for responders (white) and non- responders (gray). *represent significant P- values of t-test comparisons or Mann Whitney tests between responders and non- responders. #represent significant P-values of paired samples t-test or Wilcoxon Signed Rank test comparisons between baseline and week one or week two of responders and non- responders. P-values xxx ≤ 0.001, xx ≤0.01, x <0.05. For abbreviations and SI conversion factors see Table 2. Reference values (when applicable): Ret- He 2.00- 2.41 fmoles, reticulocytes 20–80 109/L, hepcidin < 14.7 (males), < 12.3 nM (premenopausal females), <15.6 nM (postmenopausal women), iron 10–30 μmol/L, TIBC 45–80 μmol/L, ferritin 15–180 μg/L (males), 6–80 μg/L (premenopausal females), 15–280 μg/L (postmenopausal women), sTfR 0.76–1.76 mg/L.
Regression analyses were applied to predict the change in hemoglobin and the outcome of being a responder after six weeks of iron therapy. The strongest association with the hemoglobin response at six weeks was found for baseline RBC-He, ferritin, Ret-He and hepcidin levels, and the increase after one week in values of TS, serum iron, Ret-He, reticulocytes and ferritin, both in descending order (Table 2).
Table 2.
Prediction of the response to six weeks of iron therapy.
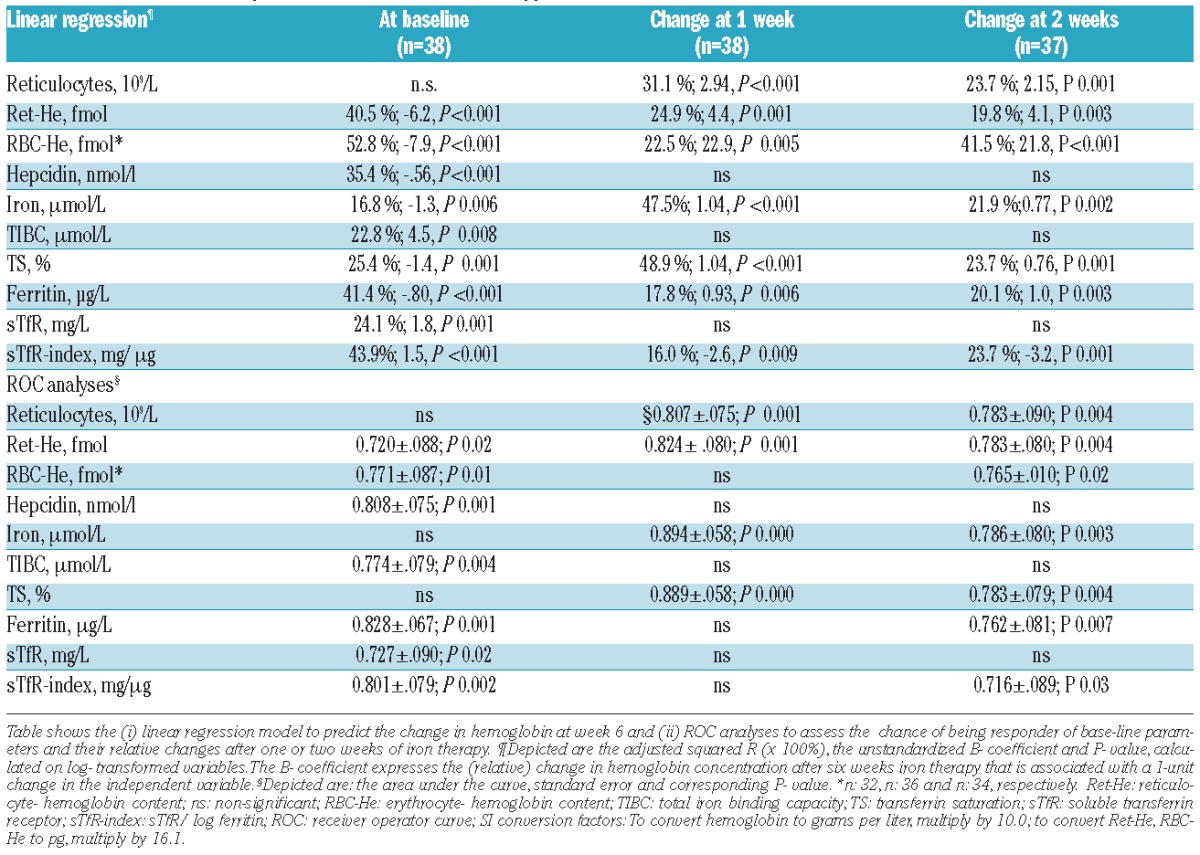
The diagnostic performance of parameters was subsequently assessed using Receiver Operating Characteristic (ROC) analyses. The change in values of serum iron, TS, Ret-He and reticulocytes at one week had the highest areas under the curve (AUC) (Table 2). At one week, an increase in serum iron and Ret-He of more than 4 mmol/L and 0.11 fmol, respectively, had a sensitivity of 80% and 81%, and specificity of 91% and 86%, respectively. At baseline, values of ferritin, hepcidin and the sTfR-index had the highest AUC values, but the change in these parameters at week 1 was not a useful predictor of the response to iron therapy. The combination of the change in values of Ret-He and TS at one week provided the highest discriminatory power (AUC 0.906, SE 0.054; P<0.000).
Overall, the increase after one week of oral iron therapy in Ret-He, TS, serum iron level and the reticulocyte count best predicted an increase in hemoglobin level of at least 0.81 g/dL at week 6 of iron therapy. Base-line values of ferritin, hepcidin, sTfR-index and RBC-He also predicted the hematopoietic response, but to a lesser degree.
There are still no established diagnostic criteria to identify absolute iron deficiency in patients with inflammation. Our study design is unique in that we evaluated the predictive value of iron status indicators in response to oral iron therapy in patients with rheumatic diseases. The value of Ret-He as a screening tool for ID has been recognized before7,13 and our current findings support its role as a marker for iron responsiveness. This may be of particular diagnostic value when results of conventional iron status parameters are inconclusive. The advantage of reticulocyte count and hemoglobin content parameters is that their results can be obtained quickly and extra blood tests are not required. However, before these hemoglobin content parameters can be widely implemented, additional research into the various patients’ groups and clinician education and training is required.14
Our study was designed with minimal inclusion criteria in order to maximize the generalizability of our results. Potential limitations are the self-reported drug compliance: i) the possible interaction of iron absorption with frequently used proton pump inhibitors (specific intake instructions were given); ii) the relatively modest degree of inflammation in our study population; and, finally, iii) the duration of iron treatment in our study may not have been sufficient to replete iron stores in all patients.
In conclusion, in anemic patients with a chronic rheumatologic disease, the increase in hemoglobin concentration to six weeks of iron supplementation was best predicted by the change in Ret-He, TS and serum iron levels and the reticulocyte count after one week of oral iron therapy. Prospective analysis of these parameters is especially useful when initial values of iron status indicators, such as a normal or elevated serum ferritin level, cannot be used to reliably exclude iron deficiency.
Footnotes
Information on authorship, contributions, and financial & other disclosures was provided by the authors and is available with the online version of this article at www.haematologica.org.
References
- 1.Weiss G, Goodnough LT. Anemia of chronic disease. N Engl J Med. 2005;352(10):1011–23. [DOI] [PubMed] [Google Scholar]
- 2.Goodnough LT, Nemeth E, Ganz T. Detection, evaluation, and management of iron-restricted erythropoiesis. Blood 2010;116(23): 4754–61. [DOI] [PubMed] [Google Scholar]
- 3.Northrop-Clewes CA. Interpreting indicators of iron status during an acute phase response-lessons from malaria and human immunodeficiency virus. Ann Clin Biochem. 2008;45(1):18–32. [DOI] [PubMed] [Google Scholar]
- 4.Kroot JJ, Tjalsma H, Fleming RE, Swinkels DW. Hepcidin in human iron disorders: diagnostic implications. Clin Chem. 2011;57(12): 1650–69. [DOI] [PubMed] [Google Scholar]
- 5.Sasu BJ, Li H, Rose MJ, Arvedson TL, Doellgast G, Molineux G. Serum hepcidin but not prohepcidin may be an effective marker for anemia of inflammation. Blood Cells Mol Dis. 2010;45(3):238–45. [DOI] [PubMed] [Google Scholar]
- 6.Theurl I, Aigner E, Theurl M, Nairz M, Seifert M, Schroll A, et al. Regulation of iron homeostasis in anemia of chronic disease and iron deficiency anemia: diagnostic and therapeutic implications. Blood 2009;113(21):5277–86. [DOI] [PubMed] [Google Scholar]
- 7.van Santen S, van Dongen-Lases EC, de Vegt F, et al. Hepcidin and hemoglobin content parameters in the diagnosis of iron deficiency in rheumatoid arthritis patients with anemia. Arthritis Rheum. 2011;63(12):3672–80. [DOI] [PubMed] [Google Scholar]
- 8.Mast AE, Blinder MA, Lu Q, Flax S, Dietzen DJ. Clinical utility of the reticulocyte hemoglobin content in the diagnosis of iron deficiency. Blood 2002;99(4):1489–91. [DOI] [PubMed] [Google Scholar]
- 9.Thomas C, Thomas L. Biochemical markers and hematologic indices in the diagnosis of functional iron deficiency. Clin Chem. 2002;48(7):1066–76. [PubMed] [Google Scholar]
- 10.Ullrich C, Wu A, Armsby C, Rieber S, Wingerter S, Brugnara C, et al. Screening healthy infants for iron deficiency using reticulocyte hemoglobin content. JAMA. 2005;294(8):924–30. [DOI] [PubMed] [Google Scholar]
- 11.Brugnara C, Mohandas N. Red cell indices in classification and treatment of anemias: from M.M. Wintrobes’s original 1934 classification to the third millennium. Curr Opin Hematol. 2013;20(3): 222–30. [DOI] [PubMed] [Google Scholar]
- 12.Kroot JJ, Laarakkers CM, Geurts-Moespot AJ, Grebenchtchikov N, Pickkers P, van Ede AE, et al. Immunochemical and mass-spectrometry-based serum hepcidin assays for iron metabolism disorders. Clin Chem. 2010;56(10):1570–9. [DOI] [PubMed] [Google Scholar]
- 13.Thomas DW, Hinchliffe RF, Briggs C, Macdougall IC, Littlewood T, Cavill I. Guideline for the laboratory diagnosis of functional iron deficiency. Br J Haematol. 2013;161(5):639–48. [DOI] [PubMed] [Google Scholar]
- 14.Piva E, Brugnara C, Chiandetti L, Plebani M. Automated reticulocyte counting: state of the art and clinical applications in the evaluation of erythropoiesis. Clin Chem Lab Med. 2010;48(10):1369–80. [DOI] [PubMed] [Google Scholar]