Abstract
Background
The relationships between dietary fiber, whole grains, carbohydrate, glycemic index (GI), glycemic load (GL), and prostate cancer risk are unclear. We conducted a systematic review and meta-analysis to investigate these associations.
Methods
Relevant studies were identified by a search of PubMed database and EMBASE database up to April 2015. A random effects model was used to calculate the summary relative risks (RRs) and their corresponding 95% confidence intervals (CIs).
Results
Twenty-seven epidemiological studies (18 case–control studies and nine cohort studies) were included in the final analysis. The pooled RRs of prostate cancer were 0.94 (95% CI 0.85–1.05, P=0.285), 1.13 (95% CI 0.98–1.30, P=0.095), 0.96 (95% CI 0.81–1.14, P=0.672), 1.06 (95% CI 0.96–1.18, P=0.254), and 1.04 (95% CI 0.91–1.18, P=0.590) for dietary fiber, whole grains, carbohydrate, GI, and GL, respectively. There was no evidence of significant publication bias based on the Begg’s test and Egger’s test.
Conclusion
The findings of this meta-analysis indicate that, based on available information, dietary fiber, whole grains, carbohydrate, GI, and GL are not associated with the risk of prostate cancer.
Keywords: prostate cancer, fiber, whole grains, carbohydrate, glycemic index, glycemic load
Introduction
Prostate cancer has the second highest incidence of all cancers in men after lung cancer worldwide, and it was estimated that prostate cancer alone accounted for ~14% of all newly diagnosed cancers in the world.1 Well-established risk factors for prostate cancer include age, race/ethnicity, and family history.2 In addition, physical activity, body mass index, hormones, and diet have been suggested to be associated with prostate cancer risk.
In various epidemiological studies, including case–control and cohort studies, the potential relationship between dietary fiber, whole grains, carbohydrate, glycemic index (GI), glycemic load (GL), and prostate cancer risk has been investigated with inconsistent findings. For example, Walker et al,3 Lewis et al,4 and Deschasaux et al5 reported an inverse association between fiber intake and prostate cancer risk. Augustin et al6 and Hu et al7 suggested a positive association between GI and prostate cancer risk. However, many other studies did not find such correlations.
To address the issues described earlier, we performed a systematic review and meta-analysis on dietary fiber, whole grains, carbohydrate, GI, GL, and risk of prostate cancer. Subgroup analyses were also carried out to identify possible variables or features moderating the results obtained.
Materials and methods
Search strategy
We searched PubMed database and EMBASE database up to April 2015 for all relevant studies with the following key words: fiber, fibre, grains, grain, carbohydrate, carbohydrates, GI, GL, glycaemic index, or glycaemic load combined with prostate cancer or prostate neoplasm. We also manually reviewed reference lists of retrieved articles and related reviews for additional pertinent studies. No language limitations were imposed.
Study selection
Studies included in this meta-analysis had to fulfill all the following criteria: 1) they had a cohort or case–control design; 2) the exposure of interest was dietary fiber, whole grains, carbohydrate, GI, or GL; 3) the outcome of interest was primary prostate cancer; and 4) studies provided the risk estimates with their 95% confidence intervals (CIs) or data to calculate them. If more than one publication from the same study population was available, the most recent and detailed study was included in this meta-analysis.
Quality assessment
The quality of included studies was evaluated by two authors with the Newcastle–Ottawa Scale (NOS) (http://www.ohri.ca/programs/clinical_epidemiology/oxford.asp). NOS is a nine-star instrument designed to assess the selection of study population, study comparability, and ascertainment of either the exposure or the outcome of interest for case–control or cohort studies, respectively. The possible scores vary from 0 to 9. We used these scores to differentiate higher (7–9) from lower (0–6) quality studies.
Data extraction
The following data were extracted independently by two authors from each study: the first author’s last name, year of publication, study country, study design, sample size, age, types of exposure, the risk estimates with their corresponding 95% CIs, and matched or adjusted variables. From each study, we extracted the risk estimate that was most fully adjusted for potential confounders.
Statistical analysis
Considering that the absolute risk of prostate cancer is low, the odds ratio (OR) was assumed approximately the same as relative risk (RR), and the RR was used as the study outcome. Summary RR estimates with their corresponding 95% CIs for the highest versus the lowest level of fiber, whole grains, carbohydrate, GI, and GL were calculated with the DerSimonian and Laird random effect model,8 which take into account both within-study and between-study variation. Subgroup analyses were performed by study design and geographic region. Heterogeneity between studies was assessed by Q statistic (significance level at P<0.10) and I2 (I2<25%, no heterogeneity; I2=25%–50%, low heterogeneity; I2=50%–75%, moderate heterogeneity; I2>75%, large or extreme heterogeneity).9 A sensitivity analysis was carried out whereby each study was removed in turn and the combined estimate recalculated to determine the influence of each study. Publication bias was tested by Begg’s test10 and Egger’s test.11 A two-tailed P<0.05 was considered to be representative of a significant statistical publication bias. All the statistical analyses were conducted with STATA 12.0 (StataCorp LP, College Station, TX, USA).
Results
Study selection
Figure 1 shows a flow diagram of the procedure used to identify potentially relevant studies. Searches of the electronic databases yielded 3,369 articles. After carefully reading the titles and abstracts, 3,344 studies that were obviously unrelated to our topic were excluded. Then, we reviewed the full text of the remaining 25 articles and six articles were excluded with the following reasons: duplicate population (n=2), lacking control group (n=1), and lacking sufficient data (n=3). Eight studies were identified through checking reference lists of retrieved studies. Finally, the present study included 27 epidemiological studies.3–7,12–33
Figure 1.
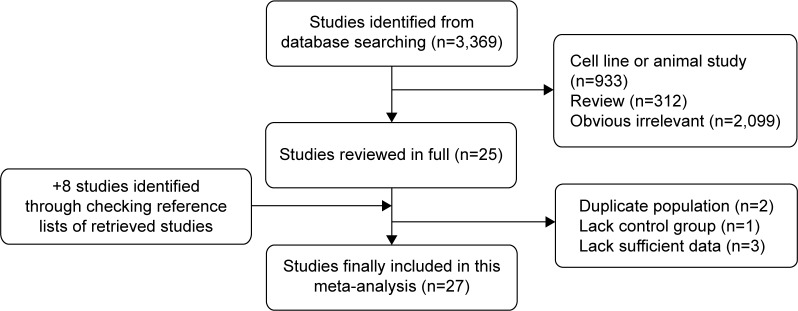
Flow diagram of identification of relevant studies.
Characteristics of the included studies
The main clinical features of these 27 eligible studies are summarized in Table 1. These studies were published between 1988 and 2015, including 18 case–control and nine cohort studies. Thirteen articles evaluated patients from North America, ten from Europe, two from Asia, one from Africa, and one from South America. The total number of prostate cancer patients was 39,352. Fiber was reported in 16 studies, whole grains reported in eight studies, carbohydrate reported in 13 studies, GI reported in six studies, and GL reported in five studies. Although the number of studies included in GI and GL was limited, the sample sizes were large with a total of 26,656 and 26,500 prostate cancer patients for GI and GL, respectively. In addition, these studies had high quality (mean NOS =6.8 and 7 for GI and GL, respectively) and adjusted major confounding.
Table 1.
Main characteristics of the studies included in this meta-analysis
| Study | Year | Country | Cases | Controls or cohort | Age (years) | Quality score | Type of exposure | Matched or adjusted variables |
|---|---|---|---|---|---|---|---|---|
| Sawada et al13 | 2015 | Japan | 825 | 43,435 | 45–74 | 8 | Fiber | Age, public health center area, smoking status, drinking frequency, marital status, BMI, and intake of green tea, genistein, SFAs, and carbohydrate |
| Vidal et al12 | 2015 | USA | 156 | 274 | 63 (SD 6.0) | 6 | Fiber, carbohydrate, GI | Age, race, family history, caloric intake, carbohydrate/fiber intake, BMI, diabetes, physical activity, alcohol, and smoking status |
| Deschasaux et al5 | 2014 | France | 139 | 3,313 | 63 | 8 | Fiber | Age, energy intake without alcohol, intervention group, number of 24-h dietary records, smoking, educational level, physical activity, height, BMI, alcohol intake, family history, PSA calcium intake, processed meat intake, tomato product intake, vitamin E intake, and blood selenium |
| Hu et al7 | 2013 | Canada | 1,799 | 5,039 | 67 | 7 | GI, GL | 10-year age group, province, education, BMI, alcohol consumption, pack-year smoking, and energy intake (noncarbohydrate and alcohol) |
| Drake et al14 | 2012 | Sweden | 817 | 8,128 | 45–73 | 7 | Fiber, carbohydrate, whole grains | Age, year of study entry, season of data collection, energy intake, height, waist, physical activity, smoking, educational level, birth in Sweden, alcohol, calcium, and selenium |
| Egeberg et al18 | 2011 | Denmark | 1,081 | 26,691 | 50–64 | 7 | Whole grains | Height, weight, school education, intake of red meat, processed meat and dairy products, and smoking status |
| Hardin et al17 | 2011 | USA | 470 | 512 | 65.8 (SD 8.3) | 6 | Whole grains | Age, race, institution, energy intake, and history of first-degree relative with prostate cancer |
| Nimptsch et al16 | 2011 | USA | 5,112 | 49,934 | 40–75 | 7 | Fiber, whole grains, GI, GL | Age, BMI, height, history of diabetes, family history, race/ethnicity, smoking, vigorous physical activity, energy intake, alcohol intake, calcium intake, alpha-linolenic acid, and tomato sauce |
| Shikany et al15 | 2011 | USA | 2,436 | 30,482 | 55–74 | 8 | Carbohydrate, GI, GL | Age, year of entry, race, center, compliant for baseline screen, marital status, BMI, vigorous physical activity, smoking, history of diabetes, history of cancer, aspirin use, family history, any prostate problems, prior PSA test, prostate biopsy prior to entry, and dietary factors |
| Hu et al19 | 2010 | Canada | 1,797 | 2,547 | 20–76 | 7 | Carbohydrate | Age, province, education, family income, BMI, total alcohol intake, and total energy intake |
| Lewis et al4 | 2009 | USA | 478 | 382 | 63.3 (SD 8.2) 66.9 (SD 8.1) | 6 | Fiber, carbohydrate, whole grains | Age, education, BMI, smoking history, family history of prostate cancer in first-degree relatives, and total caloric intake |
| Suzuki et al20 | 2009 | Multicenter | 2,747 | 142,590 | 52 | 8 | Fiber | Study center, age, energy intake, height, weight, smoking, education, and marital status |
| George et al21 | 2009 | USA | 15,949 | 262,642 | 50–71 | 7 | GI, GL | Age, race/ethnicity, education, marital status, BMI, family history of any cancer, physical activity, smoking, alcohol consumption, and energy intake |
| McCann et al23 | 2005 | USA | 433 | 538 | NA | 6 | Fiber, carbohydrate | Age, county of residence, education, BMI, cigarette smoking status, total energy, and vegetable intake |
| Walker et al22 | 2005 | Canada | 80 | 334 | 65.0 (SD 6.0) | 5 | Fiber, carbohydrate | Age, alcohol intake, carbohydrate/fiber, total energy, protein, fat, cholesterol, and calcium |
| Pelucchi et al24 | 2004 | Italy | 1,294 | 1,451 | 66 (46–74) | 6 | Fiber | Age, study center, education, family history, smoking, alcohol consumption, and energy intake |
| Augustin et al6 | 2004 | Italy | 1,204 | 1,352 | 66 (46–74) | 6 | GI, GL | Age, study center, education, family history, energy intake, alcohol consumption, smoking, BMI, occupational physical activity at 50 years, intake of fiber, and intake of lycopene |
| Lu et al25 | 2001 | USA | 65 | 132 | 59.98 | 5 | Fiber | Age, race, education, alcohol drinking, smoking, family history, and total dietary caloric intake |
| Ramon et al26 | 2000 | Spain | 217 | 434 | ≤80 | 6 | Fiber, carbohydrate | Age, residence, calories, family history, and BMI; carbohydrate further adjusted for total protein and total fat intake |
| Chan et al27 | 2000 | Finland | 184 | 27,062 | 50–69 | 7 | Carbohydrate | Supplementation group, education, age, BMI, energy, and number of years as a smoker |
| Deneo-Pellegrini et al29 | 1999 | Uruguay | 175 | 233 | 40–89 | 6 | Fiber, carbohydrate, whole grains | Age, residence, urban/rural status, education, family history, BMI, and total energy intake |
| Jain et al28 | 1999 | Canada | 617 | 636 | 69.8 | 7 | Whole grains | Total energy, vasectomy, age, ever-smoked, marital status, study area, BMI, education, ever-used multivitamin supplements, area of study, and log-converted amounts for grains, fruit, vegetables, total plants, total carotenoids, folic acid, dietary fiber, conjugated linoleic acid, vitamin E, vitamin C, retinol, total fat, and linoleic acid |
| Chatenoud et al30 | 1998 | Italy | 127 | 7,990 | <75 | 6 | Whole grains | Age, sex, education, smoking, alcohol, and BMI |
| Andersson et al31 | 1996 | Sweden | 526 | 536 | 70.7 (SD 5.9) | 6 | Fiber, carbohydrate | Age and energy |
| Walker et al3 | 1992 | South Africa | 166 | 166 | 69.2 (SD 8.9) | 5 | Fiber | Age and residence |
| West et al32 | 1991 | USA | 358 | 679 | 45–74 | 6 | Carbohydrate | Since interaction and confounding did not exist, crude ORs are presented |
| Oishi et al33 | 1988 | Japan | 100 | 100 | 50–79 | 5 | Fiber, carbohydrate | Age, date of admission |
Abbreviations: BMI, body mass index; SD, standard deviation; GI, glycemic index; h, hours; PSA, prostate specific antigen; GL, glycemic load; ORs, odds ratios; SFAs, saturated fatty acids; NA, not available.
Quantitative synthesis
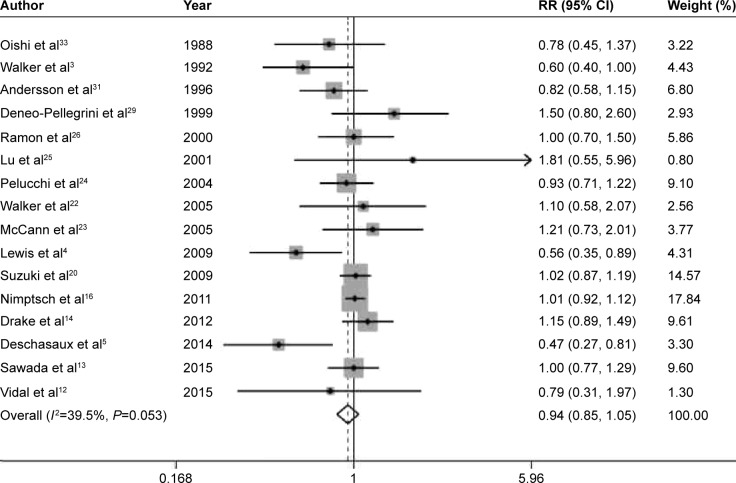
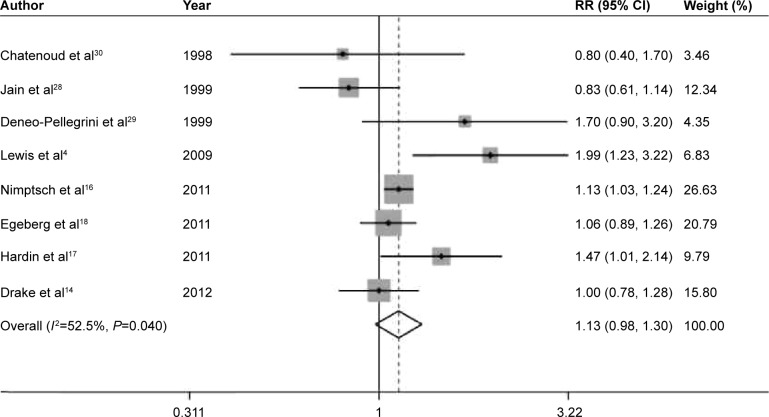
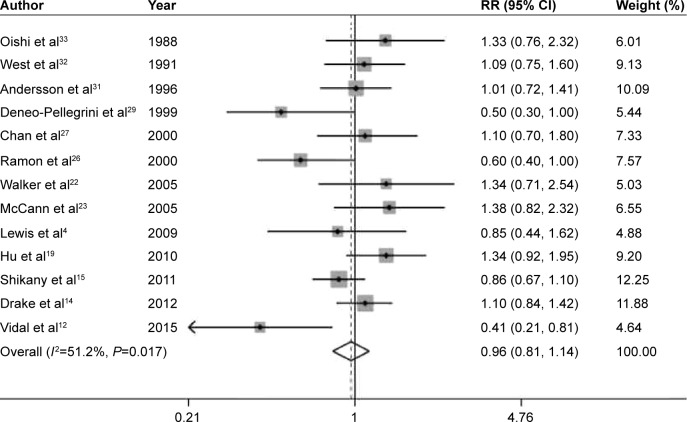
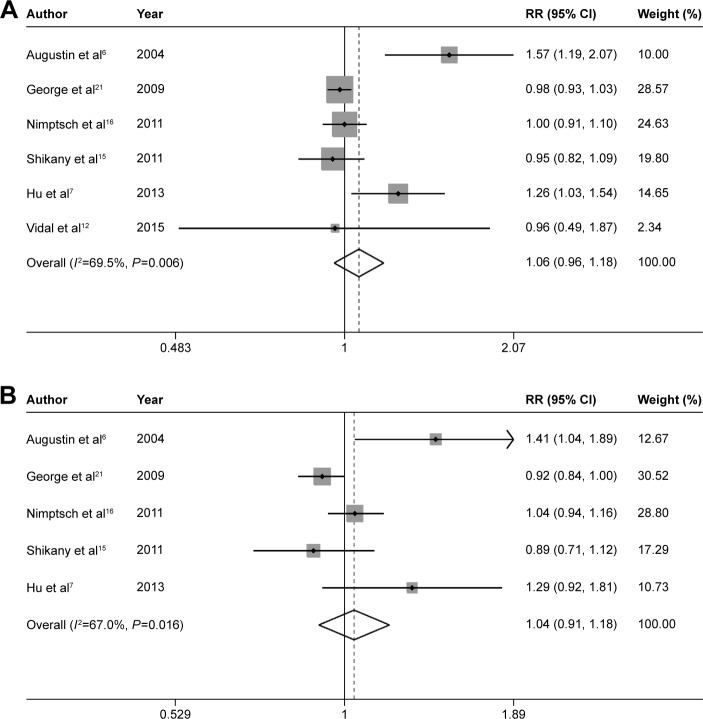
The pooled RRs of prostate cancer were 0.94 (95% CI 0.85–1.05, P=0.285), 1.13 (95% CI 0.98–1.30, P=0.095), 0.96 (95% CI 0.81–1.14, P=0.672), 1.06 (95% CI 0.96–1.18, P=0.254), and 1.04 (95% CI 0.91–1.18, P=0.590) for dietary fiber (Figure 2), whole grains (Figure 3), carbohydrate (Figure 4), GI (Figure 5A), and GL (Figure 5B), respectively.
Figure 2.
Summary RR of fiber intake and prostate cancer risk.
Note: Weights are from random effects analysis.
Abbreviations: RR, relative risk; CI, confidence interval.
Figure 3.
Summary RR of whole grains intake and prostate cancer risk.
Note: Weights are from random effects analysis.
Abbreviations: RR, relative risk; CI, confidence interval.
Figure 4.
Summary RR of carbohydrate intake and prostate cancer risk.
Note: Weights are from random effects analysis.
Abbreviations: RR, relative risk; CI, confidence interval.
Figure 5.
Summary RRs of GI (A), GL (B), and prostate cancer risk.
Note: Weights are from random effects analysis.
Abbreviations: RRs, relative risks; GI, glycemic index; GL, glycemic load; CI, confidence interval.
In the stratified analysis by study design and region, significant associations were observed for whole grains intake in cohort studies (RR =1.10, 95% CI 1.02–1.19, P=0.014), GI in case–control studies (RR =1.34, 95% CI 1.10–1.62, P=0.004), and GL in case–control studies (RR =1.36, 95% CI 1.08–1.70, P=0.008) (Table 2). For dietary fiber, we further conducted stratified analysis by the types of fiber. The pooled RRs of prostate cancer were 0.86 (95% CI 0.59–1.26, P=0.452), 0.93 (95% CI 0.83–1.04, P=0.213), 0.92 (95% CI 0.76–1.10, P=0.353), and 0.82 (95% CI 0.57–1.16, P=0.258) for vegetable fiber, fruit fiber, soluble fiber, and insoluble fiber, respectively.
Table 2.
Pooled and subgroup analyses stratified by study design and area
| Fiber intake
|
Whole grains intake
|
Carbohydrate intake
|
GI
|
GL
|
|||||||||||
|---|---|---|---|---|---|---|---|---|---|---|---|---|---|---|---|
| Na | RR (95% CI) | I2 (%) | Na | RR (95% CI) | I2 (%) | Na | RR (95% CI) | I2 (%) | Na | RR (95% CI) | I2 (%) | Na | RR (95% CI) | I2 (%) | |
| Overall | 16 | 0.94(0.85–1.05) | 39.5 | 8 | 1.13 (0.98–1.30) | 52.5 | 13 | 0.96(0.81–1.14) | 51.2 | 6 | 1.06(0.96–1.18) | 69.5 | 5 | 1.04(0.91–1.18) | 67.0 |
| Study design | |||||||||||||||
| Cohort | 5 | 0.99(0.87–1.14) | 52.6 | 3 | 1.10(1.02–1.19) | 0.0 | 3 | 0.98(0.83–1.17) | 1.9 | 3 | 0.98(0.94–1.02) | 0.0 | 3 | 0.96(0.87–1.06) | 43.9 |
| Case-control | 11 | 0.89(0.75–1.06) | 27.6 | 5 | 1.27(0.87–1.86) | 69.4 | 10 | 0.94(0.73–1.20) | 60.1 | 3 | 1.34(1.10–1.62) | 22.1 | 2 | 1.36(1.08–1.70) | 0.0 |
| Area | |||||||||||||||
| Asia | 2 | 0.96(0.76–1.21) | 0.0 | 0 | – | – | 1.33 (0.76–2.32) | – | 0 | – | – | 0 | – | – | |
| Europe | 6 | 0.94(0.79–1.1 1) | 48.9 | 3 | 1.03 (0.90–1.18) | 0.0 | 4 | 0.96(0.75–1.22) | 44.5 | 1.57(1.19–2.07) | – | 1.41 (1.05–1.90) | – | ||
| North America | 6 | 0.95(0.75–1.21) | 35.8 | 4 | 1.22(0.93–1.61) | 72.5 | 7 | 1.00(0.78–1.29) | 54.5 | 5 | 1.00(0.94–1.07) | 33.8 | 4 | 0.98(0.88–1.10) | 53.0 |
Note:
The number of studies included.
Abbreviations: GI, glycemic index; GL, glycemic load; RR, relative risk; CI, confidence interval.
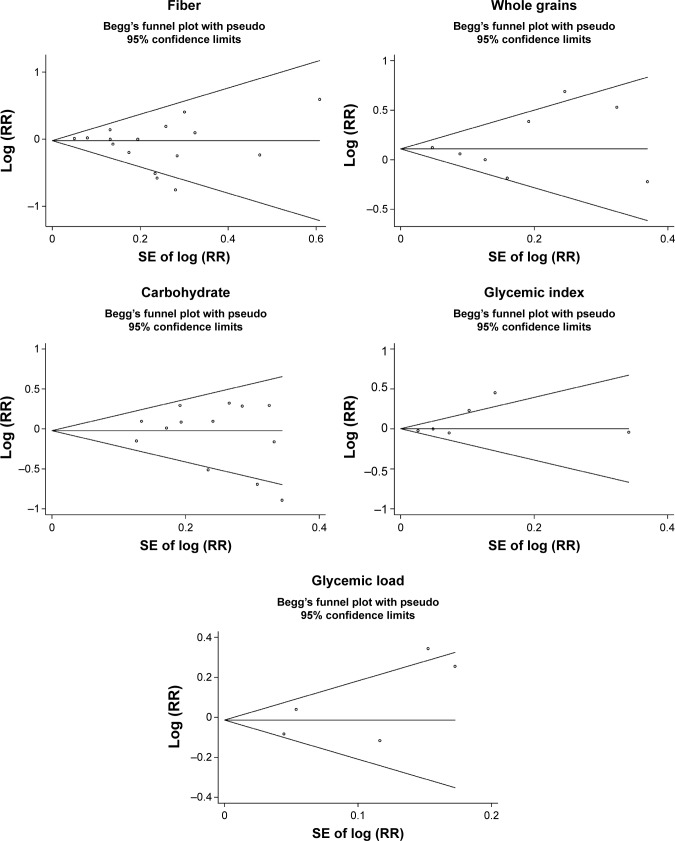
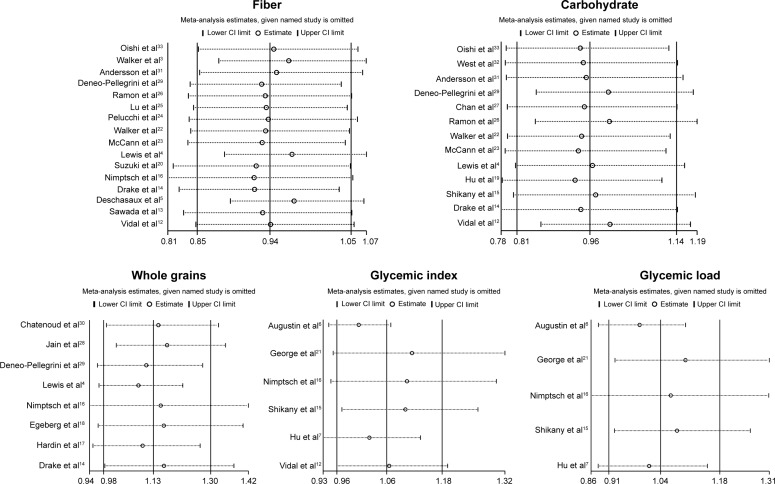
Low-to-moderate between-study heterogeneity was observed for dietary fiber (I2=39.5%), whole grains (I2=52.5%), carbohydrate (I2=51.2%), GI (I2=69.5%), and GL (I2=67.0%). There was no evidence of significant publication bias based on the Begg’s test and Egger’s test (fiber, PBegg =0.558, PEgger =0.545; whole grains, PBegg =1.000, PEgger =0.475; carbohydrate, PBegg =0.428, PEgger =0.598; GI, PBegg =0.260, PEgger =0.299; GL, PBegg =0.221, PEgger =0.247) (Figure 6). Sensitivity analysis was carried out by removing each study sequentially. As shown in Figure 7, for dietary fiber, carbohydrate, GI, and GL, all the pooled estimates were stable and not influenced by any included single study. However, for whole grains, the pooled estimate became statistically significant after removing the study by Jain et al.28
Figure 6.
Begg’s funnel plots of dietary fiber, whole grains, carbohydrate, GI, GL, and prostate cancer risk.
Abbreviations: GI, glycemic index; GL, glycemic load; RR, relative risk.
Figure 7.
Sensitivity analyses of dietary fiber, whole grains, carbohydrate, GI, GL, and prostate cancer risk.
Abbreviations: GI, glycemic index; GL, glycemic load; CI, confidence interval.
Discussion
This systematic review of epidemiological studies evaluated the potential association between dietary fiber, whole grains, carbohydrate, GI, GL, and prostate cancer risk based on nine prospective and 18 case–control studies. Overall, the summary RRs indicated that there was no clear relationship between the above factors and prostate cancer incidence, although a few results of stratified analysis were statistically significant.
In the pooled analysis, low-to-moderate between-study heterogeneity was observed, I2 ranging from 39.5% for dietary fiber to 69.5% for GI. Significant heterogeneity may be attributed to the study population, study design, sample size, method of exposure measurement, and adjustment for confounders. The presence of heterogeneity somewhat limited the interpretation of the results.
Up to now, the only fully established risk factors of prostate cancer are age, African–American ethnicity, and family history of prostate cancer.2 No lifestyle factors (eg, diet and exercise) have been conclusively confirmed as prostate cancer risk or protective factors, although many have been considered with supporting evidence. For example, physical activity in both occupational and recreational time has been associated with a decreased risk of prostate cancer.34 Another recent meta-analysis of cohort studies has indicated that high intakes of dairy products and dairy calcium may increase total prostate cancer risk.35 Conversely, consumption of dietary carrot36 and cruciferous vegetables37 might be inversely associated with prostate cancer risk.
As for dietary fiber, whole grains, and carbohydrate, several clinical and animal studies have indicated that they may play a role in prostate cancer development. Landberg et al38 reported that whole grains and bran from rye led to significantly lower plasma prostate specific antigen. Bylund et al39 suggested that factors in rye bran could inhibit prostate cancer growth. Mavropoulos et al40 and Freedland et al41 indicated that increased carbohydrate consumption may promote tumor growth and inhibit apoptosis of prostate cancer cells. However, our meta-analysis, based on all available epidemiologic studies, indicated no statistically significant relationships between dietary fiber, whole grains, carbohydrate, and prostate cancer risk.
Emerging studies also have evaluated the relationship between dietary fiber, whole grains, carbohydrate, GI, GL, and various types of other human diseases. Aune et al42 reported that there was an inverse association between dietary fiber intake and breast cancer risk. Yang et al43 suggested that fiber intake was associated with a reduced risk of all-cause mortality. Consumption of whole grains has been reported to be inversely associated with the risk of colorectal cancer44 and type 2 diabetes.45 GI and GL have been suggested to be related with the risk of breast cancer46 and digestive tract neoplasms.47 Therefore, dietary fiber, whole grains, carbohydrate, GI, and GL may only play a role in specific diseases.
Our study has several strengths. This meta-analysis included a large number of studies and more than 39,000 cases, which enhanced the statistical power. All included studies ascertained outcomes according to histologic findings. A recent meta-analysis reported that there was no clear association between carbohydrate intake and the risk of prostate cancer,48 which was in accordance with our study. However, we evaluated as many as five factors, including dietary fiber, whole grains, carbohydrate, GI, and GL.
Some limitations of this meta-analysis should be acknowledged. First, measurement errors in the assessment of exposure may bias the overall effect estimates. Second, residual confounding (ie, uncontrolled confounding) are always a concern in observational studies. Third, as discussed earlier, significant heterogeneity was observed among several analyses. Fourth, sensitivity analysis indicated that the summary estimate for whole grains was not stable and influenced by a single study. Finally, publication bias could not be ruled out as small studies with null results tend not to be reported.
Conclusion
Overall, the findings of this meta-analysis indicate that, based on available information, dietary fiber, whole grains, carbohydrate, GI, and GL are not associated with the risk of prostate cancer. To provide a more definitive conclusion, further prospective cohort studies with larger sample size, better exposure assessment, and longer follow-up are warranted in this area.
Acknowledgments
This study was supported from Public Welfare General Project of Huzhou Science and Technology Agency (2012YSB25).
Footnotes
Disclosure
The authors report no conflicts of interest in this work.
References
- 1.Jemal A, Bray F, Center MM, Ferlay J, Ward E, Forman D. Global cancer statistics. CA Cancer J Clin. 2011;61(2):69–90. doi: 10.3322/caac.20107. [DOI] [PubMed] [Google Scholar]
- 2.Bloom JR, Stewart SL, Oakley Girvan I, Banks PJ, Chang S. Family history, perceived risk, and prostate cancer screening among African American men. Cancer Epidemiol Biomarkers Prev. 2006;15(11):2167–2173. doi: 10.1158/1055-9965.EPI-05-0738. [DOI] [PubMed] [Google Scholar]
- 3.Walker AR, Walker BF, Tsotetsi NG, Sebitso C, Siwedi D, Walker AJ. Case-control study of prostate cancer in black patients in Soweto, South Africa. Br J Cancer. 1992;65(3):438–441. doi: 10.1038/bjc.1992.89. [DOI] [PMC free article] [PubMed] [Google Scholar]
- 4.Lewis JE, Soler-Vila H, Clark PE, Kresty LA, Allen GO, Hu JJ. Intake of plant foods and associated nutrients in prostate cancer risk. Nutr Cancer. 2009;61(2):216–224. doi: 10.1080/01635580802419756. [DOI] [PubMed] [Google Scholar]
- 5.Deschasaux M, Pouchieu C, His M, Hercberg S, Latino-Martel P, Touvier M. Dietary total and insoluble fiber intakes are inversely associated with prostate cancer risk. J Nutr. 2014;144(4):504–510. doi: 10.3945/jn.113.189670. [DOI] [PubMed] [Google Scholar]
- 6.Augustin LS, Galeone C, Dal Maso L, et al. Glycemic index, glycemic load and risk of prostate cancer. Int J Cancer. 2004;112(3):446–450. doi: 10.1002/ijc.20416. [DOI] [PubMed] [Google Scholar]
- 7.Hu J, La Vecchia C, Augustin LS, et al. Canadian Cancer Registries Epidemiology Research Group Glycemic index, glycemic load and cancer risk. Ann Oncol. 2013;24(1):245–251. doi: 10.1093/annonc/mds235. [DOI] [PubMed] [Google Scholar]
- 8.DerSimonian R, Laird N. Meta-analysis in clinical trials. Control Clin Trials. 1986;7(3):177–188. doi: 10.1016/0197-2456(86)90046-2. [DOI] [PubMed] [Google Scholar]
- 9.Higgins JP, Thompson SG. Quantifying heterogeneity in a meta-analysis. Stat Med. 2002;21(11):1539–1558. doi: 10.1002/sim.1186. [DOI] [PubMed] [Google Scholar]
- 10.Begg CB, Mazumdar M. Operating characteristics of a rank correlation test for publication bias. Biometrics. 1994;50(4):1088–1101. [PubMed] [Google Scholar]
- 11.Egger M, Davey Smith G, Schneider M, Minder C. Bias in meta-analysis detected by a simple, graphical test. BMJ. 1997;315(7109):629–634. doi: 10.1136/bmj.315.7109.629. [DOI] [PMC free article] [PubMed] [Google Scholar]
- 12.Vidal AC, Williams CD, Allott EH, et al. Carbohydrate intake, glycemic index and prostate cancer risk. Prostate. 2015;75(4):430–439. doi: 10.1002/pros.22929. [DOI] [PMC free article] [PubMed] [Google Scholar]
- 13.Sawada N, Iwasaki M, Yamaji T, et al. Japan Public Health Center–based Prospective Study Group Fiber intake and risk of subsequent prostate cancer in Japanese men. Am J Clin Nutr. 2015;101(1):118–125. doi: 10.3945/ajcn.114.089581. [DOI] [PubMed] [Google Scholar]
- 14.Drake I, Sonestedt E, Gullberg B, et al. Dietary intakes of carbohydrates in relation to prostate cancer risk: a prospective study in the Malmo Diet and Cancer cohort. Am J Clin Nutr. 2012;96(6):1409–1418. doi: 10.3945/ajcn.112.039438. [DOI] [PubMed] [Google Scholar]
- 15.Shikany JM, Flood AP, Kitahara CM, et al. Dietary carbohydrate, glycemic index, glycemic load, and risk of prostate cancer in the Prostate, Lung, Colorectal, and Ovarian Cancer Screening Trial (PLCO) cohort. Cancer Causes Control. 2011;22(7):995–1002. doi: 10.1007/s10552-011-9772-1. [DOI] [PMC free article] [PubMed] [Google Scholar]
- 16.Nimptsch K, Kenfield S, Jensen MK, et al. Dietary glycemic index, glycemic load, insulin index, fiber and whole-grain intake in relation to risk of prostate cancer. Cancer Causes Control. 2011;22(1):51–61. doi: 10.1007/s10552-010-9671-x. [DOI] [PMC free article] [PubMed] [Google Scholar]
- 17.Hardin J, Cheng I, Witte JS. Impact of consumption of vegetable, fruit, grain, and high glycemic index foods on aggressive prostate cancer risk. Nutr Cancer. 2011;63(6):860–872. doi: 10.1080/01635581.2011.582224. [DOI] [PMC free article] [PubMed] [Google Scholar]
- 18.Egeberg R, Olsen A, Christensen J, et al. Intake of whole-grain products and risk of prostate cancer among men in the Danish Diet, Cancer and Health cohort study. Cancer Causes Control. 2011;22(8):1133–1139. doi: 10.1007/s10552-011-9789-5. [DOI] [PubMed] [Google Scholar]
- 19.Hu J, La Vecchia C, Gibbons L, Negri E, Mery L. Nutrients and risk of prostate cancer. Nutr Cancer. 2010;62(6):710–718. doi: 10.1080/01635581003605953. [DOI] [PubMed] [Google Scholar]
- 20.Suzuki R, Allen NE, Key TJ, et al. A prospective analysis of the association between dietary fiber intake and prostate cancer risk in EPIC. Int J Cancer. 2009;124(1):245–249. doi: 10.1002/ijc.23908. [DOI] [PubMed] [Google Scholar]
- 21.George SM, Mayne ST, Leitzmann MF, et al. Dietary glycemic index, glycemic load, and risk of cancer: a prospective cohort study. Am J Epidemiol. 2009;169(4):462–472. doi: 10.1093/aje/kwn347. [DOI] [PMC free article] [PubMed] [Google Scholar]
- 22.Walker M, Aronson KJ, King W, et al. Dietary patterns and risk of prostate cancer in Ontario, Canada. Int J Cancer. 2005;116(4):592–598. doi: 10.1002/ijc.21112. [DOI] [PubMed] [Google Scholar]
- 23.McCann SE, Ambrosone CB, Moysich KB, et al. Intakes of selected nutrients, foods, and phytochemicals and prostate cancer risk in western New York. Nutr Cancer. 2005;53(1):33–41. doi: 10.1207/s15327914nc5301_4. [DOI] [PubMed] [Google Scholar]
- 24.Pelucchi C, Talamini R, Galeone C, et al. Fibre intake and prostate cancer risk. Int J Cancer. 2004;109(2):278–280. doi: 10.1002/ijc.11688. [DOI] [PubMed] [Google Scholar]
- 25.Lu QY, Hung JC, Heber D, et al. Inverse associations between plasma lycopene and other carotenoids and prostate cancer. Cancer Epidemiol Biomarkers Prev. 2001;10(7):749–756. [PubMed] [Google Scholar]
- 26.Ramon JM, Bou R, Romea S, et al. Dietary fat intake and prostate cancer risk: a case-control study in Spain. Cancer Causes Control. 2000;11(8):679–685. doi: 10.1023/a:1008924116552. [DOI] [PubMed] [Google Scholar]
- 27.Chan JM, Pietinen P, Virtanen M, et al. Diet and prostate cancer risk in a cohort of smokers, with a specific focus on calcium and phosphorus (Finland) Cancer Causes Control. 2000;11(9):859–867. doi: 10.1023/a:1008947201132. [DOI] [PubMed] [Google Scholar]
- 28.Jain MG, Hislop GT, Howe GR, Ghadirian P. Plant foods, antioxidants, and prostate cancer risk: findings from case-control studies in Canada. Nutr Cancer. 1999;34(2):173–184. doi: 10.1207/S15327914NC3402_8. [DOI] [PubMed] [Google Scholar]
- 29.Deneo-Pellegrini H, De Stefani E, Ronco A, Mendilaharsu M. Foods, nutrients and prostate cancer: a case-control study in Uruguay. Br J Cancer. 1999;80(3–4):591–597. doi: 10.1038/sj.bjc.6690396. [DOI] [PMC free article] [PubMed] [Google Scholar]
- 30.Chatenoud L, Tavani A, La Vecchia C, et al. Whole grain food intake and cancer risk. Int J Cancer. 1998;77(1):24–28. doi: 10.1002/(sici)1097-0215(19980703)77:1<24::aid-ijc5>3.0.co;2-1. [DOI] [PubMed] [Google Scholar]
- 31.Andersson SO, Wolk A, Bergström R, et al. Energy, nutrient intake and prostate cancer risk: a population-based case-control study in Sweden. Int J Cancer. 1996;68(6):716–722. doi: 10.1002/(SICI)1097-0215(19961211)68:6<716::AID-IJC4>3.0.CO;2-6. [DOI] [PubMed] [Google Scholar]
- 32.West DW, Slattery ML, Robison LM, French TK, Mahoney AW. Adult dietary intake and prostate cancer risk in Utah: a case-control study with special emphasis on aggressive tumors. Cancer Causes Control. 1991;2(2):85–94. doi: 10.1007/BF00053126. [DOI] [PubMed] [Google Scholar]
- 33.Oishi K, Okada K, Yoshida O, et al. A case-control study of prostatic cancer with reference to dietary habits. Prostate. 1988;12(2):179–190. doi: 10.1002/pros.2990120208. [DOI] [PubMed] [Google Scholar]
- 34.Liu Y, Hu F, Li D, et al. Does physical activity reduce the risk of prostate cancer? A systematic review and meta-analysis. Eur Urol. 2011;60(5):1029–1044. doi: 10.1016/j.eururo.2011.07.007. [DOI] [PubMed] [Google Scholar]
- 35.Aune D, Navarro Rosenblatt DA, Chan DS, et al. Dairy products, calcium, and prostate cancer risk: a systematic review and meta-analysis of cohort studies. Am J Clin Nutr. 2015;101(1):87–117. doi: 10.3945/ajcn.113.067157. [DOI] [PubMed] [Google Scholar]
- 36.Xu X, Cheng Y, Li S, et al. Dietary carrot consumption and the risk of prostate cancer. Eur J Nutr. 2014;53(8):1615–1623. doi: 10.1007/s00394-014-0667-2. [DOI] [PubMed] [Google Scholar]
- 37.Liu B, Mao Q, Cao M, Xie L. Cruciferous vegetables intake and risk of prostate cancer: a meta-analysis. Int J Urol. 2012;19(2):134–141. doi: 10.1111/j.1442-2042.2011.02906.x. [DOI] [PubMed] [Google Scholar]
- 38.Landberg R, Andersson SO, Zhang JX, et al. Rye whole grain and bran intake compared with refined wheat decreases urinary C-peptide, plasma insulin, and prostate specific antigen in men with prostate cancer. J Nutr. 2010;140(12):2180–2186. doi: 10.3945/jn.110.127688. [DOI] [PubMed] [Google Scholar]
- 39.Bylund A, Zhang JX, Bergh A, et al. Rye bran and soy protein delay growth and increase apoptosis of human LNCaP prostate adenocarcinoma in nude mice. Prostate. 2000;42(4):304–314. doi: 10.1002/(sici)1097-0045(20000301)42:4<304::aid-pros8>3.0.co;2-z. [DOI] [PubMed] [Google Scholar]
- 40.Mavropoulos JC, Buschemeyer WC, 3rd, Tewari AK, et al. The effects of varying dietary carbohydrate and fat content on survival in a murine LNCaP prostate cancer xenograft model. Cancer Prev Res (Phila) 2009;2(6):557–565. doi: 10.1158/1940-6207.CAPR-08-0188. [DOI] [PMC free article] [PubMed] [Google Scholar]
- 41.Freedland SJ, Mavropoulos J, Wang A, et al. Carbohydrate restriction, prostate cancer growth, and the insulin-like growth factor axis. Prostate. 2008;68(1):11–19. doi: 10.1002/pros.20683. [DOI] [PMC free article] [PubMed] [Google Scholar]
- 42.Aune D, Chan DS, Greenwood DC, et al. Dietary fiber and breast cancer risk: a systematic review and meta-analysis of prospective studies. Ann Oncol. 2012;23(6):1394–1402. doi: 10.1093/annonc/mdr589. [DOI] [PubMed] [Google Scholar]
- 43.Yang Y, Zhao LG, Wu QJ, Ma X, Xiang YB. Association between dietary fiber and lower risk of all-cause mortality: a meta-analysis of cohort studies. Am J Epidemiol. 2015;181(2):83–91. doi: 10.1093/aje/kwu257. [DOI] [PubMed] [Google Scholar]
- 44.Haas P, Machado MJ, Anton AA, Silva AS, de Francisco A. Effectiveness of whole grain consumption in the prevention of colorectal cancer: meta-analysis of cohort studies. Int J Food Sci Nutr. 2009;60(suppl 6):1–13. doi: 10.1080/09637480802183380. [DOI] [PubMed] [Google Scholar]
- 45.de Munter JS, Hu FB, Spiegelman D, Franz M, van Dam RM. Whole grain, bran, and germ intake and risk of type 2 diabetes: a prospective cohort study and systematic review. PLoS Med. 2007;4(8):e261. doi: 10.1371/journal.pmed.0040261. [DOI] [PMC free article] [PubMed] [Google Scholar]
- 46.Dong JY, Qin LQ. Dietary glycemic index, glycemic load, and risk of breast cancer: meta-analysis of prospective cohort studies. Breast Cancer Res Treat. 2011;126(2):287–294. doi: 10.1007/s10549-011-1343-3. [DOI] [PubMed] [Google Scholar]
- 47.Mulholland HG, Murray LJ, Cardwell CR, Cantwell MM. Glycemic index, glycemic load, and risk of digestive tract neoplasms: a systematic review and meta-analysis. Am J Clin Nutr. 2009;89(2):568–576. doi: 10.3945/ajcn.2008.26823. [DOI] [PubMed] [Google Scholar]
- 48.Zhai L, Cheng S, Zhang D. Dietary carbohydrate and prostate cancer risk: a meta-analysis. Nutr Cancer. 2015;67(4):594–602. doi: 10.1080/01635581.2015.1019639. [DOI] [PubMed] [Google Scholar]


