

Abstract
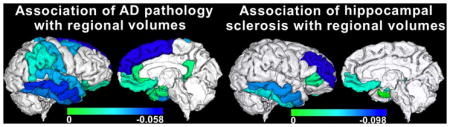
The objective of this work was twofold: to generate macro-structural brain signatures of age-related neuropathologies in a community cohort of older adults, and to determine the contribution of brain macro-structure to the variation in antemortem cognition after accounting for the contributions of neuropathologies and demographics. Cerebral hemispheres from 165 participants of two cohort studies of aging were imaged with MRI ex vivo (mean age at death = 90 years; SD = 6 years). The volumes of white matter and 42 gray matter regions were measured. The same hemispheres also underwent neuropathologic examination. AD pathology was negatively associated with volumes of mainly temporal, frontal, and parietal gray matter regions, and with total white matter volume (p<0.05, FDR-corrected). A negative association was also detected between hippocampal sclerosis and volumes of the hippocampus, as well as other temporal and frontal gray matter regions (p<0.05, FDR-corrected). The volume of mainly medial temporal lobe regions explained an additional 5–6% of the variation in antemortem cognition, above and beyond what was explained by neuropathologies and demographics.
Keywords: MRI, pathology, Alzheimer’s, hippocampal sclerosis, volume, ex vivo
Graphical abstract
1. Introduction
Studies of the aging brain combining in vivo high-resolution anatomical magnetic resonance imaging (MRI) and clinical evaluation suggest that different age-related disorders and dementias may be linked to characteristic brain atrophy spatial patterns (Risacher and Saykin, 2013; Weiner, et al., 2013). These patterns are of great interest due to their potential role in the development of in vivo MRI biomarkers of the underlying pathological processes. For example, such a spatial pattern has already been incorporated in the recently revised criteria for clinical diagnosis of Alzheimer’s disease dementia (McKhann, et al., 2011). However, multiple pathologies commonly coexist in the brains of older persons (Schneider, et al., 2007), and definitive diagnosis of most age-related neuropathologies is only possible at autopsy. Therefore, in order to extract accurate macro-structural brain signatures of age-related neuropathologies it is necessary to combine MRI and pathology information on the same individuals. A number of studies have used in vivo or ex vivo MRI and autopsy to examine the neuropathologic correlates of brain macro-structure (Barkhof, et al., 2007; Burton, et al., 2012; Dawe, et al., 2011; Erten-Lyons, et al., 2013a; Jagust, et al., 2008; Josephs, et al., 2008; Josephs, et al., 2013; Kantarci, et al., 2012; Kaur, et al., 2014; Raman, et al., 2014; Rohrer, et al., 2010; Toledo et al., 2013; Vemuri, et al., 2011; Whitwell, et al., 2008; Whitwell, et al., 2011; Whitwell, et al., 2012; Zarow, et al., 2011). However, these MRI-pathology investigations were characterized by one or more of the following limitations: a) relatively long intervals between in vivo MRI and autopsy, which may have allowed formation of additional pathology not captured in the MRI data; b) relatively limited spatial detail, typically focusing on the volume of the whole brain, ventricles, hippocampus or other medial temporal lobe structures; c) use of clinical cohorts, limiting applicability of the findings to the general population; d) focus on one or few pathologies; e) relatively low numbers of participants. Consequently, the macro-structural brain signatures of various age-related neuropathologies remain a topic of active investigation.
The purpose of the present work was to examine the association between regional brain volumes and age-related neuropathologies using a study design that addresses the above shortcomings by combining ex vivo MRI volumetry and pathology on a large community cohort of older adults. The pathologies that were considered included: Alzheimer’s disease (AD) pathology, Lewy bodies, hippocampal sclerosis, gross and microscopic infarcts, atherosclerosis, arteriolosclerosis, cerebral amyloid angiopathy, and transactive response DNA binding protein 43 (TDP-43). Ex vivo MRI was selected for the present work because it a) captures brain characteristics at the same brain condition as pathological examination, and b) can be performed even on persons too frail for in vivo MRI (Kotrotsou, et al. 2014). Finally, the contribution of regional brain volumes to the variation in cognition proximate to death was assessed, after accounting for the contribution of neuropathologies and demographics.
2. Methods
2.1 Study Population
Participants in either of two longitudinal, epidemiologic clinical-pathologic cohort studies of aging, the Rush Memory and Aging Project (Bennett, et al., 2012b) and the Religious Orders Study (Bennett, et al., 2012a), were included in this work. Both studies were approved by the Institutional Review Board of Rush University Medical Center, and all participants provided written informed consent and signed an anatomical gift act. All participants underwent annual uniform structured clinical evaluations, including medical history, neurological examination, and cognitive function testing (Bennett, et al., 2006a; Bennett, et al., 2006b). A diagnosis of dementia and Alzheimer’s disease was determined in accordance with the criteria of the National Institute of Neurological and Communicative Disorders and Stroke and the Alzheimer Disease and Related Disorders Association (McKhann, et al., 1984). Mild cognitive impairment (MCI) was classified in persons who had cognitive impairment but did not meet dementia criteria (Boyle, et al., 2006). At the time of death, all available clinical data were reviewed, and a summary diagnostic opinion was rendered regarding the most likely clinical diagnosis at the time of death (Schneider, et al., 2007a). Summary diagnoses were made blinded to all postmortem data. Participants with structural brain abnormalities (e.g. tumors) not typical of aging and visible with ex vivo MRI were excluded. Persons with white matter lesions appearing hyper-intense in T2-weighted images, with infarcts or microbleeds were not excluded. Analyses were based on the first 165 eligible participants imaged with MRI ex vivo (Table 1).
Table 1.
Demographic and clinical information.
| Characteristics | MAPa | ROSb | Total |
|---|---|---|---|
| N | 96 | 69 | 165 |
| Age at death, years (SD) | 90 (6) | 89 (7) | 90 (6) |
| Male, n (%) | 27 (28%) | 22 (32%) | 49 (30%) |
| Education, years (SD) | 14.2 (3) | 18 (4) | 16 (4) |
| Median time between last clinical evaluation and death, years | 0.77 | 0.77 | 0.77 |
| Antemortem clinical diagnosis, n (%) | |||
| - No cognitive impairment | 28 (29%) | 21 (30%) | 49 (30%) |
| - Mild cognitive impairment | 19 (20%) | 11 (16%) | 30 (18%) |
| - Alzheimer’s disease | 47 (49%) | 36 (52%) | 83 (50%) |
| - Other primary cause of dementia | 2 (2%) | 1 (2%) | 3 (2%) |
| Global cognition scorec, mean (SD) | −1.1 (1.2) | −1.1 (1.3) | −1.1 (1.2) |
| Episodic memory scorec, mean (SD) | −1.2 (1.3) | −0.9 (1.6) | −1.0 (1.4) |
| Semantic memory scorec, mean (SD) | −0.9 (1.4) | −1.1 (1.5) | −1.0 (1.4) |
| Working memory scorec, mean (SD) | −0.9 (1.1) | −1.1 (1.2) | −1.0 (1.1) |
| Perceptual speed scorec, mean (SD) | −1.3 (1.3) | −1.3 (1.2) | −1.3 (1.2) |
| Visuospatial ability scorec, mean (SD) | −0.9 (1.1) | −0.9 (1.1) | −0.8 (1.1) |
| Mini-mental State Examinationc (MMSE), mean (SD) | 19.9 (9.2) | 18.9 (10.2) | 19.5 (9.6) |
| Mini-mental State Examinationc (MMSE), median | 24 | 23 | 23 |
| Right hemisphere, n (%) | 49 (51%) | 32 (46%) | 81 (49%) |
| Postmortem interval to fixation, hours (SD) | 8 (5) | 9 (5) | 8 (5) |
| Postmortem interval to imaging, days (SD) | 48 (21) | 50 (20) | 49 (21) |
| MRI scanner, n (%) | |||
| - General Electric (3 Tesla) | 32 (33%) | 13 (19%) | 45 (27%) |
| - Philips (3 Tesla) | 34 (35%) | 31 (45%) | 65 (39%) |
| - Siemens (3 Tesla) | 30 (31%) | 25 (36%) | 55 (33%) |
Memory and Aging Project
Religious Orders Study
Proximate to death
2.2 Cognitive Testing
A battery of 21 cognitive tests was administered annually including the Mini-Mental State Examination, the Complex Ideational Material, 7 episodic memory tests, 3 semantic memory tests, 3 working memory tests, 4 perceptual speed tests, and 2 visuospatial ability tests (Bennett, et al., 2012a; Bennett, et al., 2012b). The Mini-Mental State Examination was used only for descriptive purposes and the Complex Ideational Material was only used for diagnostic classification. Raw scores on the remaining 19 tests were converted to z-scores. A person’s z-scores across all 19 tests were averaged to yield a single composite score of global cognition (Wilson, et al., 2003). Composite scores for each of the five cognitive domains (episodic memory, semantic memory, working memory, perceptual speed, visuospatial ability) were constructed by averaging the z-scores from the corresponding individual tests (Bennett, et al., 2006a; Bennett, et al., 2012a; Bennett, et al., 2012b). Cognitive performance most proximate to death was used in analyses.
2.3 Brain Hemisphere Preparation
After a participant’s death, an autopsy technician removed the brain, separated the cerebrum from the cerebellum and brainstem, and divided the cerebrum into left and right hemispheres. One cerebral hemisphere was immersed in phosphate-buffered 4% paraformaldehyde solution and refrigerated at 4 °C within 30 min after removal from the skull. Prior to ex vivo MRI, the hemisphere was positioned in a container filled with 4% paraformaldehyde solution with its medial aspect facing the bottom of the container, and returned to room temperature (Dawe, et al., 2009; Dawe, et al., 2011; Dawe, et al., 2014; Kotrotsou, et al., 2014).
2.4 Ex Vivo MRI Data Acquisition, Image Segmentation, and Volumetry
Ex vivo MRI scans were conducted on clinical 3 Tesla MRI scanners using a 2D fast spin-echo sequence with multiple echo-times (TEs). Due to typical MRI hardware updates, three different MRI scanners were used (Table 1). Nevertheless, similar acquisition parameters were prescribed across scanners (see Dawe, et al., 2014, for more details), and only similar TEs were used for processing.
Segmentation of ex vivo MRI data into white matter and 42 cortical and subcortical gray matter regions followed a recently published multi-atlas approach based on 25 atlases (Kotrotsou, et al., 2014). The volume of each brain region was calculated by multiplying the number of voxels in a region with the voxel volume. Regional volumes were normalized by the participant’s height (therefore, the normalized volumes had units of mm2) (Dawe, et al., 2011). Examples of raw images and segmentation results are presented in Kotrotsou, et al., 2014.
2.5 Neuropathologic Evaluation
Following MRI, the same hemispheres were sectioned into 1 cm thick coronal slabs, and underwent dissection of tissue blocks for diagnosis and evaluation of macroscopic pathology. Blocks were embedded in paraffin, cut into sections and mounted on glass slides. Each case was reviewed by a board-certified neuropathologist who was blinded to age and clinical diagnoses (Arvanitakis, et al., 2011a; Dawe, et al., 2014; Schneider, et al., 2004; Schneider, et al., 2007a; Schneider, et al., 2012).
Modified Bielschowsky silver stain was used to visualize and count neuritic plaques, diffuse plaques, and neurofibrillary tangles in the midfrontal, middle temporal, inferior parietal, entorhinal, and hippocampal (CA1) cortices. Plaque and tangle counts in each brain region were divided by the corresponding standard deviation, and the scaled scores were averaged across the five regions to generate a composite score of global AD pathology for each hemisphere (Schneider, et al., 2007b). A pathologic diagnosis of AD was also rendered according to the National Institute on Aging (NIA)-Reagan criteria (National Institute on Aging, and Reagan Institute Working Group on Diagnostic Criteria for the Neuropathological Assessment of Alzheimer’s Disease, 1997). Hippocampal sclerosis was defined as severe neuronal loss and gliosis in the hippocampus, typically CA1 and/or subicular region, and was rated as present or absent (Schneider, et al., 2009). Lewy bodies were detected by examination of the substantia nigra, entorhinal, cingulate, midfrontal, middle temporal, and inferior parietal cortex with monoclonal antibodies to phosphorylated alpha-synuclein and were rated as present or absent (Schneider, et al. 2012). The total number, location and age of gross infarcts were recorded and confirmed histologically (Schneider, et al., 2004) on paraffin embedded slides stained with hematoxylin and eosin (H&E). Microscopic infarcts were infarcts that were identified by microscopy but not seen grossly. They were identified on 6 μm H&E-stained sections from a minimum of 9 dissected regions (midfrontal, middle temporal, entorhinal, hippocampal, inferior parietal, and anterior cingulate cortices, anterior basal ganglia, thalamus, and midbrain) and were classified by age and specific location (Arvanitakis, et al., 2011a). Gross and microscopic infarcts were scored as none, one, or more than one. Assessment of atherosclerosis was based on the number and extent of vascular involvement at the circle of Willis. Atherosclerosis was rated as none or possible, mild, moderate, and severe. Assessment of arteriolosclerosis was based on the severity of wall thickening and luminal occlusion of the small arterioles in one 6 μm H&E-stained section of anterior basal ganglia. Arteriolosclerosis was rated as none, mild, moderate, and severe. Cerebral amyloid angiopathy was assessed on paraffin embedded sections from: angular gyrus, midfrontal, temporal and calcarine cortices (Arvanitakis, et al., 2011b). The severity of amyloid angiopathy was rated as none, mild, moderate, and severe. TDP-43 cytoplasmic inclusions (both neuronal and glial) were assessed in 6 μm sections from the amygdala, hippocampus CA1, dentate gyrus, entorhinal cortex, midtemporal cortex, and midfrontal cortex, stained for monoclonal antibodies to phosphorylated TDP-43 (pS409/410; 1:100). TDP-43 pathology was rated on 4 levels capturing the staging of the pathology: no inclusions; inclusions in amygdala only; inclusions in amygdala as well as entorhinal cortex or hippocampus CA1; and inclusions in amygdala, entorhinal cortex or hippocampus CA1, and neocortex (Yu, et al., 2015).
2.6 Statistical Analysis
Linear regression was used to investigate the association of regional volumes with the composite score of global AD pathology, the presence of hippocampal sclerosis, of Lewy bodies, of gross and microscopic infarcts, and with the severity of atherosclerosis, arteriolosclerosis, cerebral amyloid angiopathy, and TDP-43. All neuropathologies were entered in a single multiple linear regression model, with one model for each region. All regression models included terms to control for: age at death, sex, years of education, the time between death and immersion in paraformaldehyde solution, the time between death and ex vivo MRI, and the MRI scanner used for data acquisition. For all analyses, 2-tailed p-values were corrected for multiple comparisons using the False Discovery Rate (FDR) approach. Associations of regional volumes with neuropathology were considered significant at p-corrected<0.05.
Linear regression was also used to investigate the contribution of regional volumes to the variation in antemortem cognition across participants, controlling for the contributions of neuropathologies. More specifically, the measures of performance in each of the five cognitive domains, as well as global cognition, were used separately as outcome variables in multiple linear regression models, where the explanatory variables were the neuropathologies and covariates used above. Regression analyses were then repeated after adding a single regional volume in the list of explanatory variables, and the additional percentage of variation in cognition explained was computed as the difference in adjusted R2. The same process was repeated for each region separately.
3. Results
3.1 Demographics and Neuropathology
Demographic and clinical characteristics are presented in Table 1, and neuropathologic diagnoses are presented in Table 2. There were no significant differences for the parameters presented in Tables 1 and 2 between the group of participants included in this work and 936 other participants of the parent studies (Rush Memory and Aging Project and Religious Orders Study) that had an autopsy after the start of the present work.
Table 2.
Neuropathologic findings.
| Characteristics | MAPa | ROSb | Total |
|---|---|---|---|
| N | 96 | 69 | 165 |
| NIA Reagan (Likelihood of AD), n (%) | |||
| - High | 21 (22%) | 14 (20%) | 35 (21%) |
| - Intermediate | 46 (48%) | 35 (51%) | 81 (49%) |
| - None or low | 29 (30%) | 20 (29%) | 49 (30%) |
| Composite score of global AD pathology, mean (SD) | 0.7 (0.6) | 0.9 (0.7) | 0.8 (0.7) |
| Lewy bodies, n (%) | 22 (23%) | 16 (23%) | 38 (23%) |
| Hippocampal sclerosis, n (%) | 10 (10%) | 10 (14%) | 20 (12%) |
| Gross infarcts, n (%) | 33 (34%) | 27 (39%) | 60 (36%) |
| Microscopic infarcts, n (%) | 26 (27%) | 17 (25%) | 43 (26%) |
| Atherosclerosis, n (%) | |||
| - Severe | 17 (18%) | 3 (4%) | 20 (12%) |
| - Moderate | 21 (22%) | 22 (32%) | 43 (26%) |
| - Mild | 47 (49%) | 31 (45%) | 78 (47%) |
| - None | 11 (11%) | 13 (19%) | 24 (15%) |
| Arteriolosclerosis, n (%) | |||
| - Severe | 11 (12%) | 6 (9%) | 17 (10%) |
| - Moderate | 28 (29%) | 4 (6%) | 32 (20%) |
| - Mild | 33 (34%) | 40 (58%) | 73 (44%) |
| - None | 24 (25%) | 19 (27%) | 43 (26%) |
| Cerebral amyloid angiopathy, n (%) | |||
| - Severe | 7 (7%) | 8 (12%) | 15 (9%) |
| - Moderate | 25 (26%) | 17 (25%) | 42 (25%) |
| - Mild | 51 (53%) | 30 (43%) | 81 (49%) |
| - None | 13 (14%) | 14 (20%) | 27 (16%) |
| TDP43, n (%) | |||
| - Inclusions in amygdala, entorhinal cortex or hippocampus CA1, and neocortex | 16 (17%) | 8 (12%) | 24 (15%) |
| - Inclusions in amygdala and entorhinal cortex or hippocampus CA1 | 28 (29%) | 19 (27%) | 47 (28%) |
| - Inclusions in amygdala only | 24 (25%) | 9 (13%) | 33 (20%) |
| - No inclusions | 28 (29%) | 33 (48%) | 61 (37%) |
Memory and Aging Project
Religious Orders Study
3.2 Association of Regional Brain Volumes with Neuropathology
Significant negative associations were demonstrated between regional brain volumes and AD pathology, as well as hippocampal sclerosis.
i) AD pathology
The composite score of global AD pathology was significantly negatively correlated with the volume of white matter, as well as with a number of subcortical and cortical gray matter regions in the temporal, frontal, and parietal cortices (Table 3, Fig. 1), when using multiple linear regression. The largest significant effects (model estimate < −0.03×10⁻³ mm2, p<0.05, FDR-corrected) were observed in white matter, inferior, middle and superior temporal gyri, fusiform gyrus, superior frontal gyrus, supramarginal gyrus, and postcentral gyrus (Table 3).
Table 3.
Brain regions with a significant negative correlation (p<0.05, FDR-corrected) between their normalized volume and the composite score of global AD pathology, according to multiple linear regression models with terms for all neuropathologies and covariates.
| Brain region | Model estimate (10−3 mm2) | p-value (FDR-corrected) |
|---|---|---|
|
| ||
| White matter | −0.48 | 0.016 |
|
| ||
| Temporal lobe | ||
| Entorhinal cortex | −0.011 | 0.0002 |
| Hippocampus | −0.017 | 0.006 |
| Parahippocampal gyrus | −0.011 | 0.0013 |
| Amygdala | −0.0066 | 0.019 |
| Fusiform gyrus | −0.043 | 0.001 |
| Inferior temporal gyrus | −0.044 | 0.0005 |
| Middle temporal gyrus | −0.053 | 0.002 |
| Superior temporal gyrus | −0.048 | 0.0011 |
| Temporal pole | −0.013 | 0.0011 |
|
| ||
| Frontal lobe | ||
| Orbitofrontal cortex (medial division) | −0.019 | 0.023 |
| Orbitofrontal cortex (lateral division) | −0.019 | 0.04 |
| Middle frontal gyrus (caudal division) | −0.022 | 0.014 |
| Superior frontal gyrus | −0.058 | 0.023 |
|
| ||
| Parietal lobe | ||
| Supramarginal gyrus | −0.039 | 0.012 |
| Postcentral gyrus | −0.035 | 0.018 |
|
| ||
| Cingulate Cortex | ||
| Rostral anterior division | −0.011 | 0.013 |
| Isthmus division | −0.012 | 0.023 |
Figure 1.
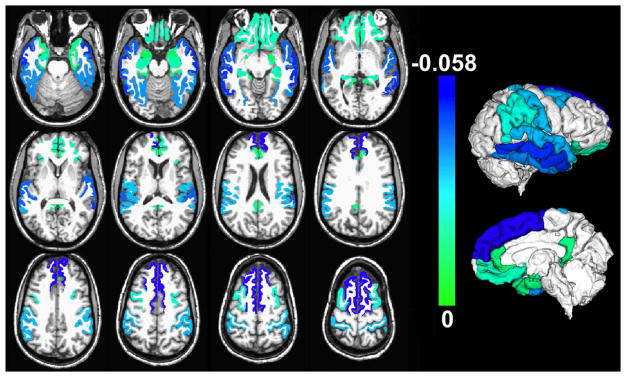
Gray matter regions with significant negative correlation between their normalized volumes measured ex vivo and the composite score of global AD pathology, controlling for all other neuropathologies and the covariates listed in the Methods section (p<0.05, FDR-corrected). Unique colors have been assigned to different model estimates according to the color scale (units: 10−3 mm2). The volume of white matter was also significantly negatively correlated with AD pathology, but is not shown for clarity. To enhance visualization, results are overlaid on in vivo T1-weighted images from a young subject with the same pre-segmented gray matter labels as those used in the present study, and the result for each label is shown in both brain hemispheres (no laterality information is presented in this figure; a single hemisphere per participant was investigated). Lateral and medial three-dimensional views of the same results are also shown.
ii) Hippocampal sclerosis
The presence of hippocampal sclerosis was significantly negatively associated with the volume of the hippocampus and gray matter regions in the temporal and frontal lobes (Table 4, Fig. 2), when using multiple linear regression. The largest significant effects (model estimate < −0.03×10⁻³ mm2, p<0.05, FDR-corrected) were observed in the hippocampus, inferior and middle temporal gyri, medial orbitofrontal cortex, and rostral middle frontal gyrus (Table 4).
Table 4.
Brain regions with a significant negative association (p<0.05, FDR-corrected) between their normalized volume and the presence of hippocampal sclerosis, according to multiple linear regression adjusting for all neuropathologies and covariates.
| Brain region | Model estimate (10−3 mm2) | p-value (FDR-corrected) |
|---|---|---|
|
| ||
| Temporal lobe | ||
| Entorhinal cortex | −0.017 | 0.0019 |
| Hippocampus | −0.037 | 0.0026 |
| Inferior temporal gyrus | −0.046 | 0.05 |
| Middle temporal gyrus | −0.07 | 0.049 |
|
| ||
| Frontal lobe | ||
| Orbitofrontal cortex (medial division) | −0.038 | 0.03 |
| Inferior frontal gyrus (pars triangularis) | −0.024 | 0.048 |
| Middle frontal gyrus (rostral division) | −0.098 | 0.04 |
Figure 2.
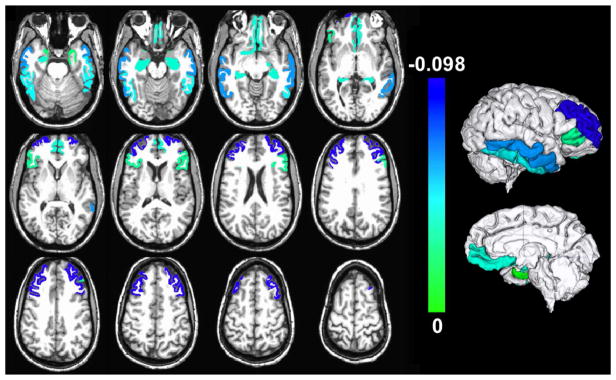
Gray matter regions with significant negative association between their normalized volumes measured ex vivo and the presence of hippocampal sclerosis, controlling for all other neuropathologies and the covariates listed in the Methods section (p<0.05, FDR-corrected). Unique colors have been assigned to different model estimates according to the color scale (units: 10−3 mm2). To enhance visualization, results are overlaid on in vivo T1-weighted images from a young subject with the same pre-segmented gray matter labels as those used in the present study, and the result for each label is shown in both brain hemispheres (no laterality information is presented in this figure; a single hemisphere per participant was investigated). Lateral and medial three-dimensional views of the same results are also shown.
3.3 Contribution of Regional Brain Volumes to the Variation in Cognition
Regression analyses investigating the contribution of individual regional volumes to the variation in antemortem cognition across participants showed that, the volumes of certain temporal lobe regions explained an additional portion of the variance of global cognition (as much as 5.8%) above and beyond what was explained by the neuropathologies and covariates (33%) (Table 5). Similar findings were obtained for the five cognitive domains (Table 5).
Table 5.
Contribution of individual regional volumes to the variation in antemortem cognition across participants (in % of the total variance) controlling for the contributions of demographics and neuropathologiesa–f.
| Episodic memorya | Semantic memoryb | Working memoryc | Perceptual speedd | Visuospatial abilitye | Global cognitionf | |
|---|---|---|---|---|---|---|
| Entorhinal cortex | 3.7% | 4.1% | 4.5% | 5.2% | 2.8% | 5.7% |
| Hippocampus | 3.0% | - | 3.4% | 3.0% | 2.8% | 4.5% |
| Parahippocampal gyrus | 2.2% | - | 2.3% | 3.6% | 2.2% | 2.9% |
| Amygdala | 4.5% | - | 4.6% | 3.3% | 2.2% | 5.8% |
| Fusiform gyrus | - | - | - | 4.1% | 1.7% | 2.4% |
| Inferior temporal gyrus | 1.9% | 1.8% | - | 1.8% | 1.9% | 1.5% |
| Lingual | 1.6% | - | - | - | - | - |
| White matter | - | - | - | 1.8% | 3.2% | - |
38% of the variance of episodic memory was explained by demographics and neuropathologies.
21% of the variance of semantic memory was explained by demographics and neuropathologies.
17% of the variance of working memory was explained by demographics and neuropathologies.
16% of the variance of perceptual speed was explained by demographics and neuropathologies.
14% of the variance of visuospatial ability was explained by demographics and neuropathologies.
33% of the variance of global cognition was explained by demographics and neuropathologies.
4. Discussion
The association of regional brain volumes with age-related neuropathologies was examined in this study by combining ex vivo MRI volumetry and pathology on a large community cohort of older adults (mean age at death = 90 years; SD = 6 years). Spatial patterns of significant negative correlations between regional brain volumes, AD pathology and hippocampal sclerosis were extracted. None of the other neuropathologies considered in this work showed statistically significant links to regional volumes. Finally, the volumes of certain temporal lobe regions measured ex vivo explained a portion of the variation in antemortem cognition not captured by the neuropathologic measures considered in this work.
The spatial pattern of gray matter regions with significant negative correlation between their volume and AD pathology was in general agreement with corresponding patterns from studies combining in vivo MRI volumetry, or voxel-based morphometry, and pathology (Josephs, et al., 2008; Josephs, et al., 2013; Vemuri, et al., 2011; Whitwell, et al., 2008; Whitwell, et al., 2012), as well as with the distribution of neurodegenerative changes of AD seen at autopsy (Braak and Braak, 1997). The agreement between the present findings based on ex vivo imaging and previous results based on in vivo imaging was anticipated, since, in a recent investigation that used the same ex vivo MRI approach on the same cohort as the present study, regional brain volumes measured ex vivo were linearly related to those measured in vivo (Kotrotsou, et al. 2014). The agreement in AD-related patterns serves as confirmation that in vivo and ex vivo MRI can provide similar spatial information on the link between regional brain volumes and neuropathology, increasing confidence on less-known non-AD patterns that were generated here, or will be generated in the future using the same approaches.
Despite the similarities in AD spatial patterns across studies, some discrepancies exist in the relative involvement of different regions within the patterns. More specifically, previous works showed the temporal lobes as the regions with the largest magnitude of AD-related effects (Fig. 2 in Josephs, et al., 2008; Fig. 5 in Josephs et al., 2013; Fig. 2 in Vemuri et al., 2011; Figs. 1 & 2 in Whitwell, et al., 2012; Fig. 1 in Whitwell, et al., 2008), while in the present study, both temporal and frontal lobes showed strong involvement (Fig. 1). This discrepancy may be due to differences in inclusion criteria, demographics or disease progression. More specifically, the present study was based on a community cohort of older adults, while Josephs, et al., 2008, and 2013, and Whitwell, et al., 2012, targeted persons with at least intermediate probability of AD, Vemuri, et al., 2011, focused on persons with a single pathologic diagnosis, and Whitwell, et al., 2008, excluded persons with neurodegenerative disorders other than AD. In addition, statistical analyses in the present study included a wide range of pathologies, while one or few pathologies were considered in previous research. The discrepancies in AD spatial patterns across studies may also be due to differences in image processing approaches used (volumetry based on multi-atlas segmentation vs. voxel-based morphometry). Another possible explanation may be the fact that in the previously published in vivo MRI and pathology studies, the mean interval between the last MRI scan and death was between 2–6 years, with some individuals imaged for the last time as many as 13 years before death (Josephs, et al., 2008; Josephs, et al., 2013; Vemuri, et al., 2011; Whitwell, et al., 2008; Whitwell, et al., 2012). These long intervals may have allowed development of additional pathology that was captured at autopsy but its effects on the macrostructure were not captured by imaging, thereby leading to an underestimation of the relation between pathology and brain macrostructure. An additional possible explanation may be the fact that the most frail individuals tend to be excluded from in vivo MRI research studies, while ex vivo MRI investigations can be conducted without regard to clinical characteristics.
The total white matter volume was also significantly negatively correlated with AD pathology. This association has not been explored previously. Nevertheless, AD pathology has been linked to disruption of white matter integrity (Erten-Lyons, et al., 2013b; Salat, et al., 2009), and published work has shown significantly lower white matter volume in clinically diagnosed AD patients compared to healthy controls (Salat, et al., 2009). Additionally, reduced white matter volume has been associated with dementia in a group where 86% of demented participants met pathologic criteria for AD (Smith, et al., 2000).
The spatial pattern of gray matter regions with significant negative association between their volume and hippocampal sclerosis included not only the hippocampus, but also regions in the temporal and frontal lobes (Table 4, Fig. 2). The regions listed in Table 4 are known to be connected to the hippocampus either directly, or indirectly through other regions included in Table 4, suggesting that neurodegeneration associated with hippocampal sclerosis may extend to regions linked to the hippocampus (Andersen, et al., 2007). For example, neuronal loss and gliosis extending into the parahippocampal and inferior temporal gyri has been reported previously in a few cases of hippocampal sclerosis (Leverenz, et al., 2002). This is also consistent with clinicopathologic studies showing that hippocampal sclerosis affects not only memory but also additional cognitive domains (Brenowitz, et al., 2014; Corey-Bloom, et al., 1997). To the best of our knowledge, this is the first presentation of a spatial pattern of regional volumes negatively associated with hippocampal sclerosis. Most previous studies of brain macrostructure in hippocampal sclerosis focused on the hippocampal formation (Dawe, et al., 2011; Zarow, et al., 2011).
None of the other pathologies considered here showed significant associations with regional brain volumes. However, previous work combining in vivo MRI and pathology showed that Lewy bodies were associated with lower volume in the amygdala, brainstem, inferior and middle temporal lobes (Burton, et al., 2012; Kantarci, et al., 2012; Vemuri, et al., 2011). Also, gross infarcts have been associated with larger ventricular volume (Erten-Lyons, et al., 2013a), and microscopic infarcts with lower volume in the whole brain, precuneus, motor, and somatosensory areas (Raman, et al., 2014). Finally, cerebral amyloid angiopathy (Erten-Lyons, et al., 2013a) and TDP-43 (Josephs, et al., 2008; Josephs, et al., 2014) have been linked to smaller hippocampal volumes. These discrepancies may be due to the use of groups with certain clinical symptoms or pathologies instead of community cohorts, or due to other differences in demographics, pathology measures, imaging methods, statistical power, or disease progression. Pathology data on amygdala and brainstem Lewy bodies were not available in the cohorts studied here, and the brainstem was not imaged. Furthermore, ventricular volumes cannot be assessed in brain hemispheres imaged ex vivo.
Regression analyses investigating the contribution of regional volumes to the variation in antemortem cognition across participants showed that, the volume of the hippocampus, entorhinal cortex and amygdala each explained an additional 4–6% of the variation in global cognition, above and beyond the 33% explained by the neuropathologic measures and other covariates. These findings indicate that temporal lobe regional volumes capture additional brain differences potentially associated with a) the neuropathologies considered here but not captured by the corresponding measures, b) other neuropathologies not considered in this work, or c) other factors that influence regional brain volumes and cognition but are unrelated to pathologic processes. The first is possible since pathology quantification was based on measurements made in specific brain regions and not everywhere in the brain, and the second may also be true since the list of neuropathologies considered here may be incomplete. The third option is also possible since, for example, particular occupations (Maguire, et al., 2000) and experiences (Carlson, et al., 2015) have been associated with higher regional volumes and enhanced cognition. These results demonstrate the important role ex vivo MRI can have in autopsy studies and investigations of cognitive aging.
Although volumetry based on the ex vivo MRI approach used here benefits from capturing brain characteristics at the same brain condition as pathological examination and allows investigation of a more representative sample of the community than conventional in vivo MRI, limitations also exist. First, laterality was not investigated. Second, the intracranial volume typically used for normalization was not available. The height of the participants, which is highly correlated with intracranial volume, was used instead. Third, random small variations in hemisphere resection may have occurred, introducing noise in white matter volume measurements. Furthermore, three MRI scanners were used due to typical updates. Additional factors were included in statistical analysis to account for potential scanner-related effects. Finally, the size of this community sample was not particularly large. Yet, the number of participants in this work was among the highest for studies combining MRI and pathology.
The present study generated spatial patterns of significant negative correlations between regional brain volumes and AD pathology, as well as hippocampal sclerosis. By combining ex vivo MRI volumetry and pathology on a large community cohort of older adults, important biases of previous work combining in vivo imaging and pathology were avoided. The derived AD pattern was consistent with published reports, yet compelling differences existed in the relative involvement of different regions. Evidence on the link between AD pathology and lower cerebral white matter volume was provided. Hippocampal sclerosis was negatively correlated with the volume of regions including, but not limited to the hippocampus. The presented spatial patterns may enhance MRI-based biomarkers. Finally, the volume of the hippocampus, entorhinal cortex, and amygdala may have captured underlying processes contributing to the variation in antemortem cognition and not assessed by the neuropathologic measures, demonstrating the important role ex vivo MRI can have in enhancing autopsy studies and advancing our understanding of cognitive aging.
Highlights.
Ex vivo brain MR volumetry and pathology in a community cohort of older adults
Alzheimer’s pathology is associated with lower volumes in gray and white matter
Hippocampal sclerosis is associated with lower volume even outside the hippocampus
Regional volumes capture variance in cognition not explained by neuropathologies
Acknowledgments
Funding
The study was supported by NIH grants P30AG10161, R01AG15819, R01AG17917, R01AG34374 and the Illinois Department of Public Health (Alzheimer’s Disease Research Fund).
The authors would like to thank the participants and staff of the Rush Memory and Aging Project and the Religious Orders Study.
Abbreviations
- AD
Alzheimer’s disease
- CA1
Cornu ammonis region 1 of hippocampus proper
- NIA
National Institute on Aging
- H&E
Hematoxylin and Eosin
- FDR
False discovery rate
- TDP43
Transactive response DNA-binding protein 43
Footnotes
Publisher's Disclaimer: This is a PDF file of an unedited manuscript that has been accepted for publication. As a service to our customers we are providing this early version of the manuscript. The manuscript will undergo copyediting, typesetting, and review of the resulting proof before it is published in its final citable form. Please note that during the production process errors may be discovered which could affect the content, and all legal disclaimers that apply to the journal pertain.
References
- Andersen P, Morris R, Amaral D, Bliss T, O’Keefe J. The hippocampus book. New York: Oxford University Press; 2007. [Google Scholar]
- Arvanitakis Z, Leurgans SE, Barnes LL, Bennett DA, Schneider JA. Microinfarct pathology, dementia, and cognitive systems. Stroke. 2011a;42:722–7. doi: 10.1161/STROKEAHA.110.595082. [DOI] [PMC free article] [PubMed] [Google Scholar]
- Arvanitakis Z, Leurgans SE, Wang Z, Wilson RS, Bennett DA, Schneider JA. Cerebral amyloid angiopathy pathology and cognitive domains in older persons. Ann Neurol. 2011b;69:320–7. doi: 10.1002/ana.22112. [DOI] [PMC free article] [PubMed] [Google Scholar]
- Barkhof F, Polvikoski TM, van Straaten EC, Kalaria RN, Sulkava R, Aronen HJ, Niinistö L, Rastas S, Oinas M, Scheltens P, Erkinjuntti T. The significance of medial temporal lobe atrophy: a postmortem MRI study in the very old. Neurology. 2007;69:1521–7. doi: 10.1212/01.wnl.0000277459.83543.99. [DOI] [PubMed] [Google Scholar]
- Bennett DA, Schneider JA, Aggarwal NT, Arvanitakis Z, Shah RC, Kelly JF, Fox JH, Cochran EJ, Arends D, Treinkman AD, Wilson RS. Decision rules guiding the clinical diagnosis of Alzheimer’s disease in two community-based cohort studies compared to standard practice in a clinic-based cohort study. Neuroepidemiology. 2006a;27:169–76. doi: 10.1159/000096129. [DOI] [PubMed] [Google Scholar]
- Bennett DA, Schneider JA, Arvanitakis Z, Kelly JF, Aggarwal NT, Shah RC, Wilson RS. Neuropathology of older persons without cognitive impairment from two community-based studies. Neurology. 2006b;66:1837–44. doi: 10.1212/01.wnl.0000219668.47116.e6. [DOI] [PubMed] [Google Scholar]
- Bennett DA, Schneider JA, Arvanitakis Z, Wilson RS. Overview and findings from the religious orders study. Curr Alzheimer Res. 2012a;9:628–45. doi: 10.2174/156720512801322573. [DOI] [PMC free article] [PubMed] [Google Scholar]
- Bennett DA, Schneider JA, Buchman AS, Barnes LL, Boyle PA, Wilson RS. Overview and findings from the Rush Memory and Aging Project. Curr Alzheimer Res. 2012b;9:646–63. doi: 10.2174/156720512801322663. [DOI] [PMC free article] [PubMed] [Google Scholar]
- Boyle PA, Wilson RS, Aggarwal NT, Tang Y, Bennett DA. Mild cognitive impairment: risk of Alzheimer’s disease and rate of cognitive decline. Neurology. 2006;67:441–5. doi: 10.1212/01.wnl.0000228244.10416.20. [DOI] [PubMed] [Google Scholar]
- Braak H, Braak E. Frequency of stages of Alzheimer-related lesions in different age categories. Neurobiol Aging. 1997;18:351–7. doi: 10.1016/s0197-4580(97)00056-0. [DOI] [PubMed] [Google Scholar]
- Brenowitz WD, Monsell SE, Schmitt FA, Kukull WA, Nelson PT. Hippocampal sclerosis of aging is a key Alzheimer’s disease mimic: clinical-pathologic correlations and comparisons with both alzheimer’s disease and non-tauopathic frontotemporal lobar degeneration. J Alzheimers Dis. 2014;39:691–702. doi: 10.3233/JAD-131880. [DOI] [PMC free article] [PubMed] [Google Scholar]
- Burton EJ, Mukaetova-Ladinska EB, Perry RH, Jaros E, Barber R, O’Brien JT. Neuropathological correlates of volumetric MRI in autopsy-confirmed Lewy body dementia. Neurobiol Aging. 2012;33:1228–36. doi: 10.1016/j.neurobiolaging.2010.12.015. [DOI] [PubMed] [Google Scholar]
- Carlson MC, Kuo JH, Chuang YF, Varma VR, Harris G, Albert MS, Erickson KI, Kramer AF, Parisi JM, Xue QL, Tan EJ, Tanner EK, Gross AL, Seeman TE, Gruenewald TL, McGill S, Rebok GW, Fried LP. Impact of the Baltimore Experience Corps Trial on cortical and hippocampal volumes. Alzheimers Dement. 2015 doi: 10.1016/j.jalz.2014.12.005. (in print) [DOI] [PMC free article] [PubMed] [Google Scholar]
- Corey-Bloom J, Sabbagh MN, Bondi MW, Hansen L, Alford MF, Masliah E, Thal LJ. Hippocampal sclerosis contributes to dementia in the elderly. Neurology. 1997;48:154–60. doi: 10.1212/wnl.48.1.154. [DOI] [PubMed] [Google Scholar]
- Dawe RJ, Bennett DA, Schneider JA, Arfanakis K. Neuropathologic correlates of hippocampal atrophy in the elderly: a clinical, pathologic, postmortem MRI study. PLoS One. 2011;6:e26286. doi: 10.1371/journal.pone.0026286. [DOI] [PMC free article] [PubMed] [Google Scholar]
- Dawe RJ, Bennett DA, Schneider JA, Leurgans SE, Kotrotsou A, Boyle PA, Arfanakis K. Ex vivo T2 relaxation: associations with age-related neuropathology and cognition. Neurobiol Aging. 2014;35:1549–61. doi: 10.1016/j.neurobiolaging.2014.01.144. [DOI] [PMC free article] [PubMed] [Google Scholar]
- Dawe RJ, Bennett DA, Schneider JA, Vasireddi SK, Arfanakis K. Postmortem MRI of human brain hemispheres: T2 relaxation times during formaldehyde fixation. Magn Reson Med. 2009;61:810–8. doi: 10.1002/mrm.21909. [DOI] [PMC free article] [PubMed] [Google Scholar]
- Erten-Lyons D, Dodge HH, Woltjer R, Silbert LC, Howieson DB, Kramer P, Kaye JA. Neuropathologic basis of age-associated brain atrophy. JAMA Neurol. 2013a;70:616–22. doi: 10.1001/jamaneurol.2013.1957. [DOI] [PMC free article] [PubMed] [Google Scholar]
- Erten-Lyons D, Woltjer R, Kaye J, Mattek N, Dodge HH, Green S, Tran H, Howieson DB, Wild K, Silbert LC. Neuropathologic basis of white matter hyperintensity accumulation with advanced age. Neurology. 2013b;81:977–83. doi: 10.1212/WNL.0b013e3182a43e45. [DOI] [PMC free article] [PubMed] [Google Scholar]
- Jagust WJ, Zheng L, Harvey DJ, Mack WJ, Vinters HV, Weiner MW, Ellis WG, Zarow C, Mungas D, Reed BR, Kramer JH, Schuff N, DeCarli C, Chui HC. Neuropathological basis of magnetic resonance images in aging and dementia. Ann Neurol. 2008;63:72–80. doi: 10.1002/ana.21296. [DOI] [PMC free article] [PubMed] [Google Scholar]
- Josephs KA, Dickson DW, Murray ME, Senjem ML, Parisi JE, Petersen RC, Jack CR, Jr, Whitwell JL. Quantitative neurofibrillary tangle density and brain volumetric MRI analyses in Alzheimer’s disease presenting as logopenic progressive aphasia. Brain Lang. 2013;127:127–34. doi: 10.1016/j.bandl.2013.02.003. [DOI] [PMC free article] [PubMed] [Google Scholar]
- Josephs KA, Whitwell JL, Knopman DS, Hu WT, Stroh DA, Baker M, Rademakers R, Boeve BF, Parisi JE, Smith GE, Ivnik RJ, Petersen RC, Jack CR, Jr, Dickson DW. Abnormal TDP-43 immunoreactivity in AD modifies clinicopathologic and radiologic phenotype. Neurology. 2008;70(19 Pt 2):1850–7. doi: 10.1212/01.wnl.0000304041.09418.b1. [DOI] [PMC free article] [PubMed] [Google Scholar]
- Josephs KA, Whitwell JL, Weigand SD, Murray ME, Tosakulwong N, Liesinger AM, Petrucelli L, Senjem ML, Knopman DS, Boeve BF, Ivnik RJ, Smith GE, Jack CR, Jr, Parisi JE, Petersen RC, Dickson DW. TDP-43 is a key player in the clinical features associated with Alzheimer’s disease. Acta Neuropathol. 2014;127:811–24. doi: 10.1007/s00401-014-1269-z. [DOI] [PMC free article] [PubMed] [Google Scholar]
- Kantarci K, Ferman TJ, Boeve BF, Weigand SD, Przybelski S, Vemuri P, Murray ME, Senjem ML, Smith GE, Knopman DS, Petersen RC, Jack CR, Jr, Parisi JE, Dickson DW. Focal atrophy on MRI and neuropathologic classification of dementia with Lewy bodies. Neurology. 2012;79:553–60. doi: 10.1212/WNL.0b013e31826357a5. [DOI] [PMC free article] [PubMed] [Google Scholar]
- Kaur B, Himali JJ, Seshadri S, Beiser AS, Au R, McKee AC, Auerbach S, Wolf PA, Decarli CS. Association Between Neuropathology and Brain Volume in The Framingham Heart Study. Alzheimer Dis Assoc Disord. 2014;28:219–25. doi: 10.1097/WAD.0000000000000032. [DOI] [PMC free article] [PubMed] [Google Scholar]
- Kotrotsou A, Bennett DA, Schneider JA, Dawe RJ, Golak T, Leurgans SE, Yu L, Arfanakis K. Ex vivo MR volumetry of human brain hemispheres. Magn Reson Med. 2014;71:364–74. doi: 10.1002/mrm.24661. [DOI] [PMC free article] [PubMed] [Google Scholar]
- Leverenz JB, Agustin CM, Tsuang D, Peskind ER, Edland SD, Nochlin D, DiGiacomo L, Bowen JD, McCormick WC, Teri L, Raskind MA, Kukull WA, Larson EB. Clinical and neuropathological characteristics of hippocampal sclerosis: a community-based study. Arch Neurol. 2002;59:1099–106. doi: 10.1001/archneur.59.7.1099. [DOI] [PubMed] [Google Scholar]
- Maguire EA, Gadian DG, Johnsrude IS, Good CD, Ashburner J, Frackowiak RS, Frith CD. Navigation-related structural change in the hippocampi of taxi drivers. Proc Natl Acad Sci U S A. 2000;97:4398–403. doi: 10.1073/pnas.070039597. [DOI] [PMC free article] [PubMed] [Google Scholar]
- McKhann G, Drachman D, Folstein M, Katzman R, Price D, Stadlan EM. Clinical diagnosis of Alzheimer’s disease: report of the NINCDS-ADRDA Work Group under the auspices of Department of Health and Human Services Task Force on Alzheimer’s Disease. Neurology. 1984;34:939–44. doi: 10.1212/wnl.34.7.939. [DOI] [PubMed] [Google Scholar]
- McKhann GM, Knopman DS, Chertkow H, Hyman BT, Jack CR, Jr, Kawas CH, Klunk WE, Koroshetz WJ, Manly JJ, Mayeux R, Mohs RC, Morris JC, Rossor MN, Scheltens P, Carrillo MC, Thies B, Weintraub S, Phelps CH. The diagnosis of dementia due to Alzheimer’s disease: recommendations from the National Institute on Aging-Alzheimer’s Association workgroups on diagnostic guidelines for Alzheimer’s disease. Alzheimers Dement. 2011;7:263–9. doi: 10.1016/j.jalz.2011.03.005. [DOI] [PMC free article] [PubMed] [Google Scholar]
- National Institute on Aging, and Reagan Institute Working Group on Diagnostic Criteria for the Neuropathological Assessment of Alzheimer’s Disease. Consensus recommendations for the postmortem diagnosis of Alzheimer’s disease. Neurobiol Aging. 1997;18(S4):S1–2. [PubMed] [Google Scholar]
- Raman MR, Preboske GM, Przybelski SA, Gunter JL, Senjem ML, Vemuri P, Murphy MC, Murray ME, Boeve BF, Knopman DS, Petersen RC, Parisi JE, Dickson DW, Jack CR, Jr, Kantarci K. Antemortem MRI findings associated with microinfarcts at autopsy. Neurology. 2014;82:1951–8. doi: 10.1212/WNL.0000000000000471. [DOI] [PMC free article] [PubMed] [Google Scholar]
- Risacher SL, Saykin AJ. Neuroimaging biomarkers of neurodegenerative diseases and dementia. Semin Neurol. 2013;33:386–416. doi: 10.1055/s-0033-1359312. [DOI] [PMC free article] [PubMed] [Google Scholar]
- Rohrer JD, Geser F, Zhou J, Gennatas ED, Sidhu M, Trojanowski JQ, Dearmond SJ, Miller BL, Seeley WW. TDP-43 subtypes are associated with distinct atrophy patterns in frontotemporal dementia. Neurology. 2010;75:2204–11. doi: 10.1212/WNL.0b013e318202038c. [DOI] [PMC free article] [PubMed] [Google Scholar]
- Salat DH, Greve DN, Pacheco JL, Quinn BT, Helmer KG, Buckner RL, Fischl B. Regional white matter volume differences in nondemented aging and Alzheimer’s disease. Neuroimage. 2009;44:1247–58. doi: 10.1016/j.neuroimage.2008.10.030. [DOI] [PMC free article] [PubMed] [Google Scholar]
- Schneider JA, Arvanitakis Z, Bang W, Bennett DA. Mixed Brain Pathologies Account for Most Dementia Cases in Community-Dwelling Older Persons. Neurology. 2007a;69:2197–2204. doi: 10.1212/01.wnl.0000271090.28148.24. [DOI] [PubMed] [Google Scholar]
- Schneider JA, Arvanitakis Z, Leurgans SE, Bennett DA. The neuropathology of probable Alzheimer disease and mild cognitive impairment. Ann Neurol. 2009;66:200–8. doi: 10.1002/ana.21706. [DOI] [PMC free article] [PubMed] [Google Scholar]
- Schneider JA, Arvanitakis Z, Yu L, Boyle PA, Leurgans SE, Bennett DA. Cognitive impairment, decline, and fluctuations in older community-dwelling persons with Lewy bodies. Brain. 2012;135:3005–3014. doi: 10.1093/brain/aws234. [DOI] [PMC free article] [PubMed] [Google Scholar]
- Schneider JA, Boyle PA, Arvanitakis Z, Bienias JL, Bennett DA. Subcortical infarcts, Alzheimer’s disease pathology, and memory function in older persons. Ann Neurol. 2007b;62:59–66. doi: 10.1002/ana.21142. [DOI] [PubMed] [Google Scholar]
- Schneider JA, Wilson RS, Bienias JL, Evans DA, Bennett DA. Cerebral infarctions and the likelihood of dementia from Alzheimer’s disease pathology. Neurology. 2004;62:1148–56. doi: 10.1212/01.wnl.0000118211.78503.f5. [DOI] [PubMed] [Google Scholar]
- Smith CD, Snowdon DA, Wang H, Markesbery WR. White matter volumes and periventricular white matter hyperintensities in aging and dementia. Neurology. 2000;54:838–842. doi: 10.1212/wnl.54.4.838. [DOI] [PubMed] [Google Scholar]
- Toledo JB, Cairns NJ, Da X, Chen K, Carter D, Fleisher A, Householder E, Ayutyanont N, Roontiva A, Bauer RJ, Eisen P, Shaw LM, Davatzikos C, Weiner MW, Reiman EM, Morris JC, Trojanowski JQ The Alzheimer’s Disease Neuroimaging Initiative. Clinical and multimodal biomarker correlates of ADNI neuropathological findings. Acta Neuropathol Commun. 2013;1:65. doi: 10.1186/2051-5960-1-65. [DOI] [PMC free article] [PubMed] [Google Scholar]
- Vemuri P, Simon G, Kantarci K, Whitwell JL, Senjem ML, Przybelski SA, Gunter JL, Josephs KA, Knopman DS, Boeve BF, Ferman TJ, Dickson DW, Parisi JE, Petersen RC, Jack CR., Jr Antemortem differential diagnosis of dementia pathology using structural MRI: Differential-STAND. Neuroimage. 2011;55:522–31. doi: 10.1016/j.neuroimage.2010.12.073. [DOI] [PMC free article] [PubMed] [Google Scholar]
- Weiner MW, Veitch DP, Aisen PS, Beckett LA, Cairns NJ, Green RC, Harvey D, Jack CR, Jagust W, Liu E, Morris JC, Petersen RC, Saykin AJ, Schmidt ME, Shaw L, Shen L, Siuciak JA, Soares H, Toga AW, Trojanowski JQ Alzheimer’s Disease Neuroimaging Initiative. The Alzheimer’s Disease Neuroimaging Initiative: a review of papers published since its inception. Alzheimers Dement. 2013;9:e111–194. doi: 10.1016/j.jalz.2013.05.1769. [DOI] [PMC free article] [PubMed] [Google Scholar]
- Whitwell JL, Dickson DW, Murray ME, Weigand SD, Tosakulwong N, Senjem ML, Knopman DS, Boeve BF, Parisi JE, Petersen RC, Jack CR, Jr, Josephs KA. Neuroimaging correlates of pathologically defined subtypes of Alzheimer’s disease: a case-control study. Lancet Neurol. 2012;11:868–77. doi: 10.1016/S1474-4422(12)70200-4. [DOI] [PMC free article] [PubMed] [Google Scholar]
- Whitwell JL, Jack CR, Jr, Parisi JE, Knopman DS, Boeve BF, Petersen RC, Dickson DW, Josephs KA. Imaging signatures of molecular pathology in behavioral variant frontotemporal dementia. J Mol Neurosci. 2011;45:372–8. doi: 10.1007/s12031-011-9533-3. [DOI] [PMC free article] [PubMed] [Google Scholar]
- Whitwell JL, Josephs KA, Murray ME, Kantarci K, Przybelski SA, Weigand SD, Vemuri P, Senjem ML, Parisi JE, Knopman DS, Boeve BF, Petersen RC, Dickson DW, Jack CR., Jr MRI correlates of neurofibrillary tangle pathology at autopsy: a voxel-based morphometry study. Neurology. 2008;71:743–9. doi: 10.1212/01.wnl.0000324924.91351.7d. [DOI] [PMC free article] [PubMed] [Google Scholar]
- Wilson RS, Barnes LL, Bennett DA. Assessment of lifetime participation of cognitively stimulating activities. Journal of Clinical and Experimental Neuropsychology. 2003;25:634–42. doi: 10.1076/jcen.25.5.634.14572. [DOI] [PubMed] [Google Scholar]
- Yu L, De Jager PL, Yang J, Trojanowski JQ, Bennett DA, Schneider JA. The TMEM106B locus and TDP-43 pathology in older persons without FTLD. Neurology. 2015;84:927–34. doi: 10.1212/WNL.0000000000001313. [DOI] [PMC free article] [PubMed] [Google Scholar]
- Zarow C, Wang L, Chui HC, Weiner MW, Csernansky JG. MRI shows more severe hippocampal atrophy and shape deformation in hippocampal sclerosis than in Alzheimer’s disease. Int J Alzheimers Dis. 2011;2011:483972. doi: 10.4061/2011/483972. [DOI] [PMC free article] [PubMed] [Google Scholar]