

Abstract
A multifunctional microRNA, miR-155, has been recently recognized as an important modulator of numerous biological processes. In our previous in vitro studies, miR-155 was identified as a potential regulator of the endothelial morphogenesis. The present study demonstrates that in vivo inhibition of miR-155 supports cerebral vasculature after experimental stroke. Intravenous injections of a specific miR-155 inhibitor were initiated at 48 h after mouse distal middle cerebral artery occlusion (dMCAO). Microvasculature in peri-infarct area, infarct size, and animal functional recovery were assessed at 1, 2, and 3 weeks after dMCAO. Using in vivo two-photon microscopy, we detected improved blood flow and microvascular integrity in the peri-infarct area of miR-155 inhibitor-injected mice. Electron microscopy revealed that, in contrast to the control group, these animals demonstrated well preserved capillary tight junctions (TJs). Western blot analysis data indicate that improved TJ integrity in the inhibitor-injected animals could be associated with stabilization of the TJ protein ZO-1 and mediated by the miR-155 target protein Rheb. MRI analysis showed significant (34%) reduction of infarct size in miR-155 inhibitor-injected animals at 21 d after dMCAO. Reduced brain injury was confirmed by electron microscopy demonstrating decreased neuronal damage in the peri-infarct area of stroke. Preservation of brain tissue was reflected in efficient functional recovery of inhibitor-injected animals. Based on our findings, we propose that in vivo miR-155 inhibition after ischemia supports brain microvasculature, reduces brain tissue damage, and improves the animal functional recovery.
SIGNIFICANCE STATEMENT In the present study, we investigated an effect of the in vivo inhibition of a microRNA, miR-155, on brain recovery after experimental cerebral ischemia. To our knowledge, this is the first report describing the efficiency of intravenous anti-miRNA injections in a mouse model of ischemic stroke. The role of miRNAs in poststroke revascularization has been unexplored and in vivo regulation of miRNAs during the subacute phase of stroke has not yet been proposed. Our investigation introduces a new and unexplored approach to cerebral regeneration: regulation of poststroke angiogenesis and recovery through direct modulation of specific miRNA activity. We expect that our findings will lead to the development of novel strategies for regulating neurorestorative processes in the postischemic brain.
Keywords: ischemia, microRNA, microvasculature, neuroprotection, regeneration, stroke
Introduction
Stroke-induced cerebral endothelial injury and inflammation impair endothelial function and thus increase cerebrovascular permeability and blood–brain barrier (BBB) leakage, leading to primary and secondary ischemic brain injury (del Zoppo et al., 2003; Brouns et al., 2009). Functional recovery is highly dependent on the effective restoration of blood supply to the damaged but viable peri-infarct area (Navaratna et al., 2009). Therefore, extensive investigation has been concentrated on poststroke vascularization with the aim of promoting the recovery process (Xiong et al., 2010; Chen et al., 2014).
Ischemic stroke induces significant changes in the gene profile of the neurovascular elements (Carmichael, 2003; Liu et al., 2007). microRNAs (miRNAs) are recently identified short mRNA-interfering molecules that regulate gene expression and thus significantly influence essential cellular processes (Kato et al., 2008; Fabian et al., 2010). miRNAs control posttranscriptional gene expression in many tissues, including the brain; are highly expressed in the vasculature; and serve as critical modulators for vascular cell functions (Suárez et al., 2007; Costa et al., 2013; Pecot et al., 2013). Considerable changes in miRNA profiles are associated with stroke at different perfusion times after experimental ischemia (Huang et al., 2010; Liu et al., 2010). Our previous studies demonstrated that miR-155 negatively regulates proangiogenic signaling pathways in mouse brain endothelial cells. Inhibition of miR-155 significantly enhanced, whereas overexpression significantly inhibited, in vitro endothelial morphogenesis (Roitbak et al., 2011). We therefore speculated that miR-155 could also coordinate vascular functions in vivo.
miR-155 has been implicated in regulating various physiological and pathological processes such as hematopoietic lineage differentiation, immunity, inflammation, cancer, and cardiovascular diseases (Faraoni et al., 2009; O'Connell et al., 2010). miR-155 is specifically expressed in hematopoietic cells and cells involved in vascular remodeling, including B cells, T cells, monocytes, and granulocytes, as well as endothelial cells and smooth muscle cells (Landgraf et al., 2007; Sun et al., 2012). miR-155 regulates the development of inflammatory T cells and promotes tissue inflammation. Specific inhibition of this miRNA is accompanied by reduced inflammation, which makes it a promising therapeutic target in proinflammatory conditions (Kurowska-Stolarska et al., 2011; Murugaiyan et al., 2011). Among other functions, miR-155 is significantly associated with endothelial and vascular function: its specific inhibition results in increased endothelial nitric oxide synthase (eNOS) expression and nitric oxide (NO) production and reduction of vascular inflammation, whereas overexpression alters endothelial cell morphology and impedes endothelial cell migration (Sun et al., 2012; Weber et al., 2014). miR-155−/− mice also exhibit accelerated wound healing processes, thus demonstrating an increased regeneration capacity (van Solingen et al., 2014). Interestingly, miR-155 is among the miRNAs significantly affected by cerebral ischemia (Liu et al., 2010).
Systemic administration of the miRNA inhibitors and mimics to regulate the activity of specific miRNAs had recently been identified as attractive target for therapeutic intervention (Linnstaedt et al., 2010; Zhang et al., 2013). In vivo regulation of miRNA activity is expected to provide a future therapeutic potential for the treatment of cancer and cardiovascular and diseases (Shi et al., 2010; Moon et al., 2013); delivery of synthetic miRNAs and miRNA inhibitors to tumor tissue is already used in animal studies (Takeshita et al., 2010; Wiggins et al., 2010).
A subacute phase of ischemia is associated with postischemic vascular remodeling (Ding et al., 2008; Beck et al., 2009) and our aim is to find a way to promote this natural regeneration process. The present investigation introduces a novel approach to cerebral regeneration: regulation of the vascular functions and overall recovery through direct modulation of specific miRNA activity.
Materials and Methods
Animal groups.
The experimental procedures were performed in accordance with the University of New Mexico Office of Animal Care Compliance. All institutional and national guidelines for the care and use of laboratory animals were followed. Two-month-old C57BL/6 male mice (Jackson Laboratories) were used in our experiments. In total, 120 mice were subjected to the experimental cerebral ischemia; 59 were used for the in vivo evaluation of cerebral blood flow and capillary density and permeability and 22 were used for MRI-based evaluation of the brain injury and cerebral perfusion. An additional 20 mice were used for the pilot studies to assess the efficiency of miR-155 in vivo inhibition and for sham surgeries. A total of 50 mice were used for the concomitant behavioral studies. Experimental groups included intact mice, sham-operated mice, mice subjected to distal middle cerebral artery occlusion (dMCAO) and specific miR-155 inhibitor injections (Inhibitor group), and mice subjected to dMCAO and control (scrambled) miRNA inhibitor injections (Control group).
dMCAO procedure.
dMCAO was used as an experimental model of cortical ischemia (Kuraoka et al., 2009; Pena-Philippides et al., 2014). This model produces an infarct in the frontal and parietal cortex, which over time progresses into adjacent temporal, frontal, and cingulate cortex. In addition to its high reproducibility and survival rate, the advantage of this model is that it produces a smaller infarct comparable to human stroke (Carmichael, 2005). In addition, dMCAO induces mostly cortical ischemia and thus represents a convenient model for in vivo imaging, which is limited by its depth penetration capacities. dMCAO was performed on 2-month-old male C57BL/6 mice (Jones et al., 2008; Kuraoka et al., 2009). The mice were anesthetized using isoflurane gas (induction dosage 2–3%; maintenance dosage 1.5–2%) and a mixture of O2:N2O gases in the ratio 2:1 delivered during the surgery. The middle cerebral artery (MCA) was exposed via a transtemporal approach (Jones et al., 2008; Kuraoka et al., 2009). A small burr hole (located 1 mm rostral to the fusion of zygoma and squamosal bone and 3 mm ventral to the parietal bone) was made on the left side of the skull surface and the MCA was coagulated with low-heat electrocautery (Bovie Medical). In sham-operated animals, the MCA was exposed but not coagulated.
miRNA inhibitor injections.
Our study used a novel, second-generation-specific inhibitor for miR-155, which has been recently developed by Exiqon. Specific miRNA inhibitors are designed using novel locked nucleic acid (LNA) technology, which greatly increases the affinity of the inhibitors for their target miRNAs and improves their resistance to enzymatic degradation. These features are especially important for the in vivo studies because the oligonucleotides have high knock-down efficiency at low concentrations, which reduces the risk of negative and off-target side effects. Injections of a specific anti-miR-155 miRCURY LNA inhibitor or control inhibitor (scrambled oligonucleotide) from Exiqon were initiated 48 h after dMCAO and performed for 3 consecutive days. Oligonucleotides were introduced via mouse lateral tail vein; the dose was 10 mg/kg in saline, total injected volume was 100 μl.
In vivo two-photon laser scanning microscopy.
In vivo two-photon laser scanning microscopy (2PLSM) was performed 7, 14, and 21 d after dMCAO as described previously (Kleinfeld et al., 1998; Bragin et al., 2011). Imaging was performed at the stereotactic coordinates 2 mm caudal and 2.5 mm lateral to bregma through the optical windows (1 mm2) over both lesioned and nonlesioned hemispheres. According to 2PLSM measurements and MRI performed 24 h after dMCAO, this region is characterized by reduced blood flow and is localized within ∼400 μm from the infarct border. Based on our own measurements and on the existing literature, this region was defined as a peri-infarct area of stroke (Li et al., 2008; Murphy et al., 2009; Ueno et al., 2012; López-Valdés et al., 2014). An Olympus BX51WI upright microscope and water-immersion LUMPlan FL/IR 20×/0.50 W objective were used for the imaging. Excitation (740 nm) was provided by a Prairie View Ultima multiphoton laser scan unit powered by a Millennia Prime 10 W diode laser source pumping a Tsunami Ti:sapphire laser (Spectra-Physics) tuned up to 810 nm center wavelength. Images (512 × 512 pixels, 0.15 μm/pixel in the x- and y-axes) or line scans were acquired using Prairie View software. Cranial windows (1 mm in diameter) for the imaging were made at the stereotactic coordinates bregma −2 mm and L 2.5 mm over both lesioned and nonlesioned hemispheres.
Microvascular red blood cell (RBC) flow velocity was measured by the line scan mode of 2PLSM. Blood plasma was labeled by the injection of ∼100 μl of fluorescein-labeled dextran (70 kDa; Sigma-Aldrich) at an initial concentration of 150 μm. Fluorescence was band-pass filtered at 500–550 nm. A total of ∼100 microvessels (2–50 μm diameter) per hemisphere in an imaging volume of 500 × 500 × 300 μm = 0.075 mm3 were scanned. A line scan through a microvessel led to a sequence of alternating bright and dark diagonal bands in a space–time image corresponding to labeled fluorescent plasma and unlabeled dark RBCs and slope of the stripes inversely reflects RBC velocity. The width, sharpness, and angle of the dark bands representing the RBC motion, as well as the distance between them, were evaluated to calculate the RBC flow velocity in offline analyses using Rincon version 7.7 software.
Evaluation of microvessel density.
The 3D anatomy of the vasculature in the region of interest was reconstructed from z-series of 2D (planar) scans (500 × 500 μm) obtained at consecutive depths in the cortex with 10 μm steps from brain surface to 300 μm in depth. In offline analyses using ImageJ, the microvessel diameters were measured to differentiate capillaries from other microvessels and density was quantified assuming that one capillary is a microvessel from bifurcation to bifurcation. The capillaries were identified by diameters (3–8 μm) (Schiszler et al., 2000), mean of ∼5 μm (Motti et al., 1986; Seylaz et al., 1999), tortuosity, and single-file RBCs (Hudetz et al., 1995; Hauck et al., 2004).
Microvascular BBB permeability.
BBB permeability was evaluated by measuring perivascular tissue fluorescence in planar images of the cortex taken at 50 μm depth 30 min after fluorescein dextran injection, as described previously (Bragin et al., 2011; Bragin et al., 2013). In offline analyses using ImageJ, the fluorescence of five randomly chosen regions of interest over the vessel areas and five to 10 areas over perivascular brain parenchyma in both lesioned and nonlesioned/intact hemispheres were measured. The obtained measurements in the interstitial space were normalized to the maximal fluorescence intensity in the blood vessels and expressed as a percentage fluorescence intensity (modified from Egawa et al., 2013). Thirty minutes after fluorescein-dextran injection in a healthy brain, bright vessels filled with fluorescein-dextran are seen clearly over the dark background of unstained tissue, reflecting intact BBB. Increased perivascular tissue fluorescence due to fluorescein leakage from microvessels into the brain parenchyma indicates impaired BBB.
Electron microscopy.
For electron microscopy (EM), mice were perfused with 0.5% glutaraldehyde, 2.5% paraformaldehyde in 0.1 m Sorensen's buffer. Cortical tissue (1×1 mm) was dissected from the areas imaged during 2PLSM analysis (identified by the cranial window openings) from the hemisphere both ipsilateral and contralateral to ischemic damage. Samples were fixed in 2% osmium, dehydrated, embedded in Araldite, thin-sectioned to 80–90 nm, and stained with 4% uranyl acetate in methanol followed by lead citrate as described previously (Lippman et al., 2008). Images were acquired using a Hitachi H7500 transmission electron microscope equipped with an AMT X60 camera. Three to four animals per experimental group (Control and Inhibitor) were used for analysis; high-magnification (800–15,000×) images were taken both in the lesioned and intact hemispheres. The following analysis methods were used for the ultastructural evaluation of capillaries and neurons.
To evaluate the vascular damage and TJ integrity 7 d after dMCAO, 205 capillaries (<8 μm in diameter) from the lesioned and unlesioned hemispheres were imaged and analyzed. On average, 85–87 capillaries/group were evaluated in the lesioned hemispheres and 30–40 in the intact hemispheres. Endothelial cell integrity, intracellular (inside the endothelial cells and pericytes) and perivascular vacuoles, perivascular astrocytic processes, and basal lamina were evaluated to assess microvascular damage. The major ultrastructural criterion for TJ integrity was an existence of the intermediate dark (electron-dense) layer that is formed by multilayered membrane units of the TJs (Castejón, 2012). Capillaries with all intact TJs were considered normal/intact, whereas capillaries with at least one partially or fully opened/disrupted TJ unit were considered partially opened or opened, respectively. In addition, 186 capillaries from the lesioned and unlesioned hemispheres of both groups of animals were imaged and analyzed for assessment of microvasculature 21 d after dMCAO.
To evaluate neuronal damage 21 d after dMCAO, 430 neurons from the lesioned and unlesioned hemispheres were imaged and analyzed. On average, 172 neurons per group were evaluated in the lesioned hemispheres of the Control and Inhibitor groups and 43 neurons/group in the nonlesioned hemispheres of both groups. Major criteria for neuronal damage evaluation were as follows: shape and integrity of the nuclei, presence of intracellular vacuoles, mitochondrial swelling, ER dilation and damage, chromatin accumulation, and overall cytoplasm appearance.
MRI. T2-weighted MRI.
Infarct size was evaluated using MRI at 24 h and 7, 14, and 21 d after dMCAO using a 4.7 T Biospec dedicated research MR scanner (Bruker) equipped with a single tuned surface coil for mouse brain (RAPID Biomedical). The mice were anesthetized using isoflurane gas (induction dosage 2–3%; maintenance dosage 1.5–2%) and a mixture of O2:N2O gases in the ratio 2:1 delivered during the measurements. Real-time monitoring of physiological parameters (heart rate and respiratory rate) was performed during the entire duration of the study. A tri-pilot scan using gradient echo sequence was used to acquire initial localizer images. T2-weighted MRI was performed with a fast spin-echo sequence (RARE), TR/TE = 5000/56 ms, FOV = 4 cm × 4 cm, slice thickness = 1 mm, interslice distance = 1 mm, number of slices = 12, matrix = 256 × 256, number of average = 3.
Infarct volume was calculated based on the widely used method proposed previously (Swanson et al., 1990) using ImageJ analysis software. The optical density threshold was determined for the gray matter in the unlesioned control hemisphere in each slice and used for the recognition of normal gray matter in the lesioned hemisphere. The areas of noninfarcted (normal) brain tissue were measured in nonlesioned intact (I) and lesioned (L) hemispheres in each T2-weighted MRI slice. The measured areas were summarized and the respective VI and VL volumes were calculated by multiplying each sum by the distance between slices (1 mm). The infarction volume was expressed as a percentage of the volume of the control hemisphere, using the following formula: %I = 100 × (VI − VL)/VI.
Quantitative measurements of cerebral blood flow using MRI.
In the same MRI sessions, tissue perfusion was measured using noninvasive arterial spin labeling method (ASL) (Kim, 1995). The sequence Flow-sensitive Alternating Inversion Recovery Rapid Acquisition with Relaxation Enhancement (FAIR-RARE) was used to implement ASL with parameters: TE/TR = 46/16000 ms, FOV = 2.56 cm × 2.56 cm, slice thickness = 1 mm, number of slices = 1, matrix = 128×128. A perfusion map was calculated using the ASL Perfusion Processing macro in ParaVision 5.1 (Bruker). Perfusion associated with specific areas of the brain was determined using interpolation method and corresponding T2-weighted MRI scans. Cortical areas of interest from the L and I hemispheres were selected from the corresponding T2-weighted MRI scans and interpolated to perfusion maps. Because the exact borders of the peri-infarct region are difficult to define, the measurements were performed in the whole sensorimotor cortex area adjacent to the dMCAO-induced cortical lesion and the analogous area of the intact hemisphere. Similar to infarct size measurements, brain tissue perfusion in the hemisphere ipsilateral to the lesion was expressed as a percentage of that in the intact hemisphere.
PCR.
Three and 7 d after completion of miR-155 or control inhibitor injections (which started 48 h after dMCAO and lasted for 3 consecutive days) in dMCAO-subjected mice, 3 brains per experimental group (Inhibitor and Control) were used to generate separate sample triplicates for the analyses. Brain cortices were dissected and stored in RNAlater solution (Ambion). Total RNA was isolated using mirVana miRNA (Ambion) isolation kit from the hemispheres ipsilateral to dMCAO injury. qRT-PCR was used to evaluate miR-155 expression in the samples using a TaqMan MicroRNA reverse transcription kit and miR-155 specific TaqMan microRNA assay (Ambion). PCR array experiments were performed in collaboration with the University of New Mexico CUGR (Keck-UNM Genomic Resource) Affymetrix facility. Expression of miR-155 target genes was assessed using miR-155 Targets PCR Array (Qiagen). Mouse Cytokines and Chemokines PCR Array (Qiagen) was used to evaluate the expression of major pro- and anti-inflammatory cytokines and chemokines in the RNA samples. All measurements and data quantification were performed by the Qiagen Company Sample and Assay Technologies team. The obtained raw data were analyzed using RT2 Profiler software (Qiagen). Only the genes with consistent expression levels (within the triplicate samples) were used for statistical analysis. The fold changes of gene expressions (Inhibitor vs Control group) were calculated and the transcripts that showed ≥1.5-fold change in expression (either upregulated or downregulated) were retained. At the final step, statistical significance (p < 0.05) and reliability of the results was evaluated automatically.
Western blot analysis.
Three and 7 d after 3 consecutive miR-155 inhibitor or control nucleotide injections in dMCAO-subjected mice, 3 brains per experimental group (Inhibitor and Control) were used to generate separate sample triplicates. Brain cortices were dissected on ice and rapidly frozen. For tissue lysate preparation, brain tissue was homogenized in tissue extraction buffer (Invitrogen catalog # FNN0071; 5 ml per 1 g of brain tissue) with the addition of protease inhibitor mixture (Sigma-Aldrich). The samples were centrifuged at 10,000 rpm for 5 min and supernatant was collected and kept on ice. Protein concentration was determined for each sample using the DC protein assay kit from Bio-Rad. The proteins were separated on 4–20% gradient Criterion precast gels (Bio-Rad). A broad-range molecular weight calibration marker from 10,000 to 250,000 MW (Bio-Rad) was used as a standard. The expression levels of SMAD1 and SMAD5 proteins were detected using specific Antibody Sampler Kits (Cell Signaling Technology) according to the manufacturer's recommendations. The expression of the mTOR pathway components, including Rictor, was detected using mTOR Pathway and mTOR Substates Antibody Sampler Kits (Cell Signaling Technology) according to the manufacturer's recommendations. The following primary antibodies were also used: rabbit polyclonal anti-NOS (Cell Signaling Technology) and anti-eNOS (Millipore) antibodies; rabbit polyclonal anti-ZO-1 antibodies from Millipore and Life Technologies; rabbit monoclonal anti-RhoA and rabbit polyclonal anti-Claudin-1 (Cell Signaling Technology); and mouse monoclonal anti-Claudin-5, rabbit polyclonal anti-VE-Cadherin, and mouse monoclonal anti-Occludin-1 (Invitrogen/Life Technologies). Rabbit monoclonal Phospho-Akt (Ser473 and Thr308) and Rheb (Ras homolog enriched in brain) antibodies were from Cell Signaling Technology. Loading was confirmed by comparing GAPDH and actin immunoreactivity across the lanes using mouse monoclonal anti-GAPDH (Millipore) and monoclonal anti-actin (Sigma-Aldrich). Horseradish peroxidase-labeled secondary antibodies were from Cell Signaling Technology and GE Healthcare. Incubation with both primary and secondary antibodies was performed for 1 h at room temperature. Experiments were performed in triplicate (3 mice per group). The density of the protein bands was determined using ImageJ software, normalized by actin or GAPDH expression, and quantified using Microsoft Excel software.
Immunohistochemistry and fluorescence microscopy.
Animals were perfused with PBS and 4% paraformaldehyde (PFA) and brains were removed and fixed in PFA and subsequently cryoprotected in 30% sucrose. The brains were sectioned along the rostral–caudal axis; 16 μm coronal sections were mounted and subjected to immunostaining. Briefly, the slices were postfixed with 4% PFA, quenched with 50 mm NH4Cl, and permeabilized with 0.2% Triton X-100 in PBS; 10% normal goat serum was used as a blocking buffer. Tissue slides were incubated with primary (fluorophore-conjugated or unconjugated, 1:100 dilution) antibodies overnight at 4°C. Primary antibodies were as follows: rabbit polyclonal anti-Claudin-1 (Cell Signaling Technology); mouse monoclonal anti-Claudin-5 and mouse monoclonal anti-Occludin-1 (Invitrogen/Life Technologies); Alexa Fluor 488 anti-mouse CD-31 (BioLegend); eFluor 570 anti-ZO-1 (eBioscence); and and Cy-3-conjugated anti-NeuN antibody (Millipore). Cy3- or Rhodamine-conjugated secondary antibodies were used at a 1:250 dilution (Jackson ImmunoResearch Laboratories). DAPI staining was used to visualize nuclei. The incubations were performed in the humidity chamber.
Visualization of cerebral vasculature using lectin staining.
The concept and methods for vascular labeling with lectins were adopted from methods described previously (Laitinen, 1987; Porter et al., 1990). Vasculature was visualized using fluorescence staining of brain slices with rhodamine-conjugated Griffonia simplificolia lectin (0.01 mg/ml; Vector Laboratories) or Texas red-conjugated tomato (Lycopersicon esculentum) lectin (0.01 mg/ml; Vector Laboratories). Imaging was performed using a Zeiss LSM510-META confocal microscope.
Assessment of brain tissue damage.
Brain slices were immunostained with Cy-3-conjugated anti-NeuN antibody and imaged using a Nikon Eclipse Ti microscope and Nis Elements, Advanced Research version 4.30.01 software. Six to seven animals per group and 10–15 brain sections per mouse (16 μm thickness) were used for the analysis. Because, at this late stage after dMCAO, the necrotic tissue disappears (due to development of cystic zone), the whole-brain lesion volume was measured according to the indirect method by assessing the size differences between the remaining lesioned and nonlesioned contralateral hemispheres and using methods described previously (Bouet et al., 2009; Lubjuhn et al., 2009). In each section, the areas of both hemispheres were measured using ImageJ software. The infarction of the remaining tissue (in the lesioned hemisphere) was detected by the unstained regions of the section. The infarct area and volume were calculated as described for the MRI-based measurements.
Functional recovery assessment: adhesive removal test.
The pattern of sensorimotor deficits and subsequent recovery was performed in parallel with the in vivo imaging experiments and compared between the control inhibitor, specific miRNA inhibitor-injected, sham-operated, and intact animals (10–12 mice/group). The bilateral asymmetry/adhesive removal test was performed as described previously (Bouet et al., 2009). Two adhesive tapes (∼0.4 cm2) were applied with equal pressure on each animal paw. The order of placement of the adhesive (right or left) was alternated between each animal and each session. The mouse was placed in a transparent plastic box and the times to contact and to remove each adhesive tape were collected, with a maximum of 120 s. Experimenters were blind with regard to the mice groups. Mice were trained daily before (5 d before surgery) and after dMCAO (reminder sessions at days 3–5 after dMCAO). Postsurgery testing was monitored for 25 d after dMCAO (single trial per test day; the in vivo imaging day was skipped). Two parameters were monitored for each paw: contact time (point that the mouse reacts to the presence of adhesive strips) and adhesive removal time. Performances of the 3 final days of each week were averaged as a block.
Gait analysis/CatWalk test.
Gait analysis was performed using the CatWalk automated gait analysis system (Noldus), which is a sensitive tool to assess animal gait and locomotion. The mouse voluntarily traverses a glass walkway and its footprints are captured and quantified with camera and specialized software to generate numerous parameters for qualitative and quantitative analysis of individual footprints and gait. The animals (three experimental groups: Inhibitor, Control, and Intact animal groups, n = 12 animals per experimental group) were trained on the walkway until at least 3 compliant (1–5 s duration, maximum deviation 60%) runs were performed successfully and recorded according to the manufacturer's instructions. The recorded data were analyzed using CatWalk XT versin 10.5.505 software. Animals were trained 1 week before and 2 d after dMCAO and subsequently tested once a week 7, 14, and 21 d after dMCAO (Balkaya et al., 2013).
Animal weight monitoring.
Body weight was monitored in three groups of animals, consisting of Inhibitor, Control, and Intact animals (n = 12 mice per experimental group). The animals were weighted daily starting at day 0 (before dMCAO surgery) and continuing for 21 d after dMCAO.
Statistical analysis.
Statistical analysis was performed using GraphPad Prism version 6.05 or R software. Student's t test was performed for the Western blot (WB) analysis. Group comparisons using two-way ANOVA followed by Sidak's multiple-comparisons test was performed for quantification of blood flow velocity, microvessel density, and permeability (2-photon microscopy studies). One-way ANOVA followed by Sidak's multiple-comparisons test was used for behavioral tests and weight gain analysis. For quantification of the MRI data (infarct size and tissue perfusion), mixed-model repeated-measures with Wald tests between groups were used, followed by Sidak's familywise error rate correction for multiple-comparisons within each hypothesis. ANCOVA was used to assess relationships between the improvements in sensorimotor deficits and infarct size by week, with Wald tests between groups.
Results
Efficiency of in vivo miR-155 inhibition
Mice received intravenous injections of FITC-conjugated specific miR-155 inhibitor or control scrambled oligonucleotide 48 h after dMCAO; injections lasted for 3 consecutive days. At 3 and 7 d after the last injection (7 and 11 d after dMCAO), the brains were collected for fluorescence microscopy and PCR analyses. Confocal microscopy detected FITC-conjugated inhibitor associated with cerebral blood vessels (Fig. 1A, arrows); some inhibitor molecules also crossed the BBB and were seen to be distributed within the brain tissue (Fig. 1A, stars). qRT-PCR of the samples collected 3 d after the last injection showed, on average, ∼50% inhibition of miR-155 expression in the inhibitor-injected (Inhibitor) compared with the scrambled oligonucleotide-injected (Control) animal groups (Fig. 1B, left graph). miR-155 expression returned back to control levels 7 d after the last anti-miR-155 injection (data not shown). Functional efficiency of the in vivo miR-155 inhibition was evaluated in the samples collected from the Inhibitor and Control groups at 3 d after the last injection. miR-155 Targets PCR Array analysis demonstrated significantly (>2-fold, p < 0.05) increased expression of 4 miR-155 direct target genes in the Inhibitor group (compared with Control). Among these genes were: bioinformatically (TargetScan) predicted Dhx40 (DEAH box polypeptide 40), Dync1i1 (dynein cytoplasmic 1 intermediate chain 1), and Zfp652 (encoding zinc finger protein 652), as well as the experimentally verified (Zhu et al., 2011) Agtr1a gene encoding Angiotensin II receptor type A (Fig. 1B, right graph). WB analysis demonstrated significantly increased expression of three miR-155 target proteins in the Inhibitor samples compared with Control samples (Fig. 1C). These proteins included TGF-β/BMP (transforming growth factor-β/bone morphogenetic protein) signaling pathway molecule SMAD5 (Rai et al., 2010; Yin et al., 2010), mTOR (mammalian target of rapamycin) signaling pathway component Rictor (Wan et al., 2014), and NO signaling factor eNOS. The average expression levels of miR-155 target protein SMAD1 (Yin et al., 2010) were slightly elevated, whereas SMAD5 levels were increased by 20.5% and Rictor was increased ∼2.3-fold (131.4%). Robust increase in eNOS levels is in agreement with the findings that eNOS is directly targeted by miR-155 (Sun et al., 2012). Together, these results confirm the efficiency of the in vivo miR-155 inhibition in the mouse brain subjected to dMCAO and 3 d of anti-miR-155 injections.
Figure 1.
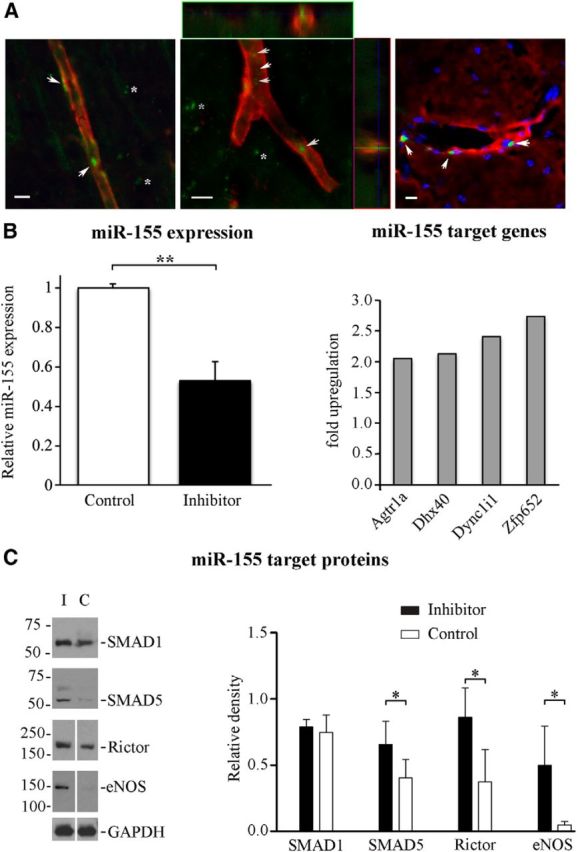
Evaluation of in vivo miR-155 inhibition efficiency 3 d after specific inhibitor injections. A, Distribution of injected FITC-conjugated miR-155 inhibitor (Exiqon) was assessed 3 d after 3 consecutive days of intravenous injections in dMCAO-subjected mice. Vasculature was visualized using fluorescence staining of the brain slices with Rhodamine-conjugated Griffonia simplificolia lectin (red on left and middle panels); endothelial cells were labeled with Texas red-conjugated Tomato lectin (red on the right panel; blue indicates DAPI staining). Confocal microscopy imaging detected FITC-positive oligonucleotides (green, arrows) associated with the wall and lumen of the cerebral blood vessels (left panel and orthogonal image projections on middle panel) and incorporated within blood vessel endothelium (right). FITC-conjugates were also seen in the brain parenchyma (stars), demonstrating BBB permeability of the injected inhibitor. Scale bars, 10 μm. B, Left, MiR-155 expression in the lesioned hemispheres of the animals injected with specific anti-miR-155 (black bar) or scrambled control (white bar) 3 d after the last injection (qRT-PCR with TaqMan miR-155 primers). Right, miR-155 Targets PCR Array was performed to detect the expression of miR-155 target genes in the same samples. miR-155 inhibition resulted in significant (>2-fold, p < 0.05) increase in expression of 4 direct miR-155 target genes. Error bars indicate SD. C, Expression of miR-155 target proteins in samples from the Inhibitor (lane I and black bars on graph) and Control (lane C and white bars on graph) groups. GAPDH expression was used for a loading control. Protein bands were quantified using ImageJ software and relative density values (normalized to GAPDH expression) were plotted on the graph. For all experiments: *p < 0.05, **p < 0.01, Student's t test. Error bars indicate SD. n = 3 mice per group.
In vivo miR-155 inhibition results in the improved blood flow and supports cerebral microvasculature after dMCAO
2PLSM was used to evaluate the functional cerebral vasculature in the Control and Inhibitor groups, at 7, 14 and 21 d after dMCAO. The representative z-projection planar scans in Figure 2, A and B, demonstrate the microvascular network (visualized by the intravenous fluorescent dextran injection) in the peri-infarct area of the control and inhibitor-injected mice, respectively. High-magnification scans visualizing the RBC motion in the individual capillaries (Fig. 2A,B, boxed) from the control (Fig. 2C,E) and miR-155 inhibitor-injected (Fig. 2D,F) animals demonstrate an increased blood flow velocity in the inhibitor-injected mice compared with control mice. The RBC flow calculations are based on the angle (inversely reflecting the flow velocity) of the dark stripes representing the RBC motion and the distance between them (see Materials and Methods). The obtained line-scan data (Fig. 2G) show that, in the lesioned hemispheres of the Control group, the RBC flow velocity in the capillaries remained significantly lower compared with the lesioned hemispheres of the Inhibitor group for up to 14 d after dMCAO. Importantly, at every time point after stroke (7, 14, and 21 d), the blood flow velocity in the lesioned hemispheres of the Control group remained significantly decreased (30%, 54%, and 30% lower than in the nonlesioned hemispheres, respectively). In the Inhibitor group, the microvascular flow velocity in the lesioned hemisphere was similar to the velocity in the nonlesioned (intact) hemisphere 7 d after stroke and decreased at 14 and 21 d (20% and 16% lower than in the intact hemisphere, respectively). The RBC flow in larger (>10 μm diameter) microvessels was not significantly different within the groups and hemispheres at any of the three time points analyzed (data not shown). To evaluate microvascular density, capillaries from each planar scan were counted in the hemispheres ipsilateral and contralateral to dMCAO injury. Capillary numbers per 0.05 mm3 were calculated and plotted in Fig. 2H. The capillary density in the peri-infarct area of the anti-miR-155 injected animals was similar to the nonlesioned hemispheres at all three time points after stroke. Seven days after dMCAO, the capillary density in the lesioned hemispheres of the Control group was significantly lower compared with the intact hemispheres. No significant differences in the microvessel density were seen within the groups at 14 and 21 d after dMCAO (Fig. 2H). Because miR-155-defficient mice have been demonstrated to have a reduced BBB leakage/breakdown (Lopez-Ramirez et al., 2014), we performed the analysis of vascular permeability using 2-photon microscopy scans. Quantification of the vascular permeability presented in Figure 2I shows the values of relative fluorescence signal intensity in the interstitial space of the lesioned and nonlesioned hemispheres of the Control and Inhibitor groups. The data demonstrate that, 7 d after dMCAO, the microvascular leakage in the lesioned hemisphere of the inhibitor-injected mice was significantly lower compared with the lesioned hemisphere of the Control group. In contrast to the Inhibitor group, in the Control gropu, permeability in the lesioned hemispheres was significantly higher compared with nonlesioned hemispheres. Fourteen days after dMCAO, vascular leakage in the lesioned hemispheres decreased in both groups of animals and remained similar to the intact hemispheres for up to 21 d after dMCAO (Fig. 2I). In summary, the evaluation of cerebral microvasculature demonstrates that anti-miR-155 injections initiated 48 h after dMCAO result in significant improvement in the microvascular circulation, capillary density, and BBB integrity 7 d after the experimental stroke. At the later stages (14 and 21 d after dMCAO), no significant differences in capillary density and integrity were observed between the two experimental groups or between the lesioned and intact hemispheres. This could be associated with reduced potency of miR-155 inhibition by this time or activation of the natural postischemic vascular remodeling process in all animals.
Figure 2.
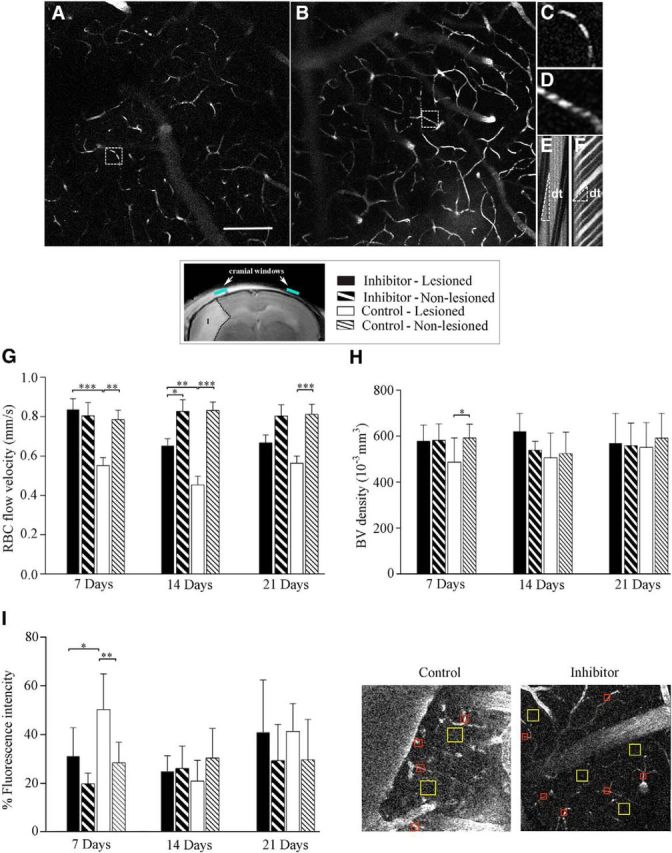
2PLSM evaluation of microvasculature. 2PLSM micrographs of cerebral vasculature in the peri-infarct area of the Control (A) and Inhibitor (B) groups visualized by intravenous injections of 70 kDa Fluorescein-labeled dextran (maximal intensity projection from 10 planar scans acquired every 10 μm); 7 d after dMCAO. Scale bar, 100 μm. Illustration of the RBC flow in the individual microvessels from Control (C) and Inhibitor (D) groups (boxed on A and B and shown at higher magnification). Line-scan data for blood flow velocities in the capillaries (C, D) demonstrate higher velocity in the Inhibitor group (F, the RBCs reach longer distance in a shorter time, dt) compared with Controls (E). G–I, Analysis of the average RBC flow velocity (G), capillary density (H), and permeability (I) in the lesioned and nonlesioned hemispheres of the Inhibitor and Control groups 7, 14, and 21 d after dMCAO. Localization of the cranial windows for the optical imaging relative to the infarction (detected 24 h after dMCAO) and the legend for all graphs are shown in the box. G, Width, sharpness, and angle of the dark bands representing RBC motion, as well as the distance between them, were evaluated to calculate the RBC flow velocity (mm/s) in 100 microvessels per hemisphere using Rincon 7.7 software. Error bars indicate SEM. n = 12 mice per group. H, Capillary density was calculated from 3D projections of z-scan series (from the brain surface to 300 μm in depth) and plotted as the number of capillaries in 10−3 mm3. Error bars indicate SD. n = 6–10 mice per group. I, Analysis of microvascular permeability was performed 7, 14, and 21 d after dMCAO. The representative micrographs depict the quantification of micrvascular permeability in the peri-infarct area of the Control and Inhibitor animal groups 7 d after dMCAO. The blood vessel area (red squares on 2PLSM micrograph) and interstitial space (yellow squares) were manually defined and fluorescence intensity in each area was measured using ImageJ software. The percentage fluorescence intensity in the perivascular area reflecting the BBB leakage is plotted at 7, 14, and 21 d. Error bars indicate SD. n = 6–8 mice per group. Statistical analysis for all graphs: *p < 0.05, **p < 0.01, ***p < 0.001, two-way ANOVA followed by Sidak's multiple-comparisons test.
In vivo miR-155 inhibition supports the integrity of endothelial tight junctions
Based on the vascular permeability data obtained by 2-photon microscopy, we assessed the microvascular damage and ultrastructural alterations of the endothelial TJs in the Control and Inhibitor groups using transmission EM. Seven days after dMCAO, capillaries in the nonlesioned hemisphere of both Control and Inhibitor mouse groups had a normal appearance and were surrounded by healthy looking, undamaged brain tissue (Fig. 3A,C). In the lesioned hemispheres of both experimental groups, the capillaries were narrowed due to perivascular edema represented by heavily swollen astrocyte end feet and large vacuoles (Fig. 3D,G). Endothelial damage (vacuoles in the cytoplasm, endothelial cell denudation) and disturbed and disintegrated basal lamina were observed in Controls. TJ units in these capillaries were often disrupted and not clearly identifiable (Fig. 3E). In contrast to the Control group, TJs in the majority of capillaries (even in the narrowed or collapsed ones) of the Inhibitor samples had an intact appearance (Fig. 3G,H). In addition, the tissue from the inhibitor-injected animals was less edematous and less vacuolated compared with the Control group (Fig. 3F,I). Neurons had a normal appearance in both groups. Detailed analysis and comparison of TJ integrity between the Inhibitor and Control groups is demonstrated in Figure 3J. Analysis revealed that, in the nonlesioned hemispheres of both experimental groups (combined together since there was no difference in TJ appearance), 85% of all imaged capillaries had closed and 12% had partially opened TJs. In the lesioned hemispheres of the Control group, only 18.5% of all capillaries had intact TJs; 44.6% had at least one partially opened TJ unit, whereas 30.7% of them had opened/disrupted TJs. In contrast, in the lesioned hemisphere of the Inhibitor group, only 8.9% capillaries had opened/disrupted and 16.5% had partially opened TJs; all TJs were intact/closed in 58% of capillaries. Therefore, in the Inhibitor group, the percentage of closed (intact) TJ units was significantly (p < 0.05) higher, whereas the fraction of disrupted TJs was significantly lower, compared with the Control group. Approximately 16% of the microvessels in the Inhibitor group and 6% in the Control group were represented by very small capillaries of 2–4 μm diameter, which did not have well defined TJs (Fig. 3J, purple bars). Twenty-one days after dMCAO, there were no apparent differences in the structural integrity of TJs between the Control and Inhibitor groups. However, as high as 35% of all imaged microvessels in Controls (as opposed to 13.7% in the Inhibitor group) were represented by collapsed microvessels. In summary, EM data demonstrate that miR-155 inhibition prevents microvascular injury in the peri-infarct area of stroke for up to 21 d after dMCAO. EM imaging supports our 2-photon microscopy data, demonstrating the maximal differences in microvascular integrity (between control and inhibitor-injected animals) 7 d after dMCAO. EM analysis was able to demonstrate a higher degree of vascular damage in the Control group 21 d after dMCAO. This can be explained by the differences between the approaches: 2-photon microscopy depicts the functional microvessels, whereas EM also enables the imaging of both functional and collapsed nonfunctional microvasculature.
Figure 3.
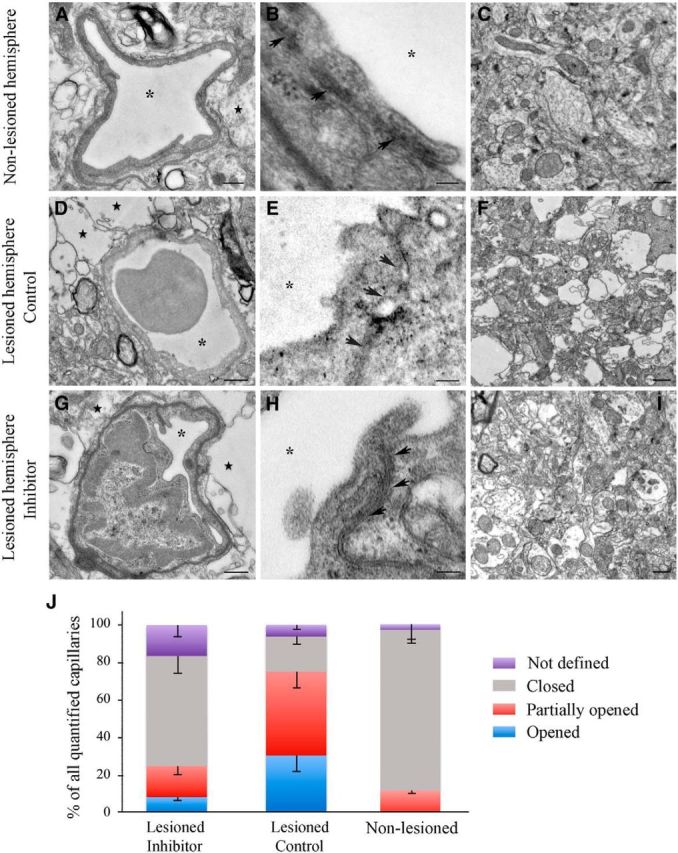
In vivo miR-155 inhibition supports endothelial TJ integrity. Shown are representative transmission EM images of capillaries and details of capillary TJs (arrows) from the nonlesioned hemispheres (A, B) and lesioned hemispheres of Control (D, E) and Inhibitor (G, H) animals 7 d after dMCAO. Asterisks indicate capillary lumen. Note the electron-dense dark intermediate areas of the intact TJ units in A, B, G, and H and disrupted TJs in D and E. Moderately swollen astrocytes (with characteristic glycogen granules) and heavily swollen astrocyte processes forming a large white perivascular space are marked with stars. Scale bars: A, C, D, F, G, I, 500 nm; B, E, H, 100 nm. J, Graph representing percentage (of all imaged microvessels) of capillaries with closed/intact (gray), partially opened (red), or opened/disrupted (blue) TJs in the nonlesioned and lesioned hemispheres of dMCAO mice groups. The percentage of reactive ECs forming lumen and very small capillaries with not yet defined TJs are shown in purple. n = 4 mice per group. Error bars indicate SEM.
Downregulation of miR-155 results in increased expression of TJ protein ZO1
The vasculature after dMCAO was also examined using confocal fluorescence microscopy. Figure 4A is a detailed image of a coronal brain section from the animal injected with FITC-conjugated dextran and paraformaldehyde mixture 5 min before death. It shows that, 7 d after dMCAO, there is a reduced number of functional vasculature within ∼600-μm-wide area medial to the infarct border (Fig. 4A), which is in agreement with previous studies (Li et al., 2008; Murphy et al., 2009). Immunofluorescence staining showed a significant reduction of NeuN (neuronal marker) expression in the infarct core (Fig. 4B). Few microvessels expressing blood vessel marker CD-31 (surrounded by NeuN-positive neurons) were seen in the peri-infarct area, and occasionally in the infarct core (Fig. 4C,D). To investigate the molecular basis of changes in TJ integrity associated with miR-155 inhibition, we performed immunofluorescence microscopy and WB analysis of the brains from the Control and Inhibitor groups collected 7 d after dMCAO. The expression patterns of the TJ proteins Occludin-1 and Claudin-5 in the microvessels captured in close vicinity to the infarct border were not visually different between the Inhibitor and Control animal groups. ZO-1 expression appeared to be more distinct in the Inhibitor group and less prominent in the Control group (Fig. 4E). To perform an accurate quantification, the expression levels of the major TJ proteins were analyzed by WB using the Inhibitor and Control samples collected 7 d after experimental ischemia. dMCAO resulted in significant depletion of ZO-1 protein in the lesioned hemisphere of Control samples. In the lesioned hemisphere of Inhibitor samples, ZO-1 expression was significantly (p = 0.002) higher compared with Controls. At the same time, ZO-1 expression in these samples was not significantly different from the nonlesioned hemisphere samples (Fig. 4F, ZO-1 is represented by two closely migrating >220 kDa bands). To explain the mechanism of ZO-1 regulation by miR-155, we checked for probable activation of signaling molecules mediating TJ barrier functions. The PI3K/Akt pathway plays an important role in the regulation of TJ assembly and integrity (González-Mariscal et al., 2008). At the same time, Akt signaling is activated by overexpressed miR-155 and downregulated after miR-155 inhibition (Yamanaka et al., 2009; Huang et al., 2012). In agreement with these previous studies, Akt phosphorylation levels (both at Thr308 and Ser473) were >3-fold lower in the Inhibitor samples compared with Controls (Fig. 4G). Total Akt protein expression was also decreased in the Inhibitor samples (Fig. 4H). To establish a connection among ZO-1 expression, Akt phosphorylation/expression levels, and miR-155 downregulation, we analyzed the levels of the direct miR-155 target protein Rheb (Wang et al., 2013). This small GTPase, with the highest expression in the brain and muscle, is implicated in the regulation of important cellular processes including cell cycle and growth. Recent studies showed that Rheb is essential for the development of the murine cardiovascular system and blood circulation (Aspuria et al., 2004; Goorden et al., 2011). As demonstrated in Figure 4H, Rheb expression was increased by ∼33% in the Inhibitor group. Therefore, higher levels of Rheb accompanied decreased Akt phosphorylation, which is in agreement with other studies demonstrating that Rheb suppresses Akt phosphorylation at both the Ser 473 and Thr308 sites (Cao et al., 2013). The expression of VE-cadherin, an adherence junction protein and a possible upstream regulator of ZO-1, was not different within the groups. The levels of RhoA protein, a direct target of miR-155 and an important regulator of TJ functions, was not significantly different throughout the analyzed samples (Fig. 4I), which means that ZO-1 stabilization was not mediated via the RhoA or VE-Cadherin signaling pathways. Therefore, we speculate that increased expression of ZO-1 could be mediated via a Rheb/Akt interaction: Rheb upregulated after miR-155 inhibition suppresses Akt activity and subsequently stabilizes ZO-1. ZO-1, a regulatory scaffolding TJ protein, interacts with other TJ proteins and mediates their association with the cytoskeleton (Harhaj et al., 2004; Balda et al., 2009). Therefore, we analyzed possible changes in the expression of other TJ proteins. Claudin-5 and Occludin-1 were also somewhat (but not consistently) increased in the anti-miR-155-injected animals (Fig. 4I). dMCAO resulted in a significant decrease of Occludin-1 expression in the lesioned hemispheres of the both experimental groups. In summary, our WB analysis revealed that, among all TJ proteins, ZO-1 was consistently affected by miR-155 inhibition. Stabilization of the major scaffolding and signaling protein ZO-1 could strengthen TJ barrier function in the inhibitor-injected animals.
Figure 4.
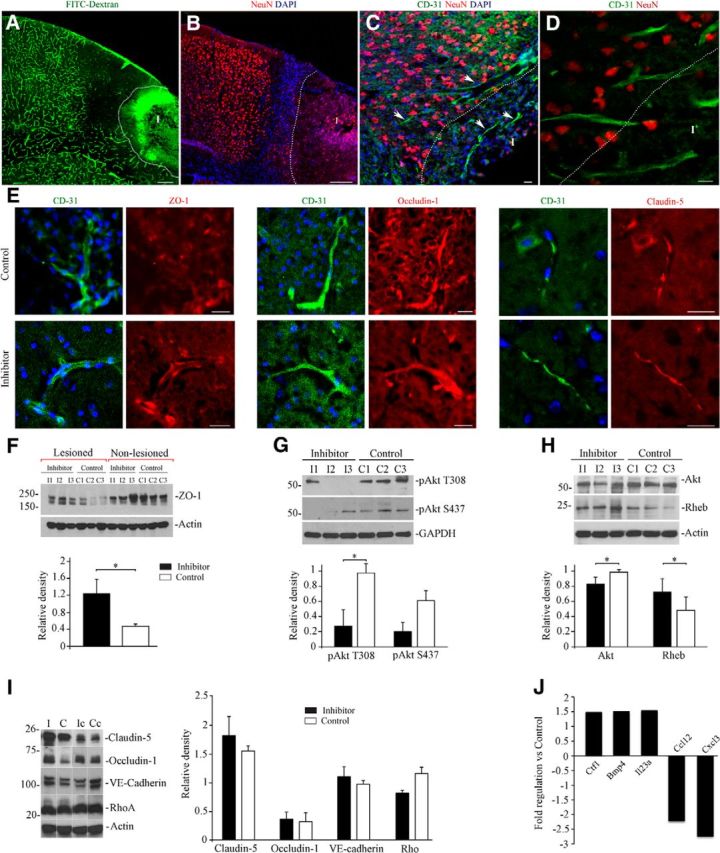
miR-155 inhibition results in stabilization of ZO-1 protein. A, Micrograph showing functional microvasculature in the peri-infarct area 7 d after dMCAO. Mouse was injected with fluorescent dextran/paraformaldehyde mixture, which allows a visualization of functional blood vessels on histological sections. Note the reduced vascular perfusion within the ∼600-μm-wide area medial to the infarct (I, outlined with white dotted line). B, Coronal section from the same animal immunostained with anti-NeuN antibody (red). Note the reduced NeuN intensity in the infarct area and dense nuclear staining (DAPI, blue) representing a glial scar. C and high magnification in D, Double immunostaining with anti-NeuN (red) and anti-CD-31 (green) demonstrates a spatial distribution of neurons and blood vessels (arrows) in the peri-infarct area 7 d after dMCAO. Infarct (I) is outlined with a dotted line. E, Double immunofluorescence staining of the brain coronal sections from the Inhibitor and Control animal groups 7 d after dMCAO. Micrographs demonstrate the localization and distribution of the TJ proteins ZO-1, Occludin-1, and Claudin-5 (red) in cerebral microvessels (detected with anti-CD-31, green) in close vicinity to the infarct border. Imaging was performed using a Zeiss LSM510-META confocal microscope with tile-scan and z-stack image acquisitions. Scale bars, A, B, 200 μm; C–E, 20 μm. F, WB analysis of ZO-1 expression in lysates prepared from the cortical tissue of the lesioned and nonlesioned hemispheres of Inhibitor and Control groups 7 d after dMCAO. Graph represents WB quantification analysis; optical density of each band was normalized to β-actin as a loading control. Results are presented as a ratio between ZO-1 expression in the lesioned compared with the corresponding nonlesioned hemispheres. G, WB analysis of Akt phosphorylation levels in the samples collected from the lesioned hemispheres of Inhibitor and Control mice (described in F) using rabbit monoclonal Phospho-Akt antibodies (Ser473 and Thr308). Graph represents WB quantification analysis; relative density represents protein expression normalized to GAPDH as a loading control. H, WB analysis of Akt and Rheb protein expression in the same samples (described in G). Relative density represents protein expression normalized to β-actin as a loading control. I, WB analysis of the expression of the major TJ proteins Claudin-5 and Occludin-1, the aherens junction protein VE cadherin, and the TJ regulator protein RhoA. The samples described for F were used for this analysis. Graph represents WB quantification analysis. Optical density of each band was normalized to β-actin as a loading control. Results are presented as a ratio of protein expression in the lesioned and corresponding nonlesioned hemispheres. For all WBs, error bars indicate SD; n = 3 mice per group. *p < 0.05, Student's t test. J, Cytokine/chemokine gene expression changes after miR-155 inhibition 7 d after dMCAO. Total RNA was obtained from cortical tissue of Inhibitor and Control mouse brains (hemispheres ipsilateral to the lesion) and subjected to mouse cytokine/chemokine PCR profiler array. The obtained raw data were analyzed using RT2 Profiler software. The graph demonstrates significant (≥1.5-fold change in expression, p < 0.05) upregulation of 3 and downregulation of 2 cytokines in Inhibitor mice compared with Controls. n = 3 animals per group.
In vivo miR-155 inhibition results in alterations in the cytokine/chemokine gene expression profile after dMCAO
Because miR-155 inhibition has been reported to reduce both inflammation and BBB leakage/breakdown, we hypothesized that the effect of anti-miR-155 injections on microvascular integrity could be also attributed to the reduced postischemic inflammation. The RNA samples were collected and analyzed 7 d after dMCAO (Fig. 4J). The expression of genes encoding proinflammatory and anti-inflammatory factors assessed with a specialized cytokine/chemokine PCR profiler array revealed a significant (≥1.5-fold; p < 0.05) upregulation of 3 and downregulation of 2 cytokine genes. The consistently upregulated genes were as follows: Ctf1, encoding cardiotrophin, shown to inhibit caspases and thus promote neuroprotection and repair in stroke (Sola et al., 2008; Peng et al., 2010); Bmp4, encoding bone morphogenetic protein, implicated in induction of tube formation and migration of human microvascular endothelial cells (Rothhammer et al., 2007); and the angiogenesis promoting cytokine gene Il23a (Langowski et al., 2006). It has been demonstrated that BMP signaling is negatively regulated by miR-155 (Yin et al., 2010), which explains the upregulation of the Bmp4 gene after miR-155 inhibition. Among the downregulated genes are: proinflammatory Ccl12, encoding monocyte chemotactic protein 5 (MCP-5), which is stimulated by in vitro hypoxia and implicated in mediation of inflammatory response after stroke (Mojsilovic-Petrovic et al., 2007), and proinflammatory Cxcl3 (Chemokine ligand 3). Interestingly, these two chemokines are linked directly to vascular inflammation, particularly to monocyte transmigration to the subendothelial space and monocyte adhesion to vascular endothelium, followed by development of atherosclerotic plaques (Gargalovic et al., 2006).
In vivo miR-155 inhibition results in the reduction of brain damage after dMCAO
Infarct size was evaluated using MRI at 24 h and 7, 14, and 21 d after dMCAO (Fig. 5A,B) to detect the extent of the brain damage within control animals (Fig. 5B, red) and inhibitor-injected animals (Fig. 5B, blue). dMCAO-induced injury size (% infarct volume) measured at 24 h after dMCAO allowed us to evaluate the initial damage in each animal. The average initial damage in both experimental groups was ∼13.5%. At 7 d, the average relative infarct size in the Inhibitor group was 13.8% versus 17.5% in the Control group. This is in agreement with our EM observations demonstrating less vacuolated and edematous tissue compared with control animals. At 14 d, the differences in percentage infarct sizes between the two groups were minimal: 12.3% in inhibitor-injected and 13.4% in control animals. The infarct sizes were significantly different (p < 0.05) at 21 d, when the relative infarct volume was 9.5% in the Inhibitor group versus 14.43% in the Control group (see multiline charts and representative MRI images in Fig. 5). Therefore, MRI data demonstrate that anti-miR-155 injections result in a 34% reduction of brain damage 21 d after dMCAO. In the same MRI sessions, tissue perfusion was measured using the noninvasive ASL method for quantification of cerebral blood flow. Perfusion maps were generated and blood flow in the analogous areas of the lesioned and intact hemispheres was calculated (Fig. 5C,D). Continuous changes of blood flow in the Control and Inhibitor groups were measured at 24 h and 7, 14, and 21 d after dMCAO. Although no statistically significant differences in blood perfusion were detected between the two experimental groups, the pattern of tissue perfusion changes was similar to microvasculature alterations showing the maximum changes 7 d after dMCAO. The ASL measurements, however, represent a combined flow in all blood vessels and thus could not fully reflect the changes in the capillary flow detected by 2-photon microscopy.
Figure 5.
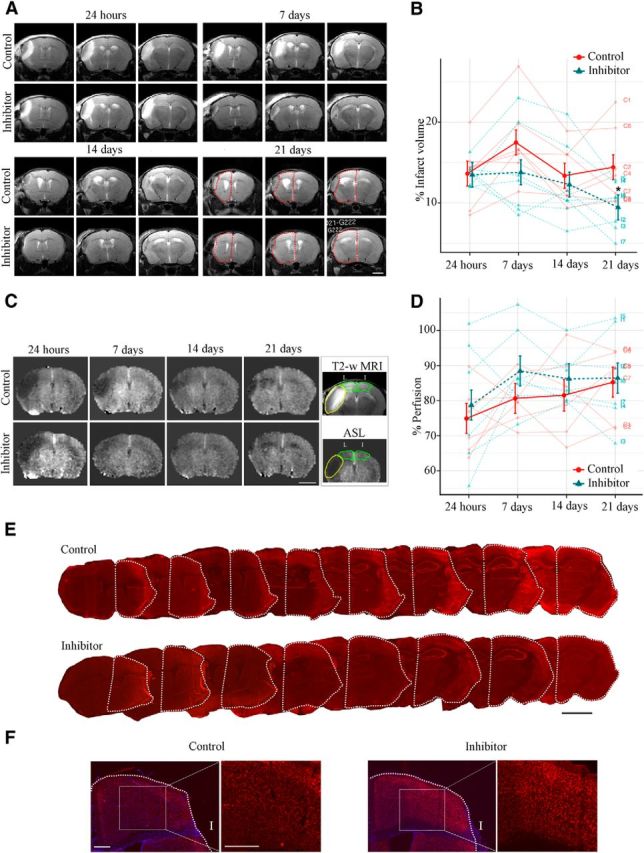
In vivo miR-155 inhibition results in reduction of infarct size after dMCAO: infarct volume measurements using MRI. A, T2-weighted MRI-based measurements of the infarct volume were performed 24 h (initial evaluation) and 7, 14, and 21 d after dMCAO (in the same animal). Representative MRI images (three sections per mouse from the Control and Inhibitor groups) demonstrate progression of the brain damage from vasogenic edema at 24 h after dMCAO to tissue resorption at 21 d. The remaining normal tissue in the lesioned hemisphere is outlined by a red dotted line. Note the visible differences in infarct sizes between Control and Inhibitor animals. Scale bar, 2 mm. B, Volumes of normal gray matter in the lesioned and nonlesioned control hemispheres were calculated and the infarction volume was expressed as a percentage of the volume of the gray matter in the control hemisphere. Multiline plot represents relative (%) infarct sizes by days comparing Control (red) and Inhibitor (blue) groups. Dark points indicate the mean with SEM error bars and light points indicate responses of individual animals. For statistical analysis, group comparisons were performed using mixed-model repeated-measures with Wald tests between groups, followed by Sidak's familywise error rate correction for multiple comparisons within each hypothesis (*p < 0.05). Error bars indicate SEM. n = 7 mice per group. C, Evaluation of tissue perfusion using the ASL method. Representative ASL perfusion maps generated in the same animal (from Control and Inhibitor groups) at 24 h and subsequently at 7, 14, and 21 d after dMCAO. Scale bar, 2.5 mm. Box, Cortical areas of interest from the lesioned (L) and intact (I) hemispheres were selected from the corresponding T-2 weighted MRI scans (top, outlined with green dotted line) and interpolated to perfusion maps (bottom); lesion is marked with yellow dotted line. D, Brain tissue perfusion (blood flow, ml/100 g × min) at 24 h and 7, 14, and 21 d after dMCAO (in the hemisphere ipsilateral to the lesion) was expressed as a percentage of that in the intact hemisphere and plotted on the multiline graph. The percentage perfusion by days comparing Control (red) and Inhibitor (blue) groups uses dark points to indicate the mean with SEM error bars and light points to indicate responses of individual animals. n = 7 mice per group. E, Representative histological images of the serial coronal brain sections immunostrained with the Cy-3-conjugated anti-NeuN antibody 21 d after dMCAO. The lesion volume was evaluated by assessing the size differences between the remaining lesioned (outlined by white dotted line) and nonlesioned contralateral hemispheres. At 21 d, tissue loss and the lesioned hemisphere shrinkage were visibly greater in Controls compared with the Inhibitor group. n = 6–7 animals per group, 10–15 brain sections per mouse. Error bars indicate SEM. Scale bar, 2.5 mm. F, Representative images of the NeuN immunoreactivity in the lesioned hemispheres of the Control and Inhibitor animal groups. Scale bars, 0.5 mm.
miR-155 inhibition prevents delayed neuronal damage after dMCAO
The brain tissue damage was additionally assessed after the completion of in vivo two-photon microscopy and/or MRI imaging (21 d after dMCAO). Figure 5E shows representative images of serial coronal brain sections from the Control and Inhibitor groups immunostained for the neuronal marker NeuN. The infarct size calculations (see Materials and Methods) revealed that the relative infarction volume was significantly (p = 0.008) greater in the Control group (20.4%) compared with Inhibitor group (14.3%). Despite the considerable deformation of the brain tissue after fixation, freezing, and slicing procedures, the results were still in agreement with the in vivo MRI measurements showing ∼30% reduction of the relative infarct volume in miR-155 inhibitor-injected mice. Immunohistochemistry revealed a visibly higher number of NeuN-positive neurons in the lesioned hemispheres of the Inhibitor group (Fig. 5F). Because NeuN immunoreactivity does not accurately reflect the degree of neuronal damage, we used EM to assess the ultrastructure of neurons in the peri-infarct area of stroke. As mentioned in section on the EM analysis of blood vessels, no considerable neuronal damage was observed in the samples collected 7 d after dMCAO. At 21 d, however, visibly significant tissue damage and neuronal death were seen in the peri-infarct area of the Control group (Fig. 6A–C). In contrast, in the inhibitor-injected mice, the neurons and surrounding brain tissue had a healthy or slightly damaged appearance (Fig. 6D–F). Analysis revealed that, in the lesioned hemisphere of the Inhibitor group, the average number of normal/slightly damaged neurons (78% of all imaged neurons) and damaged neurons (22%) was similar to the nonlesioned hemisphere (Fig. 6G). In the Control group, the percentage of significantly damaged neurons was as high as 68%; >9% consisted of necrotic neurons (Fig. 6C,G). Therefore, the numbers of undamaged and damaged neurons in the lesioned hemispheres were significantly (p = 0.001 and p = 0.003, respectively) different between the Inhibitor and Control groups. Importantly, no neuronal necrosis was observed in the Inhibitor group. Interestingly, considerable numbers of injured (65%) and dead/necrotic (4%) neurons were seen in the nonlesioned hemisphere of the Control group. Based on the EM analysis, we conclude that miR-155 inhibition prevents the delayed neuronal death after stroke. These data are in agreement with the MRI measurements demonstrating a significant reduction of brain tissue damage in the Inhibitor group 21 d after dMCAO.
Figure 6.

miR-155 inhibition prevents delayed neuronal damage after dMCAO. Representative transmission EM images of the brain tissue and neurons from the lesioned hemispheres of Control (A–C) and Inhibitor (E, F) groups 21 d after dMCAO. Note the overall appearance of the damaged and vacuolated brain tissue, multiple dead neurons, and collapsed capillary in the Control group (A) and healthy looking tissue and neurons and normal capillaries in the Inhibitor group (D). Arrows, Normal looking neuron; arrowheads, dead/necrotic neuron; star, damaged neuron. V, Vacuoles; BV, blood vessels. B, Control group. Shown is a high-magnification image of damaged disintegrating neuron with multiple intracellular vacuoles, irregular-shaped nucleus and nucleoli, mitochondrial swelling and vacuolization, and condensed chromatin. C, Control group. Necrotic neuron. E, F, Inhibitor group. Shown are high-magnification images of normal looking (E) and slightly damaged (F) neurons. Scale bars: A, D, 10 μm, direct magnification 800×; B, C, E, F, 2 μm, direct magnification 2500×. G, Graph representing the percentage (of all imaged neurons per hemisphere) of normal looking/healthy (gray), damaged (red), and necrotic (blue) neurons. n = 3 animals per group. Error bars indicate SEM.
Functional recovery assessment
The assessment of sensorimotor deficits and their subsequent recovery was performed in parallel with the in vivo imaging experiments and compared between the control and anti-miR-injected dMCAO mice, as well as in sham-operated and intact animals.
Bilateral asymmetry/adhesive removal test
Sensitivity to simultaneous forelimb stimulation was measured by means of a test similar to contralateral neglect testing in human. Among other impairment tests, the adhesive removal test was shown to be the most effective in assessment of behavioral impairments for 3 weeks after dMCAO (Bouet et al., 2009; Freret et al., 2009). The graphs in Figure 7 show the animals' performance (times of contact, Fig 7A, and removal, Fig 7B, of the adhesive tape with the contralesional paw) at different time points after surgery.
Figure 7.
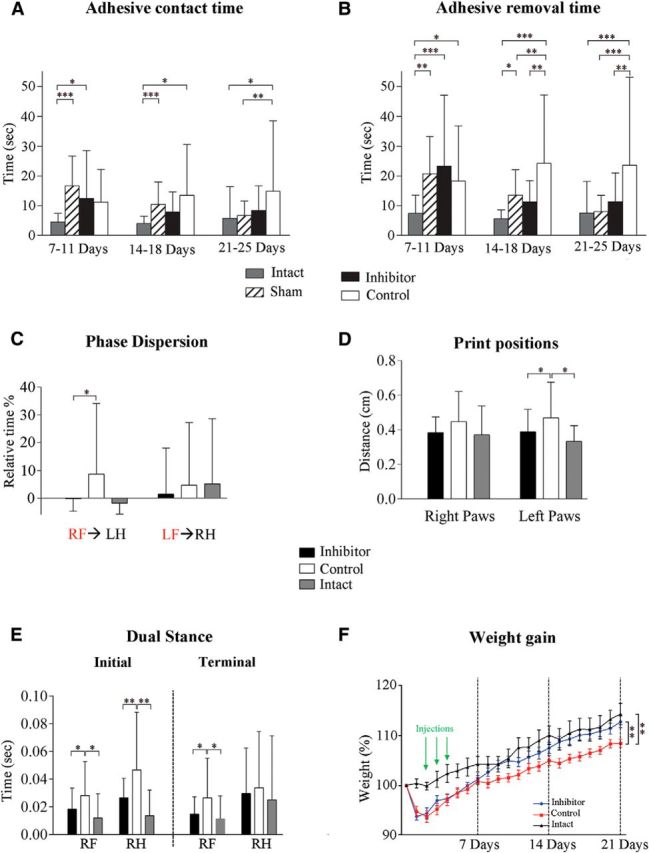
Functional recovery assessment. A, B, Bilateral asymmetry/adhesive removal test. Two parameters were monitored daily for each paw: adhesive tape contact time (A) and adhesive removal time (B). Performances of the 3 final days of each week were averaged as a block. Parameters for the contralesional (affected by the unilateral brain lesion) paw are plotted on the graph. C–E, Gait/locomotion analysis using the CatWalk test. Graphs demonstrate phase dispersion (C), print position (D), and the initial and terminal dual stance (E) parameters. Animals were tested once a week for 21 d. RF, Right front; RH, right hind; LF, left front; LH, left hind. Red indicates “anchor” paws. F, Animal weight gain after dMCAO. The body weight of each animal was monitored daily starting at day 0 (before dMCAO surgery) for 21 d after dMCAO. Data are shown as a percentage, demonstrating the weight of each animal per day relative to its weight at day 0 (the weight recorded before dMCAO surgery). n = 11–12 mice per experimental group. Error bars indicate SD. *p < 0.05, **p < 0.01, ***p < 0.001, one-way ANOVA followed by Sidak's multiple-comparisons test.
Adhesive contact time.
Adhesive contact time was not statistically different between the Inhibitor and Control groups. However, in the last testing block (21–25 d after dMCAO), only the mice from the Control group retained significantly longer contact time compared with the Intact and Sham groups (Fig. 7A).
Adhesive removal time.
As expected, in the first testing block (7–11 d after dMCAO), the time to remove the adhesive tape was significantly longer in the Sham, Inhibitor, and Control groups compared with the Intact group. In the second block (14–18 d after dMCAO), significant differences became apparent between the Inhibitor and Control groups. In addition, the removal time was significantly greater in Controls compared with both the Intact and Sham groups. In the final testing block (21–25 d after dMCAO), the Intact, Sham, and Inhibitor groups demonstrated almost full recovery in adhesive removal function, whereas the Controls had significantly impaired performance compared with all other groups (Fig. 7B). A multiple regression was fit to assess the relationship between the adhesive removal time [log10(Time)] with infarct size between groups at weekly intervals. A positive relationship was detected at 14 and 21 d (one-sided slope p values = 0.034 and 0.021, respectively, at an uncorrected 0.05 significance level), which means that the reduced infarct size in the Inhibitor group correlated with the improvement of the sensorimotor deficits.
Gait analysis with CatWalk test
Gait changes are considered to be reliable indicators of stroke severity by providing information on limb coordination and compensatory movements due to stroke-induced deficits in sensorimotor function (Wang et al., 2008). The experimental groups were tested 7, 14, and 21 d after dMCAO. The automated comparative paw and interlimb coordination statistics identified several parameters recorded for the left and the right (contralesional) paws, which reflected considerable differences between two experimental groups 21 d after dMCAO. Significant differences between the Inhibitor and Control groups were detected in so-called “phase dispersion” (time between the placement of two paws within a step cycle) and “print position” (distance between the front and hindpaws within a step cycle) parameters (Fig. 7C,D). The increased values of the phase dispersion parameter after ischemic stroke have been reported previously (Wang et al., 2008; Balkaya et al., 2013). Importantly, the calculated values for phase dispersion (for the contralesional right paw) in the Inhibitor group were similar to the Intact group but significantly different from the Control group (Fig. 7C). Significant differences between the Inhibitor and Control groups seen in the print position for the left paw (Fig. 7D) could reflect a distinctive compensation for the abnormal contralesional limb movements. This is agreement with other studies reporting abnormal paw placement in ischemic animals, which intensified and affected both the left and right paws (Wang et al., 2008). In addition, significant differences between the Inhibitor and Control groups were detected in the “dual stance phase,” representing the duration of contact for both paws with the walking surface (Fig. 7E, Table 1). Both initial and terminal dual stance durations of the contralesional right paw were similar between the Inhibitor and Intact groups, yet significantly different from the Controls (Fig. 7E). As a component of walking velocity, this parameter is relevant for stroke recovery; duration of dual stance parameter is significantly increased in the rodent hemorrhagic stroke model (Liu et al., 2013). The functional recovery assessment data indicate that the inhibitor-injected animals regained their sensorimotor deficits faster than controls.
Table 1.
Description of the gait/locomotion analysis using CatWalk test parameters
| Parameter | Definition | Paw | Mean ± SD inhibitor | Mean ± SD control | p value summary |
|---|---|---|---|---|---|
| Dual stance (s) | Duration of ground contact for both paws simultaneously | ||||
| Initial dual stance (s) | The first time period in a step cycle in which a paw makes contact with the walking surface at the same time as the contralateral paw | RF | 0.018 ± 0.015 | 0.028 ± 0.024 | * |
| RH | 0.026 ± 0.014 | 0.047 ± 0.041 | ** | ||
| Terminal dual stance (s) | The second time period in a step cycle in which the paw makes contact with the walking surface at the same time as the contralateral paw | RF | 0.015 ± 0.012 | 0.026 ± 0.028 | * |
| RH | 0.030 ± 0.032 | 0.034 ± 0.040 | |||
| Print positions (cm) | Distance between the position of the hind paw and the position of the previously placed front paw, on the same side of the body, and in the same step | Right paws | 0.383 ± 0.088 | 0.446 ± 0.172 | |
| Left paws | 0.388 ± 0.128 | 0.468 ± 0.204 | * | ||
| Phase dispersion (%) | Temporal relationship between placements of two paws within a step cycle; phase dispersion depends on the initial contact of one paw (target paw) to the stride cycle of another paw (anchor paw) | RF→LH | −0.224 ± 4.440 | 8.693 ± 25.132 | * |
| LF→RH | 1.437 ± 16.326 | 4.658 ± 22.297 |
Data represent the gait parameters recorded for the right (contralesional) paw in the Inhibitor and Control groups 21 d after dMCAO.
RF, Right front; RH, right hind; LF, left front; LH, left hind.
*p < 0.05,
**p < 0.01, one-way ANOVA followed by Sidak's multiple-comparisons test.
Weight gain assessment
Weight gain is considered as one of the characteristics of poststroke recovery (Cheng et al., 2014; Park et al., 2014). Continuous weight monitoring of dMCAO animals revealed a characteristic weight drop during first 2 d after surgery, followed by the weight gain for subsequent 21 d. Importantly, the Inhibitor group gained the weight faster and reached the weight of the Intact group by 21 d after dMCAO. The average relative weight (normalized to the weight recorded on day 0 before surgery) of control animals at 21 d was significantly lower compared with both the Inhibitor and the Intact groups (Fig. 7F). Therefore, behavioral assessment and weight gain data show a good correlation between functional improvement and decreased infarct size in the anti-miR-155-injected animal group.
In summary, based on our results, we conclude that downregulation of miR-155 strengthens the barrier function of capillary TJs, resulting in decreased vasogenic edema by the first week after the experimental stroke induction. This initial effect stabilizes cerebral vasculature and restores the blood flow in the peri-infarct area of stroke. Both decreased edema and restored circulation have a neuroprotective outcome, preventing delayed neuronal death and brain tissue necrosis 21 d after dMCAO; in turn, preservation of the peri-infarct area in the inhibitor-injected animals is reflected in the improved functional recovery.
Discussion
It has been shown that postischemic vascular remodeling and poststroke neuroregeneration (including activation of endogenous stem cells) reach maximum activity at 7–14 d and continue for >21 d after experimental cerebral ischemia (Beck et al., 2000; Ding et al., 2008; Zhang et al., 2009). Based on these studies, we determined the time points for the intervention and evaluation of both early postacute and long-lasting changes in the cerebral microvasculature, brain damage, and overall animal recovery. Based on our knowledge of the anti-inflammatory, anti-tumorigenic, and anti-atherosclerotic effects of miR-155 inhibition (Faraoni et al., 2009; O'Connell et al., 2010), we predicted that the short-term, moderate systemic downregulation of miR-155 achieved in our experiments could have an overall positive result and would not induce secondary nonspecific off-target effects or negative side effects such as impairment of immune function. Predicted beneficial effects on poststroke recovery were clearly verified by our evaluation of cerebral vasculature, infarct size, neuronal damage, and functional recovery. We propose that vascular support achieved by miR-155 inhibition at the early subacute stage of the experimental stroke played a critical role in prevention of delayed neuronal loss in the peri-infarct area.
Increased microvascular blood flow velocity, higher (similar to the nonlesioned hemisphere) density of the functional capillaries, and decreased vascular leakage (and thus more efficient blood supply to the brain tissue) detected in the inhibitor-injected animals could be mainly attributed to miR-155 inhibition-induced preservation of TJ and BBB integrity. Based on our EM studies showing the increased number of very small probably newly formed vasculature, we can only speculate that miR-155 inhibition could also promote the angiogenesis and/or vasculogenesis processes. Therefore, a separate, detailed investigation will be performed to obtain the definitive answer to this question.
Effect of miR-155 on TJ integrity has been mainly associated with its direct targets: the TJ protein Claudin-1 and a regulator of TJ organization, RhoA. However, expression of Claudin-1 (both the mRNA and the protein) is extremely low and has no functional importance in mouse cerebral vasculature (Ohtsuki et al., 2008; Pfeiffer et al., 2011). Neither PCR nor WB analysis performed in our studies showed any effect of miR-155 inhibition on Claudin-1 and Rho mRNA and protein expressions. Based on our data, preservation of TJs in Inhibitor animals could be mediated by miR-155 inhibition-induced stabilization of ZO-1, a regulatory scaffolding TJ protein critical for the TJ assembly and signal transduction in the ECs (Harhaj, Antonetti, 2004; Balda, Matter, 2009). A negative regulation of ZO-1 expression by miR-155 has been demonstrated previously (Tian et al., 2013); however, its exact mechanism is unclear. Based on our analysis, we speculate that ZO-1 stability is mediated via a decrease of Akt activity and induced by miR-155 downregulation, which was also demonstrated by others (Yamanaka et al., 2009; Huang et al., 2012). Our results indicate that Akt phosphorylation could be induced by the upregulation of a direct miR-155 target protein, Rheb, which can supress Akt phosphorylation via an S6K-insulin receptor substrate protein–Akt feedback loop (Di et al., 2012; Cao et al., 2013). Therefore, miR-155 inhibition-induced stabilization of ZO-1 could be mediated via Rheb/Akt interaction. Interestingly, miR-155 is also a repressor of miR-143, which in turn is a negative regulator of Akt activity (Jordan et al., 2011; Jiang et al., 2012). Although reduced Akt phosphorylation in the Inhibitor samples could be explained by Rheb upregulation or inter-miRNA interactions, the decrease in Akt protein expression remains elusive. Identification of new miR-155 target proteins and miRNAs in the future could clarify this effect.
In addition to Rheb, several other direct miR-155 targets upregulated in the inhibitor-injected mouse brain could significantly affect TJ integrity. Specifically, SMAD5 is implicated in the regulation of TJs: its inhibition results in disassembly of the apical junctional complex (Allaire et al., 2011). eNOS and NO were shown to support microvascular integrity and prevent microvascular dysfunction caused by an increased leukocyte/endothelilal adhesion (Kubes et al., 1992; Predescu et al., 2005). Literature reports and our own in vivo investigation suggest that, in addition to the specific effect on endothelial TJs, miR-155 inhibition after stroke could broadly influence vascular function and brain tissue remodeling. Possible mechanisms and consequences of this influence are summarized in Figure 8. Our studies revealed that a number of important signaling molecules were upregulated and downregulated in the lesioned hemisphere of miR-155 inhibitor-injected animals. These molecules are implicated in the regulation of angiogenesis, vascular stabilization, and remodeling, as well as vasodilation, neurovascular inflammation, and neuroprotection; therefore, they could significantly contribute to the observed beneficial neurovascular effect of miR-155 inhibition (Fig. 8). Elevated expression of SMAD5 protein, as well as upregulation of the Bmp4 gene, may be associated with activation of the BMP pathway, which is implicated in reduction of inflammation and vasculture stabilization (Marchuk et al., 2003; Pardali et al., 2010). Increased expression of Rictor, a major component of the mTORC2 complex, could activate mTOR signaling, which is implicated in supporting angiogenesis (through activation of NO signaling) and neuroprotection after stroke (Karar et al., 2011; Chong et al., 2013). Interestingly, our previous in vitro experiments showed that inhibition of miR-155 in the endothelial cells also resulted in alterations of mTOR and TGFβ signaling (Roitbak et al., 2011). NOS is associated with the improvement of blood flow and decreased rates of neuronal injury (Srivastava et al., 2012). Neuroprotective and overall proregenerative effect of miR-155 inhibition may also be expected, given its positive influence on BDNF (brain-derived neurotrophic factor) expression (Varendi et al., 2014). Because miR-155 is mainly restricted to hematopoietic cells and cells involved in vascular remodeling, we believe that the changes in gene and protein expression detected in our study reflect the effect of miR-155 inhibition on cerebral vasculature. The cytokine/chemokine alterations detected in the Inhibitor group demonstrate that inhibition of miR-155 could regulate poststroke inflammation processes. A detailed study on the effect of miR-155 inhibition on both early and chronic poststroke inflammation will be the subject of our future studies.
Figure 8.

Possible molecular mechanisms of miR-155 inhibition-mediated support of poststroke recovery. Downregulation of miR-155 strengthens the barrier function of microvascular TJs, resulting in stabilization of BBB integrity, reduction of brain edema, and restoration of blood flow in the peri-infarct area of stroke. These effects promote neuroprotection and prevent delayed neuronal death. Preservation of the peri-infarct area is reflected in improved functional recovery in Inhibitor animals. Possible molecular mechanisms mediating these processes could be associated with the increased (red) or decreased (blue) expression of molecules directly regulated by miR-155.
In summary, our investigation revealed that in vivo regulation of miR-155 positively influences overall postischemic recovery. This approach could be explored further as a potential treatment for stroke.
Footnotes
This work was supported by the National Institute of Neurological Disorders and Stroke–National Institutes of Health (Grants R21NS064185 and R01NS082225) and by a University of New Mexico (UNM) Behavioral Health BBI/CoBRE Research Award. We thank Gavin Picket and Jamie Padilla from the UNM KUGR (Keck-UNM Genomics Resource) Affymetrix Facility for their help in miRNA analysis and Zurab Surviladze for sharing his expertise in cell signaling pathways. Transmission electron microscopy imaging was performed in the UNM Health Science Center Electron Microscopy Facility. Confocal images were generated in the UNM Cancer Center Fluorescence Microscopy Facility.
The authors declare no competing financial interests.
References
- Allaire JM, Darsigny M, Marcoux SS, Roy SA, Schmouth JF, Umans L, Zwijsen A, Boudreau F, Perreault N. Loss of Smad5 leads to the disassembly of the apical junctional complex and increased susceptibility to experimental colitis. Am J Physiol Gastrointest Liver Physiol. 2011;300:G586–G597. doi: 10.1152/ajpgi.00041.2010. [DOI] [PubMed] [Google Scholar]
- Aspuria PJ, Tamanoi F. The Rheb family of GTP-binding proteins. Cell Signal. 2004;16:1105–1112. doi: 10.1016/j.cellsig.2004.03.019. [DOI] [PubMed] [Google Scholar]
- Balda MS, Matter K. Tight junctions and the regulation of gene expression. Biochim Biophys Acta. 2009;1788:761–767. doi: 10.1016/j.bbamem.2008.11.024. [DOI] [PubMed] [Google Scholar]
- Balkaya M, Kröber J, Gertz K, Peruzzaro S, Endres M. Characterization of long-term functional outcome in a murine model of mild brain ischemia. J Neurosci Methods. 2013;213:179–187. doi: 10.1016/j.jneumeth.2012.12.021. [DOI] [PubMed] [Google Scholar]
- Beck H, Plate KH. Angiogenesis after cerebral ischemia. Acta Neuropathol. 2009;117:481–496. doi: 10.1007/s00401-009-0483-6. [DOI] [PubMed] [Google Scholar]
- Beck H, Acker T, Wiessner C, Allegrini PR, Plate KH. Expression of angiopoietin-1, angiopoietin-2, and tie receptors after middle cerebral artery occlusion in the rat. Am J Pathol. 2000;157:1473–1483. doi: 10.1016/S0002-9440(10)64786-4. [DOI] [PMC free article] [PubMed] [Google Scholar]
- Bouet V, Boulouard M, Toutain J, Divoux D, Bernaudin M, Schumann-Bard P, Freret T. The adhesive removal test: a sensitive method to assess sensorimotor deficits in mice. Nat Protoc. 2009;4:1560–1564. doi: 10.1038/nprot.2009.125. [DOI] [PubMed] [Google Scholar]
- Bragin DE, Bush RC, Müller WS, Nemoto EM. High intracranial pressure effects on cerebral cortical microvascular flow in rats. J Neurotrauma. 2011;28:775–785. doi: 10.1089/neu.2010.1692. [DOI] [PMC free article] [PubMed] [Google Scholar]
- Bragin DE, Bush RC, Nemoto EM. Effect of cerebral perfusion pressure on cerebral cortical microvascular shunting at high intracranial pressure in rats. Stroke. 2013;44:177–181. doi: 10.1161/STROKEAHA.112.668293. [DOI] [PMC free article] [PubMed] [Google Scholar]
- Brouns R, De Deyn PP. The complexity of neurobiological processes in acute ischemic stroke. Clin Neurol Neurosurg. 2009;111:483–495. doi: 10.1016/j.clineuro.2009.04.001. [DOI] [PubMed] [Google Scholar]
- Cao Y, Tao L, Shen S, Xiao J, Wu H, Li B, Wu X, Luo W, Xiao Q, Hu X, Liu H, Nie J, Lu S, Yuan B, Han Z, Xiao B, Yang Z, Li X. Cardiac ablation of Rheb1 induces impaired heart growth, endoplasmic reticulum-associated apoptosis and heart failure in infant mice. Int J Mol Sci. 2013;14:24380–24398. doi: 10.3390/ijms141224380. [DOI] [PMC free article] [PubMed] [Google Scholar]
- Carmichael ST. Gene expression changes after focal stroke, traumatic brain and spinal cord injuries. Curr Opin Neurol. 2003;16:699–704. doi: 10.1097/00019052-200312000-00009. [DOI] [PubMed] [Google Scholar]
- Carmichael ST. Rodent models of focal stroke: size, mechanism, and purpose. NeuroRx. 2005;2:396–409. doi: 10.1602/neurorx.2.3.396. [DOI] [PMC free article] [PubMed] [Google Scholar]
- Castejón OJ. Ultrastructural pathology of endothelial tight junctions in human brain oedema. Folia Neuropathol. 2012;50:118–129. [PubMed] [Google Scholar]
- Chen J, Venkat P, Zacharek A, Chopp M. Neurorestorative therapy for stroke. Front Hum Neurosci. 2014;8:382. doi: 10.3389/fnhum.2014.00382. [DOI] [PMC free article] [PubMed] [Google Scholar]
- Cheng MY, Wang EH, Woodson WJ, Wang S, Sun G, Lee AG, Arac A, Fenno LE, Deisseroth K, Steinberg GK. Optogenetic neuronal stimulation promotes functional recovery after stroke. Proc Natl Acad Sci U S A. 2014;111:12913–12918. doi: 10.1073/pnas.1404109111. [DOI] [PMC free article] [PubMed] [Google Scholar]
- Chong ZZ, Yao Q, Li HH. The rationale of targeting mammalian target of rapamycin for ischemic stroke. Cell Signal. 2013;25:1598–1607. doi: 10.1016/j.cellsig.2013.03.017. [DOI] [PubMed] [Google Scholar]
- Costa A, Afonso J, Osório C, Gomes AL, Caiado F, Valente J, Aguiar SI, Pinto F, Ramirez M, Dias S. miR-363–5p regulates endothelial cell properties and their communication with hematopoietic precursor cells. J Hematol Oncol. 2013;6:87. doi: 10.1186/1756-8722-6-87. [DOI] [PMC free article] [PubMed] [Google Scholar]
- del Zoppo GJ, Mabuchi T. Cerebral microvessel responses to focal ischemia. J Cereb Blood Flow Metab. 2003;23:879–894. doi: 10.1097/01.WCB.0000078322.96027.78. [DOI] [PubMed] [Google Scholar]
- Di R, Wu X, Chang Z, Zhao X, Feng Q, Lu S, Luan Q, Hemmings BA, Li X, Yang Z. S6K inhibition renders cardiac protection against myocardial infarction through PDK1 phosphorylation of Akt. Biochem J. 2012;441:199–207. doi: 10.1042/BJ20110033. [DOI] [PubMed] [Google Scholar]
- Ding G, Jiang Q, Li L, Zhang L, Zhang ZG, Ledbetter KA, Panda S, Davarani SP, Athiraman H, Li Q, Ewing JR, Chopp M. Magnetic resonance imaging investigation of axonal remodeling and angiogenesis after embolic stroke in sildenafil-treated rats. J Cereb Blood Flow Metab. 2008;28:1440–1448. doi: 10.1038/jcbfm.2008.33. [DOI] [PMC free article] [PubMed] [Google Scholar]
- Egawa G, Nakamizo S, Natsuaki Y, Doi H, Miyachi Y, Kabashima K. Intravital analysis of vascular permeability in mice using two-photon microscopy. Sci Rep. 2013;3:1932. doi: 10.1038/srep01932. [DOI] [PMC free article] [PubMed] [Google Scholar]
- Fabian MR, Sonenberg N, Filipowicz W. Regulation of mRNA translation and stability by microRNAs. Annu Rev Biochem. 2010;79:351–379. doi: 10.1146/annurev-biochem-060308-103103. [DOI] [PubMed] [Google Scholar]
- Faraoni I, Antonetti FR, Cardone J, Bonmassar E. miR-155 gene: a typical multifunctional microRNA. Biochim Biophys Acta. 2009;1792:497–505. doi: 10.1016/j.bbadis.2009.02.013. [DOI] [PubMed] [Google Scholar]
- Freret T, Bouet V, Leconte C, Roussel S, Chazalviel L, Divoux D, Schumann-Bard P, Boulouard M. Behavioral deficits after distal focal cerebral ischemia in mice: Usefulness of adhesive removal test. Behav Neurosci. 2009;123:224–230. doi: 10.1037/a0014157. [DOI] [PubMed] [Google Scholar]
- Gargalovic PS, Gharavi NM, Clark MJ, Pagnon J, Yang WP, He A, Truong A, Baruch-Oren T, Berliner JA, Kirchgessner TG, Lusis AJ. The unfolded protein response is an important regulator of inflammatory genes in endothelial cells. Arterioscler Thromb Vasc Biol. 2006;26:2490–2496. doi: 10.1161/01.ATV.0000242903.41158.a1. [DOI] [PubMed] [Google Scholar]
- González-Mariscal L, Tapia R, Chamorro D. Crosstalk of tight junction components with signaling pathways. Biochim Biophys Acta. 2008;1778:729–756. doi: 10.1016/j.bbamem.2007.08.018. [DOI] [PubMed] [Google Scholar]
- Goorden SM, Hoogeveen-Westerveld M, Cheng C, van Woerden GM, Mozaffari M, Post L, Duckers HJ, Nellist M, Elgersma Y. Rheb Is essential for murine development. Mol Cell Biol. 2011;31:1672–1678. doi: 10.1128/MCB.00985-10. [DOI] [PMC free article] [PubMed] [Google Scholar]
- Harhaj NS, Antonetti DA. Regulation of tight junctions and loss of barrier function in pathophysiology. Int J Biochem Cell Biol. 2004;36:1206–1237. doi: 10.1016/j.biocel.2003.08.007. [DOI] [PubMed] [Google Scholar]
- Hauck EF, Apostel S, Hoffmann JF, Heimann A, Kempski O. Capillary flow and diameter changes during reperfusion after global cerebral ischemia studied by intravital video microscopy. J Cereb Blood Flow Metab. 2004;24:383–391. doi: 10.1097/00004647-200404000-00003. [DOI] [PubMed] [Google Scholar]
- Huang X, Le QT, Giaccia AJ. MiR-210: micromanager of the hypoxia pathway. Trends Mol Med. 2010;16:230–237. doi: 10.1016/j.molmed.2010.03.004. [DOI] [PMC free article] [PubMed] [Google Scholar]
- Huang X, Shen Y, Liu M, Bi C, Jiang C, Iqbal J, McKeithan TW, Chan WC, Ding SJ, Fu K. Quantitative proteomics reveals that miR-155 regulates the PI3K-AKT pathway in diffuse large B-cell lymphoma. Am J Pathol. 2012;181:26–33. doi: 10.1016/j.ajpath.2012.03.013. [DOI] [PMC free article] [PubMed] [Google Scholar]
- Hudetz AG, Fehér G, Weigle CG, Knuese DE, Kampine JP. Video microscopy of cerebrocortical capillary flow: response to hypotension and intracranial hypertension. Am J Physiol. 1995;268:H2202–H2210. doi: 10.1152/ajpheart.1995.268.6.H2202. [DOI] [PubMed] [Google Scholar]
- Jiang S, Zhang LF, Zhang HW, Hu S, Lu MH, Liang S, Li B, Li Y, Li D, Wang ED, Liu MF. A novel miR-155/miR-143 cascade controls glycolysis by regulating hexokinase 2 in breast cancer cells. EMBO J. 2012;31:1985–1998. doi: 10.1038/emboj.2012.45. [DOI] [PMC free article] [PubMed] [Google Scholar]
- Jones PB, Shin HK, Boas DA, Hyman BT, Moskowitz MA, Ayata C, Dunn AK. Simultaneous multispectral reflectance imaging and laser speckle flowmetry of cerebral blood flow and oxygen metabolism in focal cerebral ischemia. J Biomed Opt. 2008;13 doi: 10.1117/1.2950312. 044007. [DOI] [PMC free article] [PubMed] [Google Scholar]
- Jordan SD, Krüger M, Willmes DM, Redemann N, Wunderlich FT, Brönneke HS, Merkwirth C, Kashkar H, Olkkonen VM, Böttger T, Braun T, Seibler J, Brüning JC. Obesity-induced overexpression of miRNA-143 inhibits insulin-stimulated AKT activation and impairs glucose metabolism. Nat Cell Biol. 2011;13:434–446. doi: 10.1038/ncb2211. [DOI] [PubMed] [Google Scholar]
- Karar J, Maity A. PI3K/AKT/mTOR pathway in angiogenesis. Front Mol Neurosci. 2011;4:51. doi: 10.3389/fnmol.2011.00051. [DOI] [PMC free article] [PubMed] [Google Scholar]
- Kato M, Slack FJ. microRNAs: small molecules with big roles, C. elegans to human cancer. Biol Cell. 2008;100:71–81. doi: 10.1042/BC20070078. [DOI] [PubMed] [Google Scholar]
- Kim SG. Quantification of relative cerebral blood flow change by flow-sensitive alternating inversion recovery (FAIR) technique: application to functional mapping. Magn Reson Med. 1995;34:293–301. doi: 10.1002/mrm.1910340303. [DOI] [PubMed] [Google Scholar]
- Kleinfeld D, Mitra PP, Helmchen F, Denk W. Fluctuations and stimulus-induced changes in blood flow observed in individual capillaries in layers 2 through 4 of rat neocortex. Proc Natl Acad Sci U S A. 1998;95:15741–15746. doi: 10.1073/pnas.95.26.15741. [DOI] [PMC free article] [PubMed] [Google Scholar]
- Kubes P, Granger DN. Nitric oxide modulates microvascular permeability. Am J Physiol. 1992;262:H611–H615. doi: 10.1152/ajpheart.1992.262.2.H611. [DOI] [PubMed] [Google Scholar]
- Kuraoka M, Furuta T, Matsuwaki T, Omatsu T, Ishii Y, Kyuwa S, Yoshikawa Y. Direct experimental occlusion of the distal middle cerebral artery induces high reproducibility of brain ischemia in mice. Exp Anim. 2009;58:19–29. doi: 10.1538/expanim.58.19. [DOI] [PubMed] [Google Scholar]
- Kurowska-Stolarska M, Alivernini S, Ballantine LE, Asquith DL, Millar NL, Gilchrist DS, Reilly J, Ierna M, Fraser AR, Stolarski B, McSharry C, Hueber AJ, Baxter D, Hunter J, Gay S, Liew FY, McInnes IB. MicroRNA-155 as a proinflammatory regulator in clinical and experimental arthritis. Proc Natl Acad Sci U S A. 2011;108:11193–11198. doi: 10.1073/pnas.1019536108. [DOI] [PMC free article] [PubMed] [Google Scholar]
- Laitinen L. Griffonia simplicifolia lectins bind specifically to endothelial cells and some epithelial cells in mouse tissues. Histochem J. 1987;19:225–234. doi: 10.1007/BF01680633. [DOI] [PubMed] [Google Scholar]
- Landgraf P, Rusu M, Sheridan R, Sewer A, Iovino N, Aravin A, Pfeffer S, Rice A, Kamphorst AO, Landthaler M, Lin C, Socci ND, Hermida L, Fulci V, Chiaretti S, Foà R, Schliwka J, Fuchs U, Novosel A, Müller RU, et al. A mammalian microRNA expression atlas based on small RNA library sequencing. Cell. 2007;129:1401–1414. doi: 10.1016/j.cell.2007.04.040. [DOI] [PMC free article] [PubMed] [Google Scholar]
- Langowski JL, Zhang X, Wu L, Mattson JD, Chen T, Smith K, Basham B, McClanahan T, Kastelein RA, Oft M. IL-23 promotes tumour incidence and growth. Nature. 2006;442:461–465. doi: 10.1038/nature04808. [DOI] [PubMed] [Google Scholar]
- Li P, Murphy TH. Two-photon imaging during prolonged middle cerebral artery occlusion in mice reveals recovery of dendritic structure after reperfusion. J Neurosci. 2008;28:11970–11979. doi: 10.1523/JNEUROSCI.3724-08.2008. [DOI] [PMC free article] [PubMed] [Google Scholar]
- Linnstaedt SD, Gottwein E, Skalsky RL, Luftig MA, Cullen BR. Virally induced cellular microRNA miR-155 plays a key role in B-cell immortalization by Epstein-Barr virus. J Virol. 2010;84:11670–11678. doi: 10.1128/JVI.01248-10. [DOI] [PMC free article] [PubMed] [Google Scholar]
- Lippman JJ, Lordkipanidze T, Buell ME, Yoon SO, Dunaevsky A. Morphogenesis and regulation of Bergmann glial processes during Purkinje cell dendritic spine ensheathment and synaptogenesis. Glia. 2008;56:1463–1477. doi: 10.1002/glia.20712. [DOI] [PMC free article] [PubMed] [Google Scholar]
- Liu DZ, Tian Y, Ander BP, Xu H, Stamova BS, Zhan X, Turner RJ, Jickling G, Sharp FR. Brain and blood microRNA expression profiling of ischemic stroke, intracerebral hemorrhage, and kainate seizures. J Cereb Blood Flow Metab. 2010;30:92–101. doi: 10.1038/jcbfm.2009.186. [DOI] [PMC free article] [PubMed] [Google Scholar]
- Liu XS, Zhang ZG, Zhang RL, Gregg S, Morris DC, Wang Y, Chopp M. Stroke induces gene profile changes associated with neurogenesis and angiogenesis in adult subventricular zone progenitor cells. J Cereb Blood Flow Metab. 2007;27:564–574. doi: 10.1038/sj.jcbfm.9600371. [DOI] [PubMed] [Google Scholar]
- Liu Y, Ao LJ, Lu G, Leong E, Liu Q, Wang XH, Zhu XL, Sun TF, Fei Z, Jiu T, Hu X, Poon WS. Quantitative gait analysis of long-term locomotion deficits in classical unilateral striatal intracerebral hemorrhage rat model. Behav Brain Res. 2013;257:166–177. doi: 10.1016/j.bbr.2013.10.007. [DOI] [PubMed] [Google Scholar]
- Lopez-Ramirez MA, Wu D, Pryce G, Simpson JE, Reijerkerk A, King-Robson J, Kay O, de Vries HE, Hirst MC, Sharrack B, Baker D, Male DK, Michael GJ, Romero IA. MicroRNA-155 negatively affects blood-brain barrier function during neuroinflammation. FASEB J. 2014;28:2551–2565. doi: 10.1096/fj.13-248880. [DOI] [PubMed] [Google Scholar]
- López-Valdés HE, Clarkson AN, Ao Y, Charles AC, Carmichael ST, Sofroniew MV, Brennan KC. Memantine enhances recovery from stroke. Stroke. 2014;45:2093–2100. doi: 10.1161/STROKEAHA.113.004476. [DOI] [PMC free article] [PubMed] [Google Scholar]
- Lubjuhn J, Gastens A, von Wilpert G, Bargiotas P, Herrmann O, Murikinati S, Rabie T, Marti HH, Amende I, Hampton TG, Schwaninger M. Functional testing in a mouse stroke model induced by occlusion of the distal middle cerebral artery. J Neurosci Methods. 2009;184:95–103. doi: 10.1016/j.jneumeth.2009.07.029. [DOI] [PubMed] [Google Scholar]
- Marchuk DA, Srinivasan S, Squire TL, Zawistowski JS. Vascular morphogenesis: tales of two syndromes. Hum Mol Genet. 2003;12:R97–R112. doi: 10.1093/hmg/ddg103. [DOI] [PubMed] [Google Scholar]
- Mojsilovic-Petrovic J, Callaghan D, Cui H, Dean C, Stanimirovic DB, Zhang W. Hypoxia-inducible factor-1 (HIF-1) is involved in the regulation of hypoxia-stimulated expression of monocyte chemoattractant protein-1 (MCP-1/CCL2) and MCP-5 (Ccl12) in astrocytes. J Neuroinflammation. 2007;4:12. doi: 10.1186/1742-2094-4-12. [DOI] [PMC free article] [PubMed] [Google Scholar]
- Moon JM, Xu L, Giffard RG. Inhibition of microRNA-181 reduces forebrain ischemia-induced neuronal loss. J Cereb Blood Flow Metab. 2013;33:1976–1982. doi: 10.1038/jcbfm.2013.157. [DOI] [PMC free article] [PubMed] [Google Scholar]
- Motti ED, Imhof HG, Yaşargil MG. The terminal vascular bed in the superficial cortex of the rat. An SEM study of corrosion casts. J Neurosurg. 1986;65:834–846. doi: 10.3171/jns.1986.65.6.0834. [DOI] [PubMed] [Google Scholar]
- Murphy TH, Corbett D. Plasticity during stroke recovery: from synapse to behaviour. Nat Rev Neurosci. 2009;10:861–872. doi: 10.1038/nrn2735. [DOI] [PubMed] [Google Scholar]
- Murugaiyan G, Beynon V, Mittal A, Joller N, Weiner HL. Silencing microRNA-155 ameliorates experimental autoimmune encephalomyelitis. J Immunol. 2011;187:2213–2221. doi: 10.4049/jimmunol.1003952. [DOI] [PMC free article] [PubMed] [Google Scholar]
- Navaratna D, Guo S, Arai K, Lo EH. Mechanisms and targets for angiogenic therapy after stroke. Cell Adh Migr. 2009;3:216–223. doi: 10.4161/cam.3.2.8396. [DOI] [PMC free article] [PubMed] [Google Scholar]
- O'Connell RM, Kahn D, Gibson WS, Round JL, Scholz RL, Chaudhuri AA, Kahn ME, Rao DS, Baltimore D. MicroRNA-155 promotes autoimmune inflammation by enhancing inflammatory T cell development. Immunity. 2010;33:607–619. doi: 10.1016/j.immuni.2010.09.009. [DOI] [PMC free article] [PubMed] [Google Scholar]
- Ohtsuki S, Yamaguchi H, Katsukura Y, Asashima T, Terasaki T. mRNA expression levels of tight junction protein genes in mouse brain capillary endothelial cells highly purified by magnetic cell sorting. J Neurochem. 2008;104:147–154. doi: 10.1111/j.1471-4159.2007.05008.x. [DOI] [PubMed] [Google Scholar]
- Pardali E, Goumans MJ, ten Dijke P. Signaling by members of the TGF-beta family in vascular morphogenesis and disease. Trends Cell Biol. 2010;20:556–567. doi: 10.1016/j.tcb.2010.06.006. [DOI] [PubMed] [Google Scholar]
- Park SY, Marasini S, Kim GH, Ku T, Choi C, Park MY, Kim EH, Lee YD, Suh-Kim H, Kim SS. A method for generating a mouse model of stroke: evaluation of parameters for blood flow, behavior, and survival [corrected] Exp Neurobiol. 2014;23:104–114. doi: 10.5607/en.2014.23.1.104. [DOI] [PMC free article] [PubMed] [Google Scholar]
- Pecot CV, Rupaimoole R, Yang D, Akbani R, Ivan C, Lu C, Wu S, Han HD, Shah MY, Rodriguez-Aguayo C, Bottsford-Miller J, Liu Y, Kim SB, Unruh A, Gonzalez-Villasana V, Huang L, Zand B, Moreno-Smith M, Mangala LS, Taylor M, et al. Tumour angiogenesis regulation by the miR-200 family. Nat Commun. 2013;4:2427. doi: 10.1038/ncomms3427. [DOI] [PMC free article] [PubMed] [Google Scholar]
- Pena-Philippides JC, Yang Y, Bragina O, Hagberg S, Nemoto E, Roitbak T. Effect of pulsed electromagnetic field (PEMF) on infarct size and inflammation after cerebral ischemia in mice. Transl Stroke Res. 2014;5:491–500. doi: 10.1007/s12975-014-0334-1. [DOI] [PMC free article] [PubMed] [Google Scholar]
- Peng H, Sola A, Moore J, Wen T. Caspase inhibition by cardiotrophin-1 prevents neuronal death in vivo and in vitro. J Neurosci Res. 2010;88:1041–1051. doi: 10.1002/jnr.22269. [DOI] [PubMed] [Google Scholar]
- Pfeiffer F, Schäfer J, Lyck R, Makrides V, Brunner S, Schaeren-Wiemers N, Deutsch U, Engelhardt B. Claudin-1 induced sealing of blood-brain barrier tight junctions ameliorates chronic experimental autoimmune encephalomyelitis. Acta Neuropathol. 2011;122:601–614. doi: 10.1007/s00401-011-0883-2. [DOI] [PMC free article] [PubMed] [Google Scholar]
- Porter GA, Palade GE, Milici AJ. Differential binding of the lectins Griffonia simplicifolia I and Lycopersicon esculentum to microvascular endothelium: organ-specific localization and partial glycoprotein characterization. Eur J Cell Biol. 1990;51:85–95. [PubMed] [Google Scholar]
- Predescu D, Predescu S, Shimizu J, Miyawaki-Shimizu K, Malik AB. Constitutive eNOS-derived nitric oxide is a determinant of endothelial junctional integrity. Am J Physiol Lung Cell Mol Physiol. 2005;289:L371–L381. doi: 10.1152/ajplung.00175.2004. [DOI] [PubMed] [Google Scholar]
- Rai D, Kim SW, McKeller MR, Dahia PL, Aguiar RC. Targeting of SMAD5 links microRNA-155 to the TGF-beta pathway and lymphomagenesis. Proc Natl Acad Sci U S A. 2010;107:3111–3116. doi: 10.1073/pnas.0910667107. [DOI] [PMC free article] [PubMed] [Google Scholar]
- Roitbak T, Bragina O, Padilla JL, Pickett GG. The role of microRNAs in neural stem cell-supported endothelial morphogenesis. Vasc Cell. 2011;3:25. doi: 10.1186/2045-824X-3-25. [DOI] [PMC free article] [PubMed] [Google Scholar]
- Rothhammer T, Bataille F, Spruss T, Eissner G, Bosserhoff AK. Functional implication of BMP4 expression on angiogenesis in malignant melanoma. Oncogene. 2007;26:4158–4170. doi: 10.1038/sj.onc.1210182. [DOI] [PubMed] [Google Scholar]
- Schiszler I, Tomita M, Fukuuchi Y, Tanahashi N, Inoue K. New optical method for analyzing cortical blood flow heterogeneity in small animals: validation of the method. Am J Physiol Heart Circ Physiol. 2000;279:H1291–H1298. doi: 10.1152/ajpheart.2000.279.3.H1291. [DOI] [PubMed] [Google Scholar]
- Seylaz J, Charbonné R, Nanri K, Von Euw D, Borredon J, Kacem K, Meric P, Pinard E. Dynamic in vivo measurement of erythrocyte velocity and flow in capillaries and of microvessel diameter in the rat brain by confocal laser microscopy. J Cereb Blood Flow Metab. 1999;19:863–870. doi: 10.1097/00004647-199908000-00005. [DOI] [PubMed] [Google Scholar]
- Shi MA, Shi GP. Intracellular delivery strategies for microRNAs and potential therapies for human cardiovascular diseases. Sci Signal. 2010;3:pe40. doi: 10.1126/scisignal.3146pe40. [DOI] [PMC free article] [PubMed] [Google Scholar]
- Sola A, Peng H, Rogido M, Wen TC. Animal models of neonatal stroke and response to erythropoietin and cardiotrophin-1. Int J Dev Neurosci. 2008;26:27–35. doi: 10.1016/j.ijdevneu.2007.08.016. [DOI] [PubMed] [Google Scholar]
- Srivastava K, Bath PM, Bayraktutan U. Current therapeutic strategies to mitigate the eNOS dysfunction in ischaemic stroke. Cell Mol Neurobiol. 2012;32:319–336. doi: 10.1007/s10571-011-9777-z. [DOI] [PMC free article] [PubMed] [Google Scholar]
- Suárez Y, Fernández-Hernando C, Pober JS, Sessa WC. Dicer dependent microRNAs regulate gene expression and functions in human endothelial cells. Circ Res. 2007;100:1164–1173. doi: 10.1161/01.RES.0000265065.26744.17. [DOI] [PubMed] [Google Scholar]
- Sun HX, Zeng DY, Li RT, Pang RP, Yang H, Hu YL, Zhang Q, Jiang Y, Huang LY, Tang YB, Yan GJ, Zhou JG. Essential role of microRNA-155 in regulating endothelium-dependent vasorelaxation by targeting endothelial nitric oxide synthase. Hypertension. 2012;60:1407–1414. doi: 10.1161/HYPERTENSIONAHA.112.197301. [DOI] [PubMed] [Google Scholar]
- Swanson RA, Morton MT, Tsao-Wu G, Savalos RA, Davidson C, Sharp FR. A semiautomated method for measuring brain infarct volume. J Cereb Blood Flow Metab. 1990;10:290–293. doi: 10.1038/jcbfm.1990.47. [DOI] [PubMed] [Google Scholar]
- Takeshita F, Patrawala L, Osaki M, Takahashi RU, Yamamoto Y, Kosaka N, Kawamata M, Kelnar K, Bader AG, Brown D, Ochiya T. Systemic delivery of synthetic microRNA-16 inhibits the growth of metastatic prostate tumors via downregulation of multiple cell-cycle genes. Mol Ther. 2010;18:181–187. doi: 10.1038/mt.2009.207. [DOI] [PMC free article] [PubMed] [Google Scholar]
- Tian R, Wang RL, Xie H, Jin W, Yu KL. Overexpressed miRNA-155 dysregulates intestinal epithelial apical junctional complex in severe acute pancreatitis. World J Gastroenterol. 2013;19:8282–8291. doi: 10.3748/wjg.v19.i45.8282. [DOI] [PMC free article] [PubMed] [Google Scholar]
- Ueno Y, Chopp M, Zhang L, Buller B, Liu Z, Lehman NL, Liu XS, Zhang Y, Roberts C, Zhang ZG. Axonal outgrowth and dendritic plasticity in the cortical peri-infarct area after experimental stroke. Stroke. 2012;43:2221–2228. doi: 10.1161/STROKEAHA.111.646224. [DOI] [PMC free article] [PubMed] [Google Scholar]
- van Solingen C, Araldi E, Chamorro-Jorganes A, Fernández-Hernando C, Suárez Y. Improved repair of dermal wounds in mice lacking microRNA-155. J Cell Mol Med. 2014;18:1104–1112. doi: 10.1111/jcmm.12255. [DOI] [PMC free article] [PubMed] [Google Scholar]
- Varendi K, Kumar A, Härma MA, Andressoo JO. miR-1, miR-10b, miR-155, and miR-191 are novel regulators of BDNF. Cell Mol Life Sci. 2014;71:4443–4456. doi: 10.1007/s00018-014-1628-x. [DOI] [PMC free article] [PubMed] [Google Scholar]
- Wan G, Xie W, Liu Z, Xu W, Lao Y, Huang N, Cui K, Liao M, He J, Jiang Y, Yang BB, Xu H, Xu N, Zhang Y. Hypoxia-induced MIR155 is a potent autophagy inducer by targeting multiple players in the MTOR pathway. Autophagy. 2014;10:70–79. doi: 10.4161/auto.26534. [DOI] [PMC free article] [PubMed] [Google Scholar]
- Wang J, Yang K, Zhou L, Minhaowu, Wu Y, Zhu M, Lai X, Chen T, Feng L, Li M, Huang C, Zhong Q, Huang X. MicroRNA-155 promotes autophagy to eliminate intracellular mycobacteria by targeting Rheb. PLoS Pathog. 2013;9:e1003697. doi: 10.1371/journal.ppat.1003697. [DOI] [PMC free article] [PubMed] [Google Scholar]
- Wang Y, Bontempi B, Hong SM, Mehta K, Weinstein PR, Abrams GM, Liu J. A comprehensive analysis of gait impairment after experimental stroke and the therapeutic effect of environmental enrichment in rats. J Cereb Blood Flow Metab. 2008;28:1936–1950. doi: 10.1038/jcbfm.2008.82. [DOI] [PubMed] [Google Scholar]
- Weber M, Kim S, Patterson N, Rooney K, Searles CD. MiRNA-155 targets myosin light chain kinase and modulates actin cytoskeleton organization in endothelial cells. Am J Physiol Heart Circ Physiol. 2014;306:H1192–H1203. doi: 10.1152/ajpheart.00521.2013. [DOI] [PMC free article] [PubMed] [Google Scholar]
- Wiggins JF, Ruffino L, Kelnar K, Omotola M, Patrawala L, Brown D, Bader AG. Development of a lung cancer therapeutic based on the tumor suppressor microRNA-34. Cancer Res. 2010;70:5923–5930. doi: 10.1158/0008-5472.CAN-10-0655. [DOI] [PMC free article] [PubMed] [Google Scholar]
- Xiong Y, Mahmood A, Chopp M. Angiogenesis, neurogenesis and brain recovery of function following injury. Curr Opin Investig Drugs. 2010;11:298–308. [PMC free article] [PubMed] [Google Scholar]
- Yamanaka Y, Tagawa H, Takahashi N, Watanabe A, Guo YM, Iwamoto K, Yamashita J, Saitoh H, Kameoka Y, Shimizu N, Ichinohasama R, Sawada K. Aberrant overexpression of microRNAs activate AKT signaling via down-regulation of tumor suppressors in natural killer-cell lymphoma/leukemia. Blood. 2009;114:3265–3275. doi: 10.1182/blood-2009-06-222794. [DOI] [PubMed] [Google Scholar]
- Yin Q, Wang X, Fewell C, Cameron J, Zhu H, Baddoo M, Lin Z, Flemington EK. MicroRNA miR-155 inhibits bone morphogenetic protein (BMP) signaling and BMP-mediated Epstein-Barr virus reactivation. J Virol. 2010;84:6318–6327. doi: 10.1128/JVI.00635-10. [DOI] [PMC free article] [PubMed] [Google Scholar]
- Zhang M, Zhou X, Wang B, Yung BC, Lee LJ, Ghoshal K, Lee RJ. Lactosylated gramicidin-based lipid nanoparticles (Lac-GLN) for targeted delivery of anti-miR-155 to hepatocellular carcinoma. J Control Release. 2013;168:251–261. doi: 10.1016/j.jconrel.2013.03.020. [DOI] [PMC free article] [PubMed] [Google Scholar]
- Zhang ZG, Chopp M. Neurorestorative therapies for stroke: underlying mechanisms and translation to the clinic. Lancet Neurol. 2009;8:491–500. doi: 10.1016/S1474-4422(09)70061-4. [DOI] [PMC free article] [PubMed] [Google Scholar]
- Zhu N, Zhang D, Chen S, Liu X, Lin L, Huang X, Guo Z, Liu J, Wang Y, Yuan W, Qin Y. Endothelial enriched microRNAs regulate angiotensin II-induced endothelial inflammation and migration. Atherosclerosis. 2011;215:286–293. doi: 10.1016/j.atherosclerosis.2010.12.024. [DOI] [PubMed] [Google Scholar]