

Abstract
The hippocampal theta oscillation is strongly correlated with behaviors such as memory and spatial navigation, but we do not understand its specific functional role. One hint of theta's function came from the discovery in rodents that theta oscillations are traveling waves that allow parts of the hippocampus to simultaneously exhibit separate oscillatory phases. Because hippocampal theta oscillations in humans have different properties compared with rodents, we examined these signals directly using multielectrode recordings from neurosurgical patients. Our findings confirm that human hippocampal theta oscillations are traveling waves, but also show that these oscillations appear at a broader range of frequencies compared with rodents. Human traveling waves showed a distinctive pattern of spatial propagation such that there is a consistent phase spread across the hippocampus regardless of the oscillations' frequency. This suggests that traveling theta oscillations are important functionally in humans because they coordinate phase coding throughout the hippocampus in a consistent manner.
SIGNIFICANCE STATEMENT We show for the first time in humans that hippocampal theta oscillations are traveling waves, moving along the length of the hippocampus in a posterior–anterior direction. The existence of these traveling theta waves is important for understanding hippocampal neural coding because they cause neurons at separate positions in the hippocampus to experience different theta phases simultaneously. The theta phase that a neuron measures is a key factor in how that cell represents behavioral information. Therefore, the existence of traveling theta waves indicates that, to fully understand how a hippocampal neuron represents information, it is vital to also account for that cell's location in addition to conventional measures of neural activity.
Keywords: ECoG, hippocampus, theta oscillation, traveling wave
Introduction
The hippocampal theta oscillation is a key brain signal that underlies various aspects of cognition and behavior, including memory and spatial navigation (Winson, 1978; Seager et al., 2002). Theta has been implicated in many critical aspects of neuronal processing because it increases in amplitude during hippocampally dependent behaviors (Vanderwolf, 1969), modulates synaptic plasticity (Pavlides et al., 1988; Huerta and Lisman, 1993), and coordinates brain-wide neuronal networks (Miller, 1991; Buzsáki, 1996; Siapas et al., 2005; Sirota et al., 2008). For these reasons, characterizing hippocampal theta is important for understanding how the brain supports a range of behaviors.
Traditionally the theta rhythm was thought to indicate when the hippocampus as a whole transitions between processing states (Pavlides et al., 1988; Stewart and Fox, 1990; Miller, 1991; Hasselmo et al., 2002). However, recent studies suggested a new view of theta's function by showing that separate segments of the hippocampus simultaneously exhibit different theta phases, with the wave traveling continuously along the septal-temporal axis (Lubenov and Siapas, 2009; Patel et al., 2012). One theory suggests that hippocampal neurons signal future or past events by activating at late or early theta phases (Dragoi and Buzsáki, 2006; Lubenov and Siapas, 2009). Therefore, the existence of phase variations across the hippocampus indicates that neurons at different positions simultaneously represent information about events at different times. This intriguing idea suggests that, to fully understand hippocampal coding, it is not sufficient to examine the rate and timing of each cell's spiking (Jensen and Lisman, 2000; Huxter et al., 2003; Dragoi and Buzsáki, 2006), we also must take into account each cell's location relative to theta traveling waves (Lubenov and Siapas, 2009).
Despite the fact that theta oscillations are central to many general neural models of behavior, there is uncertainty about whether theta oscillations are present in all species. Early work suggested that the human hippocampus does not exhibit theta (Halgren et al., 1978; Arnolds et al., 1980). Later work showed evidence of task-related theta in human hippocampus (Ekstrom et al., 2005; Watrous et al., 2011; Lega et al., 2012), but with key differences compared with rodents, including decreases in amplitude, duration, and frequency (Watrous et al., 2013a; Jacobs, 2014). Our primary goal is to test whether the rodent finding of theta as a traveling wave persists in humans despite these interspecies differences.
We examined the spatial properties of human hippocampal theta oscillations by recording from epilepsy patients implanted with depth electrodes for seizure monitoring. These patients had depth electrodes implanted along the longitudinal (septal–temporal or posterior–anterior) axis of their hippocampus. Each probe had multiple contacts, which provided multiple measurements of individual theta waves. We used spatial and spectral methods to analyze these recordings and characterize theta's frequency and propagation speed. Our findings indicate that human hippocampal theta waves do behave as traveling waves, moving along the hippocampus from septal to temporal structures, but that they have distinctive spectral properties compared with rodents, which are informative regarding the mechanisms underlying theta's generation and propagation.
Materials and Methods
Patients and electrophysiology.
We recorded brain activity from 14 epilepsy patients who had electrodes implanted to map the extent of their seizures for subsequent resective surgery. Seven of the patients are male and seven are female. These patients had depth electrodes targeting their hippocampus with a posterior approach. During recording, patients performed a working-memory task on a bedside laptop computer. Data from these patients were reported previously (Jacobs and Kahana, 2009; van Gerven et al., 2013), but the analyses described here are novel. We analyzed data from this task's encoding trials, which ranged between 530 and 1280 observations per patient. Each observation for our data analyses corresponded to a 1 s period when the patient encoded one item into memory. These periods each extended from 200 ms before each item presentation to 800 ms afterward.
Electrode locations were identified by inspecting post-implant CT scans, which were then aligned with MRI scans from before electrode implantation. We computed each electrode location in 3D space using Talairach coordinates and distinguished electrodes that were located outside of the hippocampus (Talairach and Tournoux, 1988; Insausti and Amaral, 2004). We computed the absolute value of the Talairach x-coordinate to analyze depth electrode angles while combining across left and right hemispheres. Individual patients' MRI and CT scans were inspected to verify and occasionally correct the automatic localizations.
As described below, our data analyses consisted of three steps to characterize traveling theta oscillations: (1) identifying clusters of electrodes that exhibited theta oscillations at the same frequency, (2) testing whether the electrodes in these theta clusters exhibited instantaneous phase synchrony, and (3) examining spatial gradients of theta phase to identify traveling waves.
Identifying groups of electrodes with theta oscillations.
First, we downsampled the data to 250 Hz and rereferenced each electrode's raw signal, as in other studies on traveling brain oscillations waves in human intracranial and scalp recordings (Massimini et al., 2004; De Munck et al., 2007; Patten et al., 2012; van der Meij et al., 2012; Alexander et al., 2013; Bahramisharif et al., 2013). We used average referencing because it seemed to reveal larger theta signals and because it provided one more electrode for data analysis rather than requiring the removal of a single reference electrode. Nonetheless, we performed these analyses with multiple referencing methods and found that the traveling wave patterns generally remained consistent regardless of the referencing method used, which is consistent with previous findings (Patten et al., 2012; van der Meij et al., 2012). In one version of our analyses, we measured the signal's kurtosis to exclude atypical neural traces (Sederberg et al., 2007a), with thresholds of 4 and 6 excluding 26% and 6% of trials, respectively.
We then used Morlet wavelets to measure the instantaneous power and phase at each electrode for 33 frequencies logarithmically spaced from 2 to 32 Hz (wave number = 6). Here, we refer to human hippocampal oscillations at 2–10 Hz as “theta” because previous work showed that these signals have similar functional properties as the ∼8 Hz “theta” oscillations in rodents (Jacobs et al., 2007; Watrous et al., 2011; Lega et al., 2012). We prefer this naming scheme because it emphasizes the functional link between human hippocampal oscillations and rodent theta, rather than reinforcing the notion that brain oscillations should be solely defined on the basis of fixed frequency ranges (for expanded discussion, see Jacobs, 2014).
Our next objective was to identify narrowband oscillatory peaks that surpassed each electrode's background power spectrum, which generally is distributed as 1/f (Freeman, 2004; Miller et al., 2007; Manning et al., 2009; Hughes et al., 2012). To detect significant narrowband oscillations, we first fit each electrode's background 1/f using a robust regression in log–log coordinates. Then, we subtracted away this background signal to reveal a corrected power spectrum that emphasizes the presence of narrowband peaks (see Fig. 1). To identify narrowband peaks, we set a threshold of the mean of the corrected power spectrum plus 1 SD. We then designated significant narrow-band peaks as local maxima exceeding this threshold.
Figure 1.

An example hippocampal traveling wave. A, Axial MRI of a patient who had electrodes implanted along the length of the hippocampus. Electrode locations are denoted by the black imaging artifacts. Colored circles are labels indicating correspondence between electrodes in A and C. B, Sagittal MRI from this same patient. C, Raw EEG theta waveform signal recorded for 5 s from 6 consecutive depth electrodes. The electrodes are ordered from anterior (top of plot) to posterior (bottom). D, Band-pass filtered (3–5 Hz) version of the EEG trace from C. Red asterisks denote the peaks of individual theta cycles. E, Color map plotting the filtered theta traces from D. Red denotes the peak of the oscillation and blue denotes troughs.
We used a sliding window to identify narrowband oscillations that appear simultaneously at multiple electrodes in each depth probe. We moved a 2 Hz window in 0.5 Hz increments across the frequency spectrum, each time counting the number of electrodes that showed oscillatory peaks within that range. We defined a cluster to be four or more electrodes that showed a peak within the window. We included only the peak window in cases where consecutive windows exceeded this threshold. The central frequency of each cluster was assigned as the mean of the peak frequencies from the individual electrodes that comprise the cluster.
Detecting theta traveling waves.
For each cluster's central frequency, at each electrode, we computed the instantaneous phase at each time point using the Hilbert transform (Freeman, 2004, 2007). We computed a single reference phase for each time point as the circular mean (Fisher, 1993) of the phases from individual electrodes. We then measured each electrode's phase shift as the circular difference compared with the cluster reference. Each electrode's phase shift thus indicates whether, at any given moment, a particular electrode's oscillation is ahead of or behind the cluster's mean phase (negative or positive phase shifts, respectively).
We used circular statistics to test whether there were consistent theta-phase patterns within these oscillatory clusters (Fisher, 1993). For each cluster, we computed each electrode's mean phase shift and then assessed the distribution of phase shifts across trials. A nonuniform distribution of phase shifts indicates that a consistent phase pattern is present across trials at a given electrode. We assessed each electrode's stability within the cluster by measuring the mean circular vector length of its phase differences, r̄. We included a given electrode in a cluster if it exhibited significant phase coupling with the other cluster members at the level of individual trials using a Rayleigh test (p < 10− 20 or r̄ > 0.6).
We characterized traveling waves by examining the spatial distribution of phase shifts across the electrodes in each cluster. We used a permutation procedure to assess the statistical significance of the traveling wave in each individual theta cluster. This procedure used a customized shuffling approach to test for a relation between electrode location and the relative theta phase it measures. For both the true and shuffled data, we used a regression to model the relation between phase shift and electrode position, with the resultant r2 indicating the magnitude of the traveling wave pattern. Our shuffling procedure randomly permuted the locations of the electrodes 10,000 times. We then assessed the statistical significance of the traveling wave pattern in the real data by comparing the real r2 with the distribution of r2 values from the shuffled data. Significant waves had an r2 exceeding the 95th percentile of the shuffled data's r2, which corresponds to a threshold of p < 0.05.
Because the model is calculated to fit the relation between phase (in degrees) and electrode position (in millimeters), the slope of the regression line reveals the cluster's rate of theta-phase change across space (see Fig. 4D). This number is the cluster's wave number, k, which we compute in units of degrees per millimeter. We use k to indicate the cluster's propagation speed s, in units of meters per second, with the formula s = , where ω is the cluster's temporal frequency. We also compute the wavelength λ of each theta traveling wave as follows: λ = .
Figure 4.

Population analysis of hippocampal traveling waves. A, Histogram of the frequency of each traveling theta wave. B, Speeds of traveling theta waves moving through the hippocampus. All waves traveled in a posterior–anterior direction. C, Scatter plot indicating the relation between traveling-wave frequency and speed. Red line indicates a best-fit regression line. D, Histogram of the spatial frequencies of hippocampal traveling theta waves.
Spatial dynamics of theta phase.
The first method we used to examine the range of phase shifts within individual theta clusters involves examining phase differences across all pairwise combinations of electrodes within a cluster. A cluster with n electrodes has electrode pairs. For each pair, we computed two differences: a phase difference and spatial distance between the two electrodes' Talairach coordinates. We then pooled these differences across patients to perform an across-electrode measurement of the rate of phase change across space. To estimate the range of theta phase that is expressed across the entire hippocampus, we pooled data across subjects by aligning each subject's data to a single fixed reference point (Talairach x = ±24, y = −8, z = −20; Talairach and Tournoux, 1988). We then readjusted each electrode's phase shift so that it was measured relative to this fixed reference point and plotted it together (see Fig. 5B).
Figure 5.

Analysis of relative theta phase across the hippocampus. A, Theta-phase differences across all pairs of electrodes within each theta traveling wave. Each point depicts a single electrode pair, with color distinguishing electrodes from separate patients. The horizontal coordinate indicates the distance between the electrodes in the pair. The vertical coordinate indicates the phase differences observed for the theta oscillations at each electrode. Negative phases denote that theta phase progresses in a posterior–anterior direction. Red line denotes the best fit regression line. B, Normalized theta phase at each electrode where a traveling hippocampal theta wave was observed. Each point denotes one electrode. The horizontal coordinate indicates the electrode's distance to the anterior tip of hippocampus in Talairach space. The vertical coordinate indicates the electrode's estimated phase difference relative to the tip of the hippocampus (see Materials and Methods). Red line denotes the best fit regression line.
Results
To characterize the spatial dynamics of human hippocampal theta oscillations, we recorded signals from epilepsy patients who had one or more multicontact depth electrodes surgically implanted along the long axis of their hippocampus for seizure mapping (Fig. 1A,B). Each depth electrode contained multiple recording contacts spaced at an interval of 5 mm along the “long” axis of the hippocampus, which extends in a septal–temporal or posterior–anterior direction and is structurally analogous to the dorsal–ventral axis in rodents (Lubenov and Siapas, 2009; Patel et al., 2012). We analyzed recordings from periods between clinical procedures when patients were awake and performing the encoding phase of a memory task on a laptop computer (Jacobs and Kahana, 2009, 2010).
Our initial observations provided evidence of signals propagating along the length of the hippocampus (Fig. 1). Figure 1C illustrates this phenomenon in recordings from six neighboring contacts in one patient. We observed theta-band signals on multiple contacts. The time points of theta peaks systematically shifted later in time in relation to the electrode's position along the long axis of the hippocampus, with greater delays corresponding to increasingly anterior locations (Fig. 1D). Figure 1E reveals this pattern using spectral analysis, plotting the phase of this signal as a function of space and time. This plot displays diagonal bands, which are evidence of a traveling oscillation, by showing that the phase systematically shifts with position. After these initial observations, we designed follow-up analyses to fully characterize traveling waves across the complete dataset.
Characterizing simultaneous multisite recordings of human hippocampal theta
A prerequisite for studying traveling oscillations is to record a single oscillation from multiple locations. This is a challenge in the human hippocampus, where theta signals can be unreliable. Some researchers have reported the inability to identify even a single electrode with a reliable theta oscillation (Halgren et al., 1978; Arnolds et al., 1980). There are several challenges to measuring hippocampal theta oscillations in epilepsy patients, including the variable positions of clinically implanted electrodes (O'Keefe and Burgess, 1999) and human hippocampal theta's lower amplitude and slower frequency (Jacobs, 2014).
We addressed these issues by designing a signal-processing procedure that is optimized to identify groups of electrodes that simultaneously measure a single oscillation (see Materials and Methods). This procedure targets electrodes with strong narrow-band oscillations at a single shared frequency, minimizing potential errors from electrodes with weaker signals. In this procedure, we compute each electrode's power spectrum using wavelets and then identify electrodes with narrowband oscillations that are visible above the 1/f background power spectrum (Miller et al., 2007; Manning et al., 2009; Lega et al., 2012), and then identify clusters of four or more electrodes with oscillations at the same frequency.
We used this approach to identify groups of electrodes that oscillated together at frequencies from 2 to 10 Hz. Consistent with previous findings in the human hippocampus (Jacobs, 2014), we observed oscillatory clusters at the broader theta range of 2–4 Hz in addition to the conventional “theta” band of 4–8 Hz. All of the 14 patients had at least one depth electrode that exhibited a theta-band peak. This consisted of 106 (66%) of 160 total depth electrode contacts. Sixty-three of these electrodes fell into clusters of at least four electrodes (spanning 11 clusters in 10 patients—one patient had two depth probes). The next step of our analyses examines the spatial phase dynamics across these theta clusters to identify traveling waves.
Characterizing the spatial characteristics of hippocampal traveling waves
We compared the theta phase between electrodes within each cluster to assess whether there is a consistent interelectrode phase pattern. A consistent phase pattern is a requirement for observing a traveling wave, but there has been evidence that human theta oscillations exhibit independent phases between neighboring cortical areas (Raghavachari et al., 2006). We characterized phase consistency by measuring each electrode's instantaneous theta phase and then computing whether each site had a consistent phase shift relative to the cluster overall (see Materials and Methods). All of the theta clusters that we observed exhibited electrodes with significant phase synchrony. Across all clusters, 81% of electrodes (51 of the 63 electrodes) exhibited significant phase consistency with the cluster mean. This indicates that our methods reliably identify clusters of hippocampal electrodes that have consistent theta-phase relations. Our next step was to determine whether these synchronized cluster phase patterns exhibit traveling waves.
We measured the spatial progression of phase across each cluster using a linear regression to model the relation between theta-phase lag and electrode location. This identified electrode clusters that exhibited significant traveling theta waves and measured three key properties of these signals: direction, propagation speed, and spatial wavelength. For example, Figure 2, D and E, depicts a cluster of six electrodes where the relative phase lag systematically varies along a depth electrode across a range of 18°, from −6° at the most posterior site to 12° at the most anterior electrode. In this measurement scheme, the entire cluster has a mean phase of 0° and the wave moves in a posterior–anterior direction from locations with negative phase lags to those with positive ones. Figure 3 shows an additional example of a theta traveling wave in a different patient.
Figure 2.
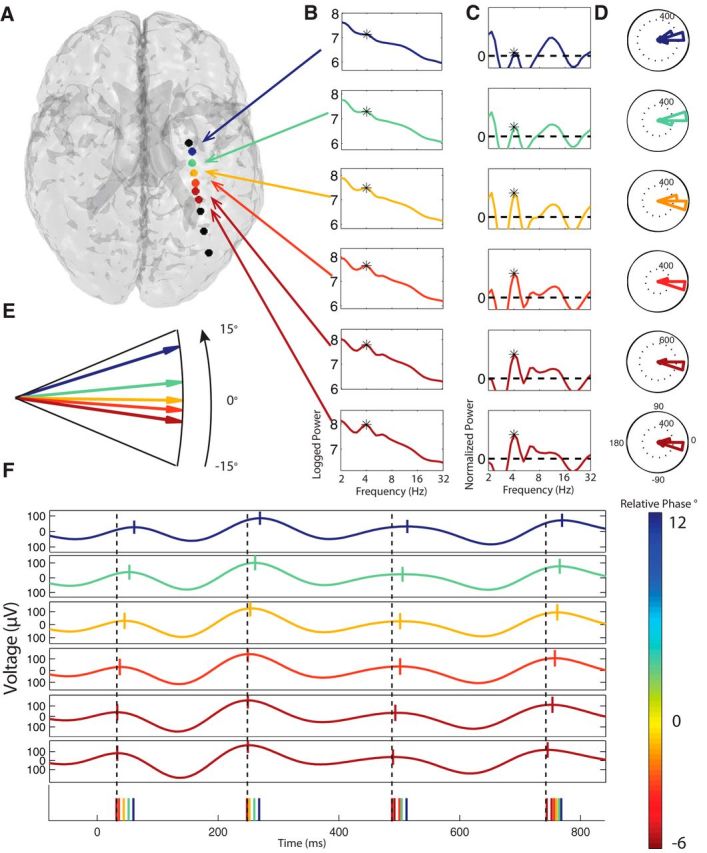
Example hippocampal ∼4 Hz traveling theta waves. A, Brain image depicting the locations of the depth electrodes implanted in Patient 3. Colored circles denote electrodes. For each electrode in a theta cluster (see Materials and Methods), color indicates the relative phase of the oscillation at that electrode (see color bar in bottom right). Black denotes electrodes where theta was not observed. From top to bottom, electrodes 1, 2, 3, and 4 were manually localized to the hippocampus. B, Power spectra at electrodes where significant theta-band oscillations were observed. Black asterisk denotes the frequency with significant theta narrowband oscillations. C, Normalized power spectra, computed by removing the 1/f background signal from the power spectra in B. D, Histogram of the relative phases of theta oscillations measured from each electrode across trials. Phase moves in a counterclockwise direction in these plots, so each theta cycle is first encountered at the electrode at the bottom of the plot (negative relative phase) and last reaches the electrode at the top of the plot (positive relative phase). E, Phase detail plot indicating the relative phase of each electrode's theta oscillation. Colored arrows indicating an orderly progression of phase from the most posterior (red) to the most anterior electrode. F, Example EEG traces from each electrode. Vertical ticks denote the peak phase. Black dotted line is a reference indicating the time point of the phase of the bottom (most posterior) electrode. Bottom row of the plot illustrates the time points when each electrode reached its peak phase. The ordering of the colored ticks indicates the relative time points when each electrode exhibited a theta peak.
Figure 3.
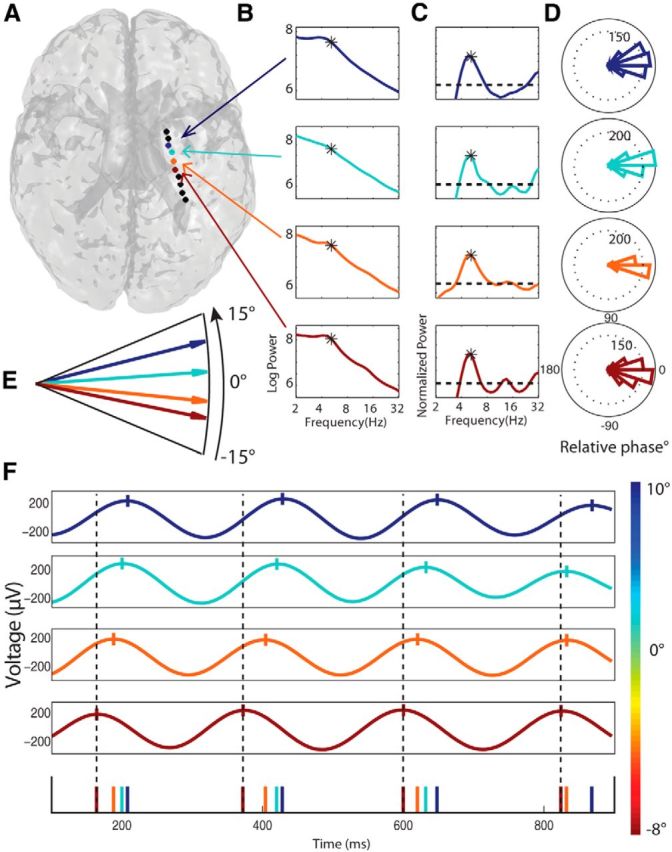
Example hippocampal traveling theta waves at ∼5.2 Hz. A–F, Plots indicating a hippocampal traveling wave observed in one patient's right hippocampus. Format for individual panels is the same as for Figure 2. From top to bottom, electrodes 3, 4, 5, and 6 were manually localized to the hippocampus.
We identified traveling waves by testing for a significant relation between the theta phase and electrode position using a permutation procedure at p < 0.05 (see Materials and Methods). Of 11 theta hippocampal electrode clusters, six exhibited a traveling wave. All six of the traveling waves propagated in a posterior–anterior direction, which was a consistent unidirectional pattern that was unlikely to have occurred by chance (p < 0.02, df = 1, binomial test). This indicates that posterior–anterior movement is a significant characteristic feature of human hippocampal theta oscillations. This posterior–anterior movement is consistent with the dorsal–ventral direction of theta propagation found in rodents (Lubenov and Siapas, 2009; Patel et al., 2012), given the rotation of the hippocampus that occurred during evolution (Strange et al., 2014). These traveling-wave patterns were not related to the presence of epileptiform activity. We determined this by rerunning our statistical framework after excluding periods of data that have high kurtosis, which is a marker of abnormal neural signals (see Materials and Methods; Sederberg et al., 2007a).
Frequency analyses of traveling waves
The neural mechanism of hippocampal traveling waves remains unknown (Lubenov and Siapas, 2009; Patel et al., 2012). We hypothesized that characterizing the properties of human theta traveling waves could provide a key interspecies data point to explain how these waves propagate. Two properties are especially important for characterizing a traveling wave: temporal frequency and propagation speed. Temporal frequency measures the rate of phase change over time at a single electrode and is measured in cycles per second (Hertz). Propagation speed measures the rate at which an oscillation moves across space and is measured in meters per second. Figure 4A depicts the (temporal) frequencies of the clusters where we observed traveling theta waves, which span a range of frequencies from 2 to 8 Hz. Figure 4B reveals the wave propagation speeds that we observed, which span 1–5 m/s.
Two models for the propagation of hippocampal traveling waves are time-delayed excitation from a single oscillator (SO) and a series of weakly coupled oscillators (COs) (Ermentrout and Kleinfeld, 2001; Lubenov and Siapas, 2009; Patel et al., 2012). Because our dataset contained theta oscillations at a range of temporal frequencies (Fig. 4A), we hypothesized that comparing how different waves propagated could distinguish the model that best explained these waves' propagation. The CO model predicts a correlation between temporal frequency and propagation speed. The SO model predicts no such relation. Previous work in rodents did not have the ability to distinguish between these models because the theta oscillations measured had only a narrow range of temporal frequencies. We thus tested for a correlation between frequency and speed by aggregating across data from patients with theta oscillations at various temporal frequencies. As shown in Figure 4C, we observed a significant positive correlation between temporal frequency and propagation speed (r(4) = 0.84, p < 0.05). The result supports the CO model by showing that waves with faster temporal frequencies move more rapidly through the hippocampus (see Discussion).
An implication of the CO model is that there is a consistent spatial distribution of phase across the theta oscillations that appear throughout the hippocampus. This implies that a useful way of measuring theta propagation is by computing the spatial frequency or wave number k, which is the rate of phase change per unit space. Our analyses indicate that human theta traveling waves have a mean spatial frequency of ∼7.2 °/cm (Fig. 4D).
Progression of theta phase through the hippocampus
The existence of traveling theta oscillations implies that hippocampal neurons at different locations simultaneously experience different theta phases. Individual hippocampal subregions project to separate cortical regions (Cenquizca and Swanson, 2007; Patel et al., 2012). Therefore, to understand how the hippocampus coordinates brain-wide computations, it is important to map the range of theta phases that are expressed simultaneously. This issue is of particular importance because previous studies on this topic reported conflicting phase ranges of 360° (Lubenov and Siapas, 2009) and 180° (Patel et al., 2012).
We used two approaches to examine the range of theta phases expressed simultaneously across the hippocampus. First, we examined theta-phase differences between pairs of electrodes within individual traveling theta waves (Fig. 5A). Pairs of electrodes within an individual patient exhibited theta-phase differences of up to 23°. The magnitude of these differences correlated with interelectrode distance (r(47) = −0.71, p < 0.01) and provided an estimated spatial frequency of 6.8°/cm, similar to the measure reported above. However, because each individual patient's electrodes only cover a subset of the hippocampus, this measure did not show the full range of theta phase that appeared simultaneously.
To more fully examine theta phase across the hippocampus, we conducted a separate analysis that pooled data across patients with electrodes at different locations. First, we identified the theta-phase lag for each electrode, as in the above analyses. We then adjusted each electrode's phase lag relative to a fixed anatomical reference point (coordinate x = ±24, y = −8, z = −20; Talairach and Tournoux, 1988). Figure 5B reveals the results of this analysis, showing that we observed a total theta-phase range of 28° by examining a range of electrodes across 40 mm (r(25) = −0.82, p < 0.01). The human hippocampus has been estimated to have a length between ∼40–45 mm (Insausti and Amaral, 2004; Duvernoy, 2005) and 70 mm (Rao et al., 2012), depending on whether it is measured by counting coronal brain slices or along its curved shape, respectively. Extrapolating from these measurements, our findings suggest that the range of theta phase that is expressed simultaneously across the whole human hippocampus is ∼28–49°.
In rodents, theta-phase shifts through the layers of the hippocampus (Brankačk et al., 1993; Lubenov and Siapas, 2009). It is possible that these layer-wise phase shifts could cause the appearance of traveling waves in a depth electrode that was angled so that successive contacts sampled different layers. We examined this issue by testing whether the depth electrodes with traveling theta waves were positioned distinctively. Angles and Talairach coordinates did not significantly differ between the depth electrodes that did or did not measure traveling waves (t tests in x, y, and z directions, p > 0.15, uncorrected). There was also no relation between electrode position and traveling-wave spatial or temporal frequency (p > 0.4, Pearson's correlation). By demonstrating that there were no significant differences in the positioning of the electrodes with traveling waves, it suggests that our findings are not driven by layer-wise phase shifts within the hippocampus. This view is further supported by the hint in our data that some traveling waves extended outside of the hippocampus proper, where they would not be affected by intrahippocampal layer differences (Figs. 2, 3).
Theta power variations
A key characteristic of human theta oscillations is that they vary in amplitude during behavior (Sederberg et al., 2007b; Lega et al., 2012; Jacobs, 2014), in contrast to theta in rodents, which has a consistently high amplitude throughout sustained periods of behavior (Buzsáki, 2002). To investigate how the variability of human theta amplitude could affect traveling waves, we compared the properties of traveling waves between epochs of high or low theta power.
We used a median split to separate our dataset into periods of high and low theta power. We compared the temporal and spatial frequencies of theta between periods of high and low theta power, but did not observe significant changes between these two periods (p > 0.2). All six traveling waves exhibited increased phase consistency when theta power was elevated (t(5) = 4.6, p < 0.01). This suggests that theta power could indicate how reliable neighboring sites in the hippocampus exhibit a specific phase relationship.
Discussion
Our observation of traveling waves in the human hippocampus indicates an important interspecies link in the properties of theta oscillations and may be informative about mechanisms underlying theta's spatial propagation. Whereas hippocampal theta oscillations have been demonstrated in many rodent studies, in many cases, human data did not provide clear evidence for such signals. This discrepancy was problematic for neural models in which hippocampal theta oscillations have a critical role in supporting navigation, memory, and brain-wide network processing (Miller, 1991; Buzsáki, 2005). Our observation that human theta oscillations are traveling waves supports the general approach of studying the hippocampus of animals to make insights into the neural basis of human memory and navigation. Furthermore, aspects of our findings appear to go beyond animal studies by showing that traveling hippocampal theta waves propagate in a spatially consistent manner that is optimal for phase coding.
Because our work used data from clinical depth electrodes, we were not able to measure theta phase across the layers of the hippocampus with the precision of the microelectrodes used in animal studies (Brankack et al., 1993; Lubenov and Siapas, 2009; Patel et al., 2012). Therefore, despite our best efforts to rule out the effects of intrahippocampal location on traveling waves (see Results), there is nonetheless a possibility that aspects of our findings were affected by layer-specific phase shifts. Further probing the electrophysiology of the human hippocampus with more precise recordings is an important area of future work that could improve our understanding of these patterns.
Unlike hippocampal theta in rodents, which appears at ∼8 Hz, a distinctive feature of human theta oscillations is that they are present at a broad range of frequencies from ∼1 to 10 Hz (Jacobs, 2014). This variation allowed us to measure the relation between theta's frequency and its other attributes. We found a positive correlation between theta frequency and propagation speed (Fig. 4), which supports the CO model of traveling wave propagation (Ermentrout and Kleinfeld, 2001; Lubenov and Siapas, 2009). The CO model suggests that there are a series of local theta oscillators along the length of the hippocampus. We hypothesize that theta oscillations begin at the septal end of the hippocampus (posterior in humans, dorsal in rodents) and travel in a temporal (anterior in humans, ventral in rodents) direction because of weak phase coupling between the local oscillators arranged along the length of the hippocampus (Fig. 6B). Because the propagation in this model is driven by phase differences rather than time delays, this causes oscillations to propagate through space at a rate that correlates with oscillation's temporal frequency (Fig. 6D,F). The main alternative model of theta traveling waves is the SO model, which relies on a single source oscillator at the medial septum that connects to sites along the length of the hippocampus via a series of axons with fixed conduction delays (Fig. 6A). Because these conduction delays are fixed, SO wave propagation speeds would be constant regardless of frequency (Fig. 6C,E). Our findings support the CO model because we found that propagation speed was frequency dependent rather than constant.
Figure 6.
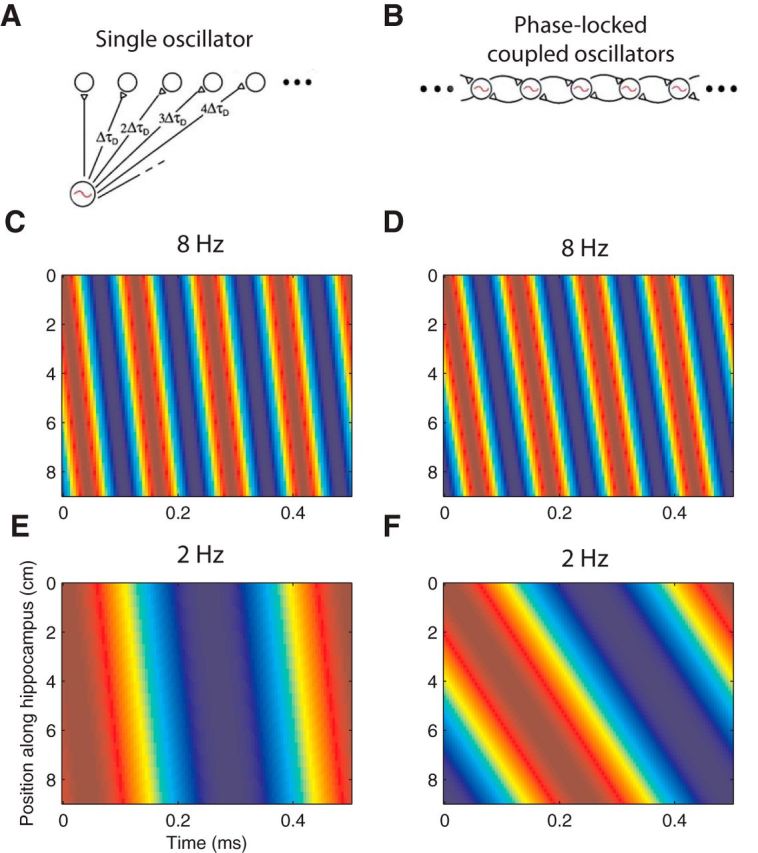
Models of traveling theta waves. A, Illustration of an SO model of theta traveling waves. According to this theory, there is a single theta oscillator in the medial septum, which has projections along the length of the hippocampus. Each projection's synaptic delay (xΔτD) is proportional to its length x, which produces the appearance of a traveling theta wave. B, CO model of theta propagation. According to this model, there are a series of weakly coupled theta oscillators along the length of the hippocampus. Each oscillator has a particular connection weight and an intrinsic frequency. This model predicts that traveling waves appear in the hippocampus when an oscillation begins in the medial septum and gradually propagate through the hippocampus via a series of COs. Figures in A and B were obtained and modified with permission from Ermentrout and Kleinfeld (2001). C, Spatial propagation of a traveling theta wave at 8 Hz following an SO model. Plot indicates theta phase as a color plotted as a function of position along hippocampus and time. D, Spatial propagation of a traveling theta wave at 8 Hz following the CO model. E, Spatial propagation of a 2 Hz traveling theta wave following the SO model. Here, the speed of propagation (slope of colored lines) is the same as C, demonstrating that speed is not frequency dependent. F, Spatial propagation of a 2 Hz traveling theta wave following the CO model. Slope changes compared with D demonstrate a change in the speed of theta's propagation.
The CO model is not only important for understanding how theta oscillations propagate, but it also has implications for explaining how hippocampal neurons encode information. The existence of traveling waves indicates that parts of the hippocampus simultaneously represent different theta phases. The propagation of these waves based on COs indicates that phase differences across the hippocampus are precisely coordinated. There are constant phases between the oscillations that appear at particular positions along the hippocampus (Fig. 7, right). This pattern means that an individual neuron can maintain synchrony with cells at other positions along the length of the hippocampus while monitoring only its local theta phase. Many models of hippocampal processing are based on the synchronous activation of assemblies of neurons (Harris et al., 2003). Spatial phase patterns from CO traveling waves could provide a straightforward mechanism for these assemblies to be synchronized. SO models of traveling waves could not support such patterns because they do not provide a consistent spatial phase distribution across different frequencies (Fig. 7, left).
Figure 7.
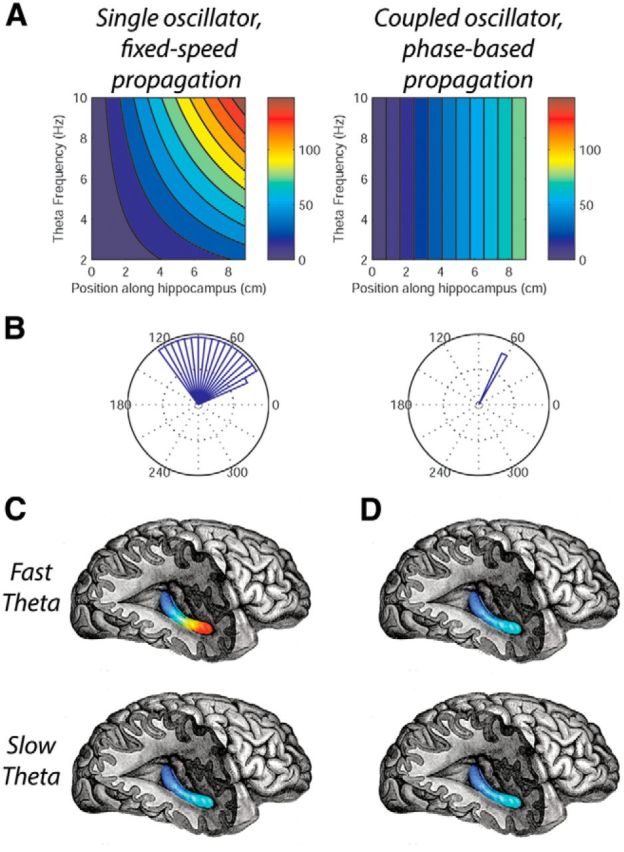
Models of hippocampal traveling waves predict different patterns of phase propagation. A, Depiction of how the theta phase varies through the hippocampus as a function of position (horizontal axis) and theta's temporal frequency (vertical axis). Left, Theta-phase propagation under an SO model, in which oscillations move at a fixed speed. Right, Theta-phase propagation based on a series of COs in which the wave propagates based on phase delays. B, Circular histograms indicating the relative phase differences between two locations along the length of the hippocampus for theta oscillations with various temporal frequencies. Relative phase differences remain constant regardless of theta frequency for the CO model (right), but not for the SO model (left). C, Graphical illustration of theta phase across the hippocampus for the SO model. Color indicates the oscillation's instantaneous phase at each location for fast (top) and slow (bottom) theta oscillations. By comparing these plots across fast and slow theta, it shows that the phase spread under the SO model is frequency dependent. D, Theta-phase spread under the CO model for fast and slow theta oscillations showing a constant rate of phase spread.
A number of studies pointed out the potential importance of theta oscillations for facilitating phase-based encoding of behavioral information. Place cells use theta-phase coding to represent an animal's spatial location in a manner that extends beyond rate-based coding (O'Keefe and Recce, 1993; Jensen and Lisman, 2000; Huxter et al., 2003). Later studies suggested that theta oscillations also underlie a possibly related phenomenon, in which hippocampal neurons use theta-phase coding to signal the timing of events (Jensen and Lisman, 1996; Dragoi and Buzsáki, 2006; Lubenov and Siapas, 2009). In this theory (Lubenov and Siapas, 2009), when a theta wave propagates along the length of the hippocampus, it causes individual neurons to experience a sequence of theta phases. Given the hypothesized link between theta phase and the neural representation of time, the continuous progression of phase at each location causes individual neurons to sequentially represent information related to future, present, and past events. Following this idea, it suggests that a spatially distributed assembly of neurons could represent the relations between events at different times by each individual cell spiking at separate local theta phases.
The septal–temporal axis of the hippocampus is important because it explains variations in how individual neurons encode information. As one moves along the hippocampus in the septal–temporal direction, there is a continuous increase in the size of a place cell's place field (Jung et al., 1994; Kjelstrup et al., 2008). This variation in neuronal coding is likely to interact with traveling waves. Specifically, traveling waves will cause place cells to activate in order of increasing field size: septal cells with small place fields activate first, followed by temporal place cells with larger place fields. This suggests that the hippocampus first represents specific information about the current location and later, as theta moves through space, it represents coarser spatial information. This temporal variation in the precision of hippocampal representation could be important more broadly beyond place cells because hippocampal neurons are known to exhibit a range of behavioral information (Eichenbaum, 1996; Quiroga et al., 2005; Komorowski et al., 2013). Therefore, one open question is whether the hippocampal cells that represent nonspatial information also exhibit other analogous septal–temporal variations in information coding, which could interact with traveling waves.
Compared with rodents, human hippocampal theta oscillations are challenging to measure because they are smaller in amplitude, slower in frequency, and more variable (Vanderwolf, 1969; Halgren et al., 1978; Watrous et al., 2011; Jacobs, 2014). These factors may have contributed to our not observing theta traveling waves in every patient. Nonetheless, we believe that two features of our analyses made it possible for us to identify reliable human theta oscillations in many patients that were akin to signals in rodents. First, we used a peak-picking method in which we only analyzed signals at frequencies with peaks above the 1/f background spectrum. Second, we focused on oscillations that appeared on multiple electrodes. This targeted approach allowed us to focus on the strongest theta signals, which exhibited traveling waves as in rodents. A complication is that the amplitude of human theta oscillations varies dramatically with ongoing behavioral events (Sederberg et al., 2007b; Watrous et al., 2013b). A further possibility is that, at any moment, the human hippocampus could simultaneously exhibit multiple patterns of theta oscillations from separate sources that are phase shifted (Agarwal et al., 2014) or independent (Raghavachari et al., 2006; Sirota et al., 2008). These multiple theta oscillations could be difficult to observe from the clinical macroelectrodes used in epilepsy patients, which only measure the single theta oscillation that is visible in the aggregate local field potential.
Perhaps the most intriguing aspect of the theta oscillation is that it is thought to coordinate brain-wide neuronal assemblies linking hippocampus and neocortex (Miller, 1991; Buzsáki, 2006; Sirota et al., 2008). The fact that theta oscillations are traveling waves has key implications for understanding how this linking occurs. Connectivity to the neocortex varies along the length of the hippocampus (Cenquizca and Swanson, 2007). As theta propagates, the greatest level of neuronal excitation appears at the position in the hippocampus that exhibits the theta trough (Buzsáki, 2005; Lubenov and Siapas, 2009). These factors indicate that, at any given moment, the hippocampus is preferentially sensitive to a particular neocortical input. Therefore, traveling theta waves may provide a sort of neural “searchlight” that allows the hippocampus to separately consider different neocortical inputs in sequence. In this way, traveling theta waves could explain how the hippocampus organizes information from a broad range of neocortical networks. To understand theta's role in aggregating brain-wide signals, one important next step is to elucidate the relation between neuronal activity in neocortical networks relative to the hippocampal theta wave. In humans, there is evidence that hippocampal theta oscillations have a different frequency compared with neocortex (Jacobs et al., 2007), which suggests there may not be a straightforward pattern of one-to-one phase coupling between neocortex and hippocampus. Uncoupling the cortical correlates of hippocampal traveling waves is a challenging but critical next step toward understanding the role of the hippocampus in modulating brain-wide networks.
Footnotes
This work was supported by the National Institutes of Health (Grant MH061975), the Defense Advanced Research Projects Agency, and the Brain and Behavior Research Foundation. We thank John Burke for help with data processing and Michael Kahana, Andreas Schulze-Bonhage, and Armin Brandt for contributing data.
The authors declare no competing financial interests.
References
- Agarwal G, Stevenson IH, Berényi A, Mizuseki K, Buzsáki G, Sommer FT. Spatially distributed local fields in the hippocampus encode rat position. Science. 2014;344:626–630. doi: 10.1126/science.1250444. [DOI] [PMC free article] [PubMed] [Google Scholar]
- Alexander DM, Jurica P, Trengove C, Nikolaev AR, Gepshtein S, Zvyagintsev M, Mathiak K, Schulze-Bonhage A, Ruescher J, Ball T, van Leeuwen C. Traveling waves and trial averaging: The nature of single-trial and averaged brain responses in large-scale cortical signals. Neuroimage. 2013;73:95–112. doi: 10.1016/j.neuroimage.2013.01.016. [DOI] [PubMed] [Google Scholar]
- Arnolds DE, Lopes da Silva FH, Aitink JW, Kamp A, Boeijinga P. The spectral properties of hippocampal EEG related to behaviour in man. Electroencephalogr Clin Neurophysiol. 1980;50:324–328. doi: 10.1016/0013-4694(80)90160-1. [DOI] [PubMed] [Google Scholar]
- Bahramisharif A, van Gerven MA, Aarnoutse EJ, Mercier MR, Schwartz TH, Foxe JJ, Ramsey NF, Jensen O. Propagating neocortical gamma bursts are coordinated by traveling alpha waves. J Neurosci. 2013;33:18849–18854. doi: 10.1523/JNEUROSCI.2455-13.2013. [DOI] [PMC free article] [PubMed] [Google Scholar]
- Brankack J, Stewart M, Fox SE. Current source density analysis of the hippocampal theta rhythm: associated sustained potentials and candidate synaptic generators. Brain Res. 1993;615:310–327. doi: 10.1016/0006-8993(93)90043-M. [DOI] [PubMed] [Google Scholar]
- Buzsáki G. The hippocampo-neocortical dialogue. Neocortex. 1996;6:81–92. doi: 10.1093/cercor/6.2.81. [DOI] [PubMed] [Google Scholar]
- Buzsáki G. Theta oscillations in the hippocampus. Neuron. 2002;33:325–340. doi: 10.1016/S0896-6273(02)00586-X. [DOI] [PubMed] [Google Scholar]
- Buzsáki G. Theta rhythm of navigation: Link between path integration and landmark navigation, episodic and semantic memory. Hippocampus. 2005;15:827–840. doi: 10.1002/hipo.20113. [DOI] [PubMed] [Google Scholar]
- Buzsáki G. Rhythms of the brain. New York: OUP; 2006. [Google Scholar]
- Cenquizca LA, Swanson LW. Spatial organization of direct hippocampal field ca1 axonal projections to the rest of the cerebral cortex. Brain Res Rev. 2007;56:1–26. doi: 10.1016/j.brainresrev.2007.05.002. [DOI] [PMC free article] [PubMed] [Google Scholar]
- de Munck JC, Gonçalves SI, Huijboom L, Kuijer JP, Pouwels PJ, Heethaar RM, Lopes da Silva FH. The hemodynamic response of the alpha rhythm: an eeg/fmri study. Neuroimage. 2007;35:1142–1151. doi: 10.1016/j.neuroimage.2007.01.022. [DOI] [PubMed] [Google Scholar]
- Dragoi G, Buzsáki G. Temporal encoding of place sequences by hippocampal cell assemblies. Neuron. 2006;50:145–157. doi: 10.1016/j.neuron.2006.02.023. [DOI] [PubMed] [Google Scholar]
- Duvernoy HM. The human hippocampus: functional anatomy, vascularization and serial sections with MRI. Berlin: Springer-Verlag; 2005. [Google Scholar]
- Eichenbaum H. Is the rodent hippocampus just for place? Curr Opin Neurobiol. 1996;6:187–195. doi: 10.1016/S0959-4388(96)80072-9. [DOI] [PubMed] [Google Scholar]
- Ekstrom AD, Caplan JB, Ho E, Shattuck K, Fried I, Kahana MJ. Human hippocampal theta activity during virtual navigation. Hippocampus. 2005;15:881–889. doi: 10.1002/hipo.20109. [DOI] [PubMed] [Google Scholar]
- Ermentrout G, Kleinfeld D. Traveling electrical waves in cortex insights from phase dynamics and speculation on a computational role. Neuron. 2001;29:33–44. doi: 10.1016/S0896-6273(01)00178-7. [DOI] [PubMed] [Google Scholar]
- Fisher NI. Statistical analysis of circular data. Cambridge: Cambridge University; 1993. [Google Scholar]
- Freeman WJ. Origin, structure, and role of background EEG activity. part 1. analytic amplitude. Clin Neurophysiol. 2004;115:2077–2088. doi: 10.1016/j.clinph.2004.02.029. [DOI] [PubMed] [Google Scholar]
- Freeman W. Hilbert transform for brain waves. Scholarpedia. 2007;2:1338. doi: 10.4249/scholarpedia.1338. [DOI] [Google Scholar]
- Halgren E, Babb TL, Crandall PH. Human hippocampal formation EEG desynchronizes during attentiveness and movement. Electroencephalogr Clin Neurophysiol. 1978;44:778–781. doi: 10.1016/0013-4694(78)90212-2. [DOI] [PubMed] [Google Scholar]
- Harris KD, Csicsvari J, Hirase H, Dragoi G, Buzsáki G. Organization of cell assemblies in the hippocampus. Nature. 2003;424:552–556. doi: 10.1038/nature01834. [DOI] [PubMed] [Google Scholar]
- Hasselmo ME, Bodelón C, Wyble BP. A proposed function for hippocampal theta rhythm: separate phases of encoding and retrieval enhance reversal of prior learning. Neural Comput. 2002;14:793–817. doi: 10.1162/089976602317318965. [DOI] [PubMed] [Google Scholar]
- Huerta PT, Lisman JE. Heightened synaptic plasticity of hippocampal CA1 neurons during a cholinergically induced rhythmic state. Nature. 1993;364:723–725. doi: 10.1038/364723a0. [DOI] [PubMed] [Google Scholar]
- Hughes AM, Whitten TA, Caplan JB, Dickson CT. Bosc: A better oscillation detection method, extracts both sustained and transient rhythms from rat hippocampal recordings. Hippocampus. 2012;22:1417–1428. doi: 10.1002/hipo.20979. [DOI] [PubMed] [Google Scholar]
- Huxter J, Burgess N, O'Keefe J. Independent rate and temporal coding in hippocampal pyramidal cells. Nature. 2003;425:828–832. doi: 10.1038/nature02058. [DOI] [PMC free article] [PubMed] [Google Scholar]
- Insausti R, Amaral DG. Hippocampal formation. Hum Nervous Sys. 2004:871–914. [Google Scholar]
- Jacobs J. Hippocampal theta oscillations are slower in humans than in rodents: implications for models of spatial navigation and memory. Philos Trans R Soc Lond B Biol Sci. 2014;369:304. doi: 10.1098/rstb.2013.0304. [DOI] [PMC free article] [PubMed] [Google Scholar]
- Jacobs J, Kahana MJ, Ekstrom AD, Fried I. Brain oscillations control timing of single-neuron activity in humans. J Neurosci. 2007;27:3839–3844. doi: 10.1523/JNEUROSCI.4636-06.2007. [DOI] [PMC free article] [PubMed] [Google Scholar]
- Jacobs J, Kahana MJ. Neural representations of individual stimuli in humans revealed by gamma-band ECoG activity. J Neurosci. 2009;29:10203–10214. doi: 10.1523/JNEUROSCI.2187-09.2009. [DOI] [PMC free article] [PubMed] [Google Scholar]
- Jacobs J, Kahana MJ. Direct brain recordings fuel advances in cognitive electrophysiology. Trends Cogn Sci. 2010;14:162–171. doi: 10.1016/j.tics.2010.01.005. [DOI] [PMC free article] [PubMed] [Google Scholar]
- Jensen O, Lisman JE. Hippocampal CA3 region predicts memory sequences: accounting for the phase precession of place cells. Learn Mem. 1996;3:279–287. doi: 10.1101/lm.3.2-3.279. [DOI] [PubMed] [Google Scholar]
- Jensen O, Lisman JE. Position reconstruction from an ensemble of hippocampal place cells: contribution of theta phase coding. J Neurophysiol. 2000;83:2602–2609. doi: 10.1152/jn.2000.83.5.2602. [DOI] [PubMed] [Google Scholar]
- Jung MW, Wiener SI, McNaughton BL. Comparison of spatial firing characteristics of units in dorsal and ventral hippocampus of the rat. J Neurosci. 1994;14:7347–7356. doi: 10.1523/JNEUROSCI.14-12-07347.1994. [DOI] [PMC free article] [PubMed] [Google Scholar]
- Kjelstrup KB, Solstad T, Brun VH, Hafting T, Leutgeb S, Witter MP, Moser EI, Moser MB. Finite scale of spatial representation in the hippocampus. Science. 2008;321:140–143. doi: 10.1126/science.1157086. [DOI] [PubMed] [Google Scholar]
- Komorowski RW, Garcia CG, Wilson A, Hattori S, Howard MW, Eichenbaum H. Ventral hippocampal neurons are shaped by experience to represent behaviorally relevant contexts. J Neurosci. 2013;33:8079–8087. doi: 10.1523/JNEUROSCI.5458-12.2013. [DOI] [PMC free article] [PubMed] [Google Scholar]
- Lega BC, Jacobs J, Kahana M. Human hippocampal theta oscillations and the formation of episodic memories. Hippocampus. 2012;22:748–761. doi: 10.1002/hipo.20937. [DOI] [PubMed] [Google Scholar]
- Lubenov EV, Siapas AG. Hippocampal theta oscillations are travelling waves. Nature. 2009;459:534–539. doi: 10.1038/nature08010. [DOI] [PubMed] [Google Scholar]
- Manning JR, Jacobs J, Fried I, Kahana MJ. Broadband shifts in LFP power spectra are correlated with single-neuron spiking in humans. J Neurosci. 2009;29:13613–13620. doi: 10.1523/JNEUROSCI.2041-09.2009. [DOI] [PMC free article] [PubMed] [Google Scholar]
- Massimini M, Huber R, Ferrarelli F, Hill S, Tononi G. The sleep slow oscillation as a traveling wave. J Neurosci. 2004;24:6862–6870. doi: 10.1523/JNEUROSCI.1318-04.2004. [DOI] [PMC free article] [PubMed] [Google Scholar]
- Miller R. Cortico-hippocampal interplay and the representation of contexts in the brain. Berlin: Springer-Verlag; 1991. [Google Scholar]
- Miller KJ, Leuthardt EC, Schalk G, Rao RP, Anderson NR, Moran DW, Miller JW, Ojemann JG. Spectral changes in cortical surface potentials during motor movement. J Neurosci. 2007;27:2424–2432. doi: 10.1523/JNEUROSCI.3886-06.2007. [DOI] [PMC free article] [PubMed] [Google Scholar]
- O'Keefe J, Recce ML. Phase relationship between hippocampal place units and the EEG theta rhythm. Hippocampus. 1993;3:317–330. doi: 10.1002/hipo.450030307. [DOI] [PubMed] [Google Scholar]
- O'Keefe J, Burgess N. Theta activity, virtual navigation and the human hippocampus. Trends Cogn Sci. 1999;3:403–406. doi: 10.1016/S1364-6613(99)01396-0. [DOI] [PubMed] [Google Scholar]
- Patel J, Fujisawa S, Berényi A, Royer S, Buzsáki G. Traveling theta waves along the entire septotemporal axis of the hippocampus. Neuron. 2012;75:410–417. doi: 10.1016/j.neuron.2012.07.015. [DOI] [PMC free article] [PubMed] [Google Scholar]
- Patten TM, Rennie CJ, Robinson PA, Gong P. Human cortical traveling waves: dynamical properties and correlations with responses. PLoS One. 2012;7:e38392. doi: 10.1371/journal.pone.0038392. [DOI] [PMC free article] [PubMed] [Google Scholar]
- Pavlides C, Greenstein YJ, Grudman M, Winson J. Long-term potentiation in the dentate gyrus is induced preferentially on the positive phase of theta-rhythm. Brain Res. 1988;439:383–387. doi: 10.1016/0006-8993(88)91499-0. [DOI] [PubMed] [Google Scholar]
- Quiroga RQ, Reddy L, Kreiman G, Koch C, Fried I. Invariant visual representation by single neurons in the human brain. Nature. 2005;435:1102–1107. doi: 10.1038/nature03687. [DOI] [PubMed] [Google Scholar]
- Raghavachari S, Lisman JE, Tully M, Madsen JR, Bromfield EB, Kahana MJ. Theta oscillations in human cortex during a working memory task: Evidence for local generators. J Neurophysiol. 2006;95:1630–1638. doi: 10.1152/jn.00409.2005. [DOI] [PubMed] [Google Scholar]
- Rao BN, Rao KP, Rao RR. Morphometric study of hippocampus in adult human brains. Int J Appl Basic Med Res. 2012;2:139–143. [Google Scholar]
- Seager MA, Johnson LD, Chabot ES, Asaka Y, Berry SD. Oscillatory brain states and learning: Impact of hippocampal theta-contingent training. Proc Natl Acad Sci U S A. 2002;99:1616–1620. doi: 10.1073/pnas.032662099. [DOI] [PMC free article] [PubMed] [Google Scholar]
- Sederberg PB, Schulze-Bonhage A, Madsen JR, Bromfield EB, Litt B, Brandt A, Kahana MJ. Gamma oscillations distinguish true from false memories. Psychol Sci. 2007a;18:927–932. doi: 10.1111/j.1467-9280.2007.02003.x. [DOI] [PMC free article] [PubMed] [Google Scholar]
- Sederberg PB, Schulze-Bonhage A, Madsen JR, Bromfield EB, McCarthy DC, Brandt A, Tully MS, Kahana MJ. Hippocampal and neocortical gamma oscillations predict memory formation in humans. Cereb Cortex. 2007b;17:1190–1196. doi: 10.1093/cercor/bhl030. [DOI] [PubMed] [Google Scholar]
- Siapas AG, Lubenov EV, Wilson MA. Prefrontal phase locking to hippocampal theta oscillations. Neuron. 2005;46:141–151. doi: 10.1016/j.neuron.2005.02.028. [DOI] [PubMed] [Google Scholar]
- Sirota A, Montgomery S, Fujisawa S, Isomura Y, Zugaro M, Buzsáki G. Entrainment of neocortical neurons and gamma oscillations by the hippocampal theta rhythm. Neuron. 2008;60:683–697. doi: 10.1016/j.neuron.2008.09.014. [DOI] [PMC free article] [PubMed] [Google Scholar]
- Stewart M, Fox SE. Do septal neurons pace the hippocampal theta rhythm? Trends Neurosci. 1990;13:163–168. doi: 10.1016/0166-2236(90)90040-H. [DOI] [PubMed] [Google Scholar]
- Strange BA, Witter MP, Lein ES, Moser EI. Functional organization of the hippocampal longitudinal axis. Nat Rev Neurosci. 2014;15:655–669. doi: 10.1038/nrn3785. [DOI] [PubMed] [Google Scholar]
- Talairach J, Tournoux P. Co-planar stereotaxic atlas of the human brain. Stuttgart: Verlag; 1988. [Google Scholar]
- van der Meij R, Kahana M, Maris E. Phase-amplitude coupling in human ECoG is spatially distributed and phase diverse. J Neurosci. 2012;32:111–123. doi: 10.1523/JNEUROSCI.4816-11.2012. [DOI] [PMC free article] [PubMed] [Google Scholar]
- van Gerven M, Maris E, Sperling M, Sharan A, Litt B, Anderson C, Jacobs J. Multivariate encoding of letter representations from ECoG signals. Neuroimage. 2013;70:223–232. doi: 10.1016/j.neuroimage.2012.12.059. [DOI] [PMC free article] [PubMed] [Google Scholar]
- Vanderwolf CH. Hippocampal electrical activity and voluntary movement of the rat. Electroencephalogr Clin Neurophysiol. 1969;26:407–418. doi: 10.1016/0013-4694(69)90092-3. [DOI] [PubMed] [Google Scholar]
- Watrous AJ, Fried I, Ekstrom AD. Behavioral correlates of human hippocampal delta and theta oscillations during navigation. J Neurophysiol. 2011;105:1747–1755. doi: 10.1152/jn.00921.2010. [DOI] [PubMed] [Google Scholar]
- Watrous AJ, Lee DJ, Izadi A, Gurkoff GG, Shahlaie K, Ekstrom AD. A comparative study of human and rat hippocampal low-frequency oscillations during spatial navigation. Hippocampus. 2013a;23:656–661. doi: 10.1002/hipo.22124. [DOI] [PMC free article] [PubMed] [Google Scholar]
- Watrous AJ, Tandon N, Conner CR, Pieters T, Ekstrom AD. Frequency-specific network connectivity increases underlie accurate spatiotemporal memory retrieval. Nat Neurosci. 2013b;16:349–356. doi: 10.1038/nn.3315. [DOI] [PMC free article] [PubMed] [Google Scholar]
- Winson J. Loss of hippocampal theta rhythms in spatial memory deficit in the rat. Science. 1978;201:160–163. doi: 10.1126/science.663646. [DOI] [PubMed] [Google Scholar]