Abstract
BACKGROUND. TGF-β has potent profibrotic activity in vitro and has long been implicated in systemic sclerosis (SSc), as expression of TGF-β–regulated genes is increased in the skin and lungs of patients with SSc. Therefore, inhibition of TGF-β may benefit these patients.
METHODS. Patients with early, diffuse cutaneous SSc were enrolled in an open-label trial of fresolimumab, a high-affinity neutralizing antibody that targets all 3 TGF-β isoforms. Seven patients received two 1 mg/kg doses of fresolimumab, and eight patients received one 5 mg/kg dose of fresolimumab. Serial mid-forearm skin biopsies, performed before and after treatment, were analyzed for expression of the TGF-β–regulated biomarker genes thrombospondin-1 (THBS1) and cartilage oligomeric protein (COMP) and stained for myofibroblasts. Clinical skin disease was assessed using the modified Rodnan skin score (MRSS).
RESULTS. In patient skin, THBS1 expression rapidly declined after fresolimumab treatment in both groups (P = 0.0313 at 7 weeks and P = 0.0156 at 3 weeks), and skin expression of COMP exhibited a strong downward trend in both groups. Clinical skin disease dramatically and rapidly decreased (P < 0.001 at all time points). Expression levels of other TGF-β–regulated genes, including SERPINE1 and CTGF, declined (P = 0.049 and P = 0.012, respectively), and a 2-gene, longitudinal pharmacodynamic biomarker of SSc skin disease decreased after fresolimumab treatment (P = 0.0067). Dermal myofibroblast infiltration also declined in patient skin after fresolimumab (P < 0.05). Baseline levels of THBS1 were predictive of reduced THBS1 expression and improved MRSS after fresolimumab treatment.
CONCLUSION. The rapid inhibition of TGF-β–regulated gene expression in response to fresolimumab strongly implicates TGF-β in the pathogenesis of fibrosis in SSc. Parallel improvement in the MRSS indicates that fresolimumab rapidly reverses markers of skin fibrosis.
TRIAL REGISTRATION. Clinicaltrials.gov NCT01284322.
FUNDING. This study was supported by the Boston University Clinical and Translational Science Institute, the NIH’s National Center for Advancing Translational Sciences Clinical and Translational Sciences, the National Institute of Arthritis Musculoskeletal and Skin Disease: Scleroderma Core Centers and Scleroderma Center of Research Translation, the Boston University Medical Campus Microarray Core, the Kellen Foundation at Hospital for Special Surgery, the Scleroderma Research Foundation, the Dr. Ralph and Marian Falk Medical Research Trust, and Novartis.
Introduction
Soon after its discovery as a transforming growth factor, TGF-β was recognized to have potent profibrotic activity (1, 2). TGF-β promotes collagen synthesis, secretion, processing, and cross-linking (3) as well as secretion of other matrix molecules, such as fibronectin and thrombospondin (4). All 3 TGF-β isotypes (TGF-β1, TGF-β2, and TGF-β3) interact with the same receptor complex and have wide-ranging, context-specific effects on cell proliferation and differentiation, embryological processes, and the immune system (5).
Fibrosis in patients with systemic sclerosis (SSc) affects the skin in addition to internal organs: lungs, heart, and gastrointestinal tract (6). It represents a major unmet therapeutic challenge, as treatment for SSc fibrotic disease is currently limited to cyclophosphamide, which has modest effects (7); immunoablation and stem cell transplant offer a more dramatic benefit, which is associated with significant treatment-associated morbidity and mortality (8). Further, fibrosis is an end-stage process in many diseases, including many common diseases, such as liver cirrhosis complicating viral or drug-induced hepatitis, renal fibrosis as the pathological feature leading to many forms of end-stage renal disease, cardiac fibrosis after myocardial infarctions and associated with hypertension, and pulmonary fibrosis, either idiopathic or associated with a variety of other diseases or environmental exposures (9). Although skin disease in SSc does not cause death, extensive skin disease is associated with considerable morbidity and severity of internal organ disease as well as disease-associated mortality (10). In addition, skin fibrosis shares pathogenic features with fibrotic disease at other sites in patients with SSc, suggesting that agents successfully treating skin might show efficacy for other involved organs (11). As skin can be easily biopsied, it provides a window into understanding pathogenesis and also a methodology for assessing response of a target organ.
Several factors have slowed development of therapeutics targeting fibrosis in SSc. The variable trajectory of disease progression in different organs in patients with SSc has led to particular challenges in identifying efficacy in early-phase clinical trials; this has included slow rates of progression of interstitial lung disease (12) and spontaneous improvement of skin disease (13). In addition, the relatively slow rate of change in skin disease, as assessed by the main clinical outcome, the modified Rodnan skin score (MRSS), and the relative insensitivity of the MRSS to change has led to the notion that changes in the MRSS require long periods of observation to detect. The clinical heterogeneity of the disease and years-long progression have made it difficult to demonstrate efficacy in large, placebo-controlled, 12- to 24-month clinical trials in Ssc, even in the early phase of clinical development (14), presenting a significant obstacle for discovering effective therapies for SSc.
Biomarkers that correlate with the MRSS might act as surrogate outcome measures for the degree of skin disease in patients with SSc and thus provide an approach for more quickly detecting potential drug efficacy in early-phase SSc clinical trials. Biomarkers can be measured objectively and might be expected to change more quickly than clinical outcome measures such as the MRSS. We previously described a 4-gene, pharmacodynamic biomarker of SSc skin disease, based on gene expression in a mid-forearm skin biopsy (15). Two of the four genes making up the biomarker, thrombospondin-1 (THBS1) and cartilage oligomeric protein (COMP), are highly regulated by TGF-β. Thus, to test the importance of TGF-β in SSc skin fibrosis as well as to test a biomarker-based approach to early-phase clinical trial design, we treated patients with early, diffuse SSc with fresolimumab, a first-in-class human IgG4 κ monoclonal antibody capable of neutralizing all mammalian isoforms of TGF-β. The predefined primary efficacy outcome for this trial was change in COMP and THBS1 mRNA expression in skin after treatment compared with that at baseline.
Results
Patients.
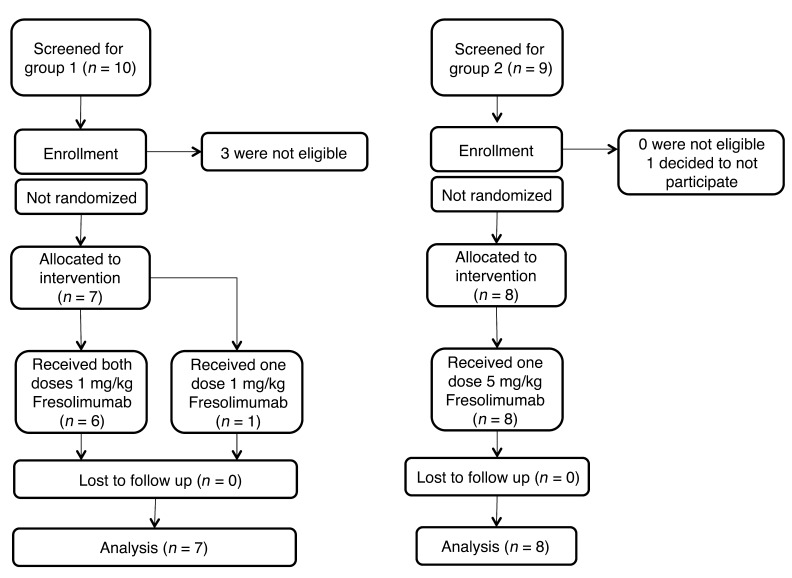
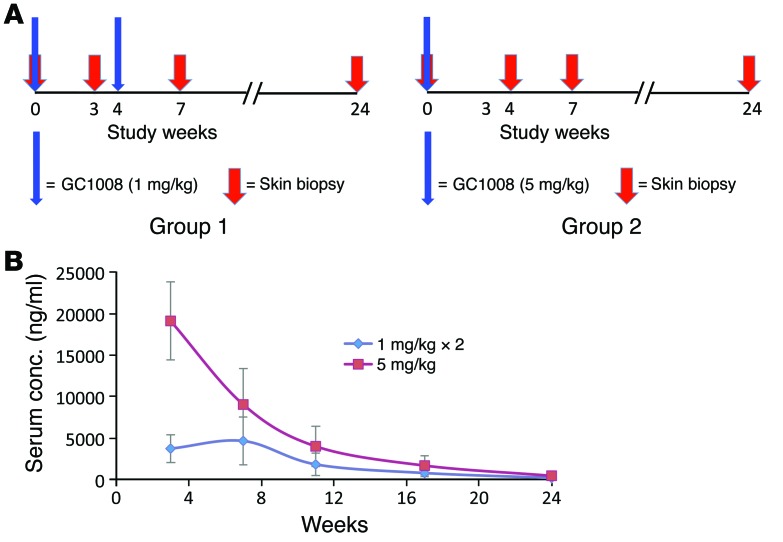
Patients were mostly female, with a median age of 51 years and median MRSS of 24 (Table 1). Only one patient showed signs of interstitial lung disease, with a median forced vital capacity of 90% predicted. Four patients (27%) had anti-Scl70 autoantibodies, and eight patients (53%) had anti–RNA polymerase (anti-Pol3) III autoantibodies. Anti-Pol3 autoantibodies are typically seen in only about 11% of all patients with SSc (16) but are much more common in patients with diffuse cutaneous disease (17). Since anti-Pol3 autoantibodies are associated with more severe skin disease and less severe interstitial lung disease (17), our entry criteria, which included only patients with diffuse cutaneous disease and excluded patients with significant lung disease, likely enriched for patients with this autoantibody specificity. Two groups of patients were treated with fresolimumab: the first group (group 1, n = 7) was treated with 2 doses of 1 mg/kg fresolimumab 4 weeks apart, and the second group (group 2, n = 8) was treated with 1 dose of 5 mg/kg fresolimumab (Figure 1 and Figure 2A). Skin biopsies were performed at baseline (the day of first infusion) and at 3 weeks (group 1) or 4 weeks (group 2), 7 weeks, and 24 weeks after the baseline biopsy (Figure 2A).
Table 1. Baseline demographic and clinical characteristics of study patients (n = 15).
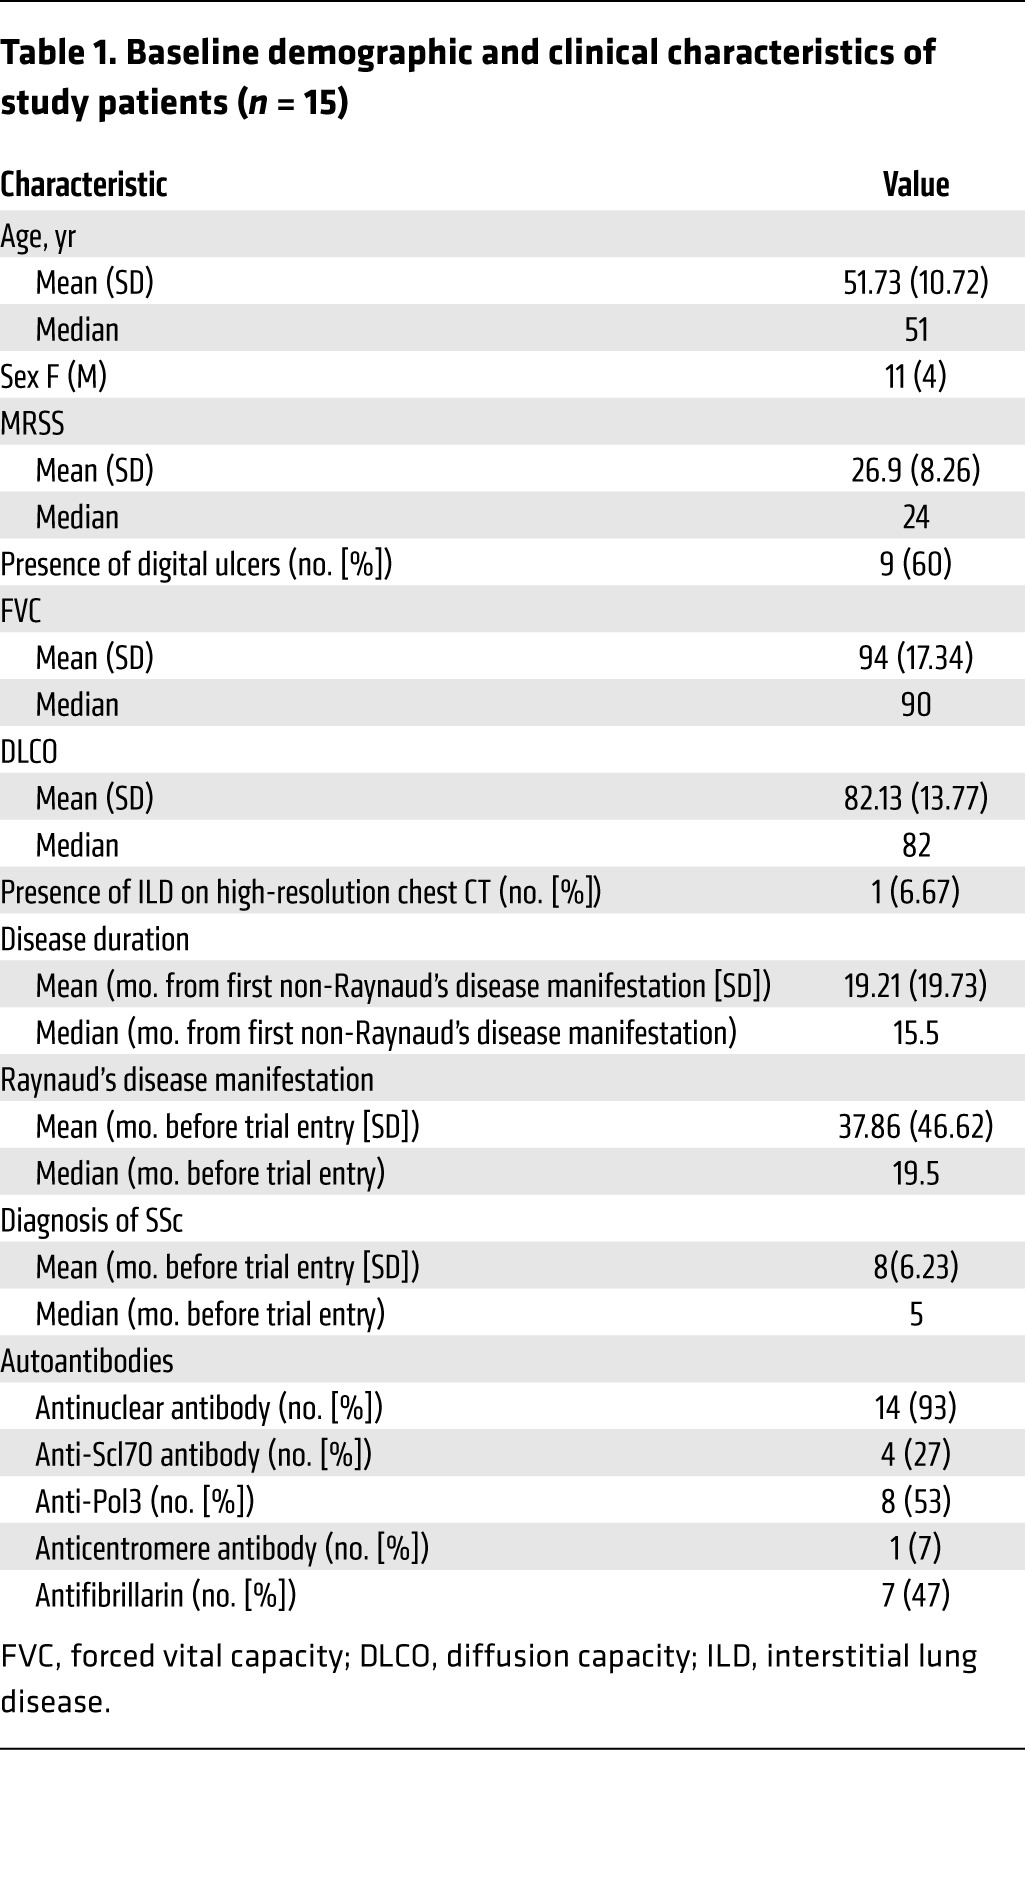
Figure 1. CONSORT flow diagram.
Schematic of patient screening, enrollment, and completion of the trial in the two study groups.
Figure 2. Study design and pharmacokinetics of fresolimumab in two dosing groups.
(A) Trial protocol for each group shows dosing levels and frequency and timing of skin biopsies. Red arrows indicate skin biopsies. (B) Fresolimumab levels measured in sera at 3, 7, 11, 17, and 24 weeks in group 1, which received 2 doses of 1 mg/kg at weeks 0 and 4 (blue diamonds), and group 2, which received a single dose of 5 mg/kg fresolimumab at week 0 (red squares). Error bars indicate SD.
Skin biomarker gene expression of THBS1 shows a rapid decline after fresolimumab treatment.
The 2 groups of patients showed dramatically different serum levels of fresolimumab, with group 2 reaching approximately 5 times higher serum levels 3 weeks after treatment than group 1 (Figure 2B). Even after the first group of patients received a second 1 mg/kg dose of study medication, the relative levels of circulating fresolimumab were nearly twice as high in the second group (receiving a single 5 mg/kg dose) at 7 weeks and subsequent time points due to the circulating half-life of approximately 22 days.
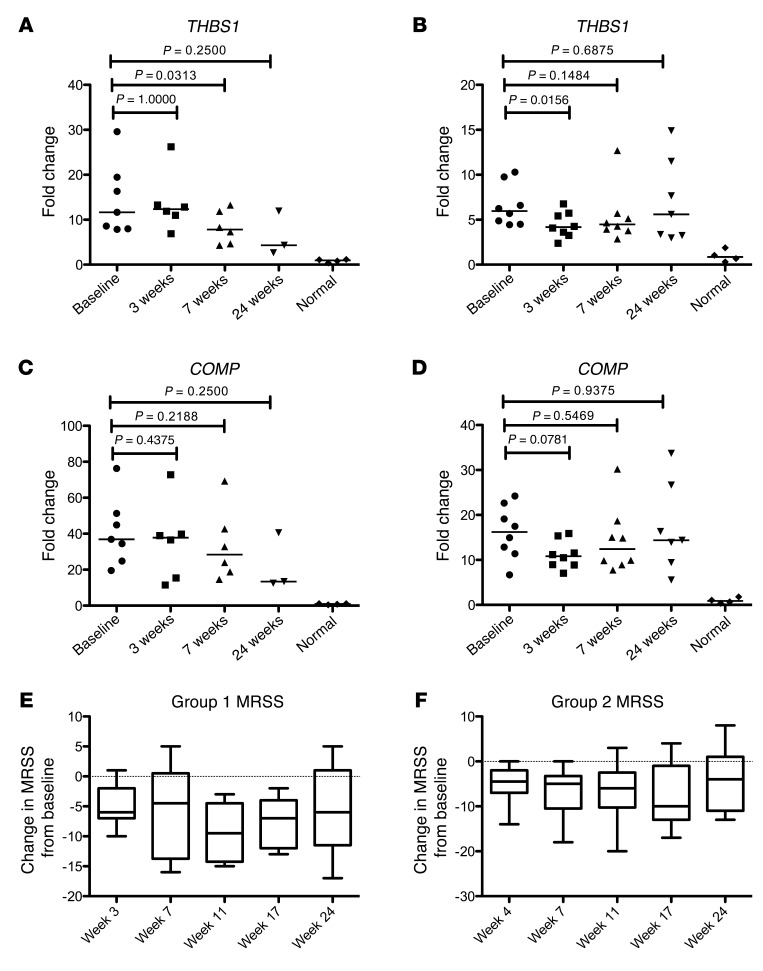
Both treatment groups separately showed rapid declines in THBS1 and COMP gene expression, the primary efficacy outcome measure (Figure 3, A–D, and Supplemental Table 1A; supplemental material available online with this article; doi:10.1172/JCI77958DS1). Patients in the first dosing group showed a significant decline in median THBS1 expression (67.2% of baseline) at 7 weeks compared with that at baseline (P = 0.0313, Figure 3A and Supplemental Figure 1A), and a trend toward decreased COMP expression (77.1% of baseline) (P = 0.218, Figure 3C and Supplemental Figure 1C). Patients in the second dosing group showed a more rapid decrease in THBS1 (70.0% of baseline; P = 0.0156, Figure 3B and Supplemental Figure 1B) and COMP (66.7% of baseline; P = 0.0781, Figure 3D and Supplemental Figure 1D), which reached a nadir at week 3. Decreases in gene expression seen at weeks 3 or 4 and week 7 were lost at week 24 (Figure 3, A–D), a time when circulating fresolimumab was mostly metabolized (Figure 2B). However, in the first dosing group, the loss of significant change at week 24 might reflect the fewer biopsies available for analysis.
Figure 3. Changes in biomarker gene expression and MRSS by study group.
(A and B) THBS1 and (C and D) COMP gene expression and (E and F) MRSS from study patients in (A, C, and E) group 1 (n = 7), which received 2 doses of 1 mg/kg fresolimumab, and (B, D, and F) group 2 (n = 8), which received 1 dose of 5 mg/kg fresolimumab. Dot plots show median (horizontal bars) and statistical significance of THBS1 and COMP gene expression (Wilcoxon signed-rank test, using available data). Box plots show median (horizontal line), interquartile (box), and 95% confidence limits (whiskers) of MRSS. Line graphs showing changes in individual patients over time are shown in Supplemental Figure 1.
Changes in gene expression in study patients generally correlated with changes in MRSS (compare Supplemental Figure 1, A and C with Supplemental Figure 1E and Supplemental Figure 1, B and D with Supplemental Figure 1F). Examining the correlation between the MRSS and biomarkers in all biopsies revealed a high correlation for THBS1 (r = 0.63) and COMP (r = 0.62) (data not shown), similar to correlations we reported previously between the MRSS and gene expression (15). Baseline THBS1 and COMP gene expression was strikingly higher in both SSc patient cohorts than in healthy control skin, as we have reported previously (Figure 3, A–D, and ref. 15). Median baseline values were higher in the first cohort (THBS1 = 11.63, COMP = 36.84) compared with those in the second cohort (THBS1 = 5.97, COMP = 16.20; Figure 3, A–D), as were median baseline MRSS values (25 and 22.5, respectively).
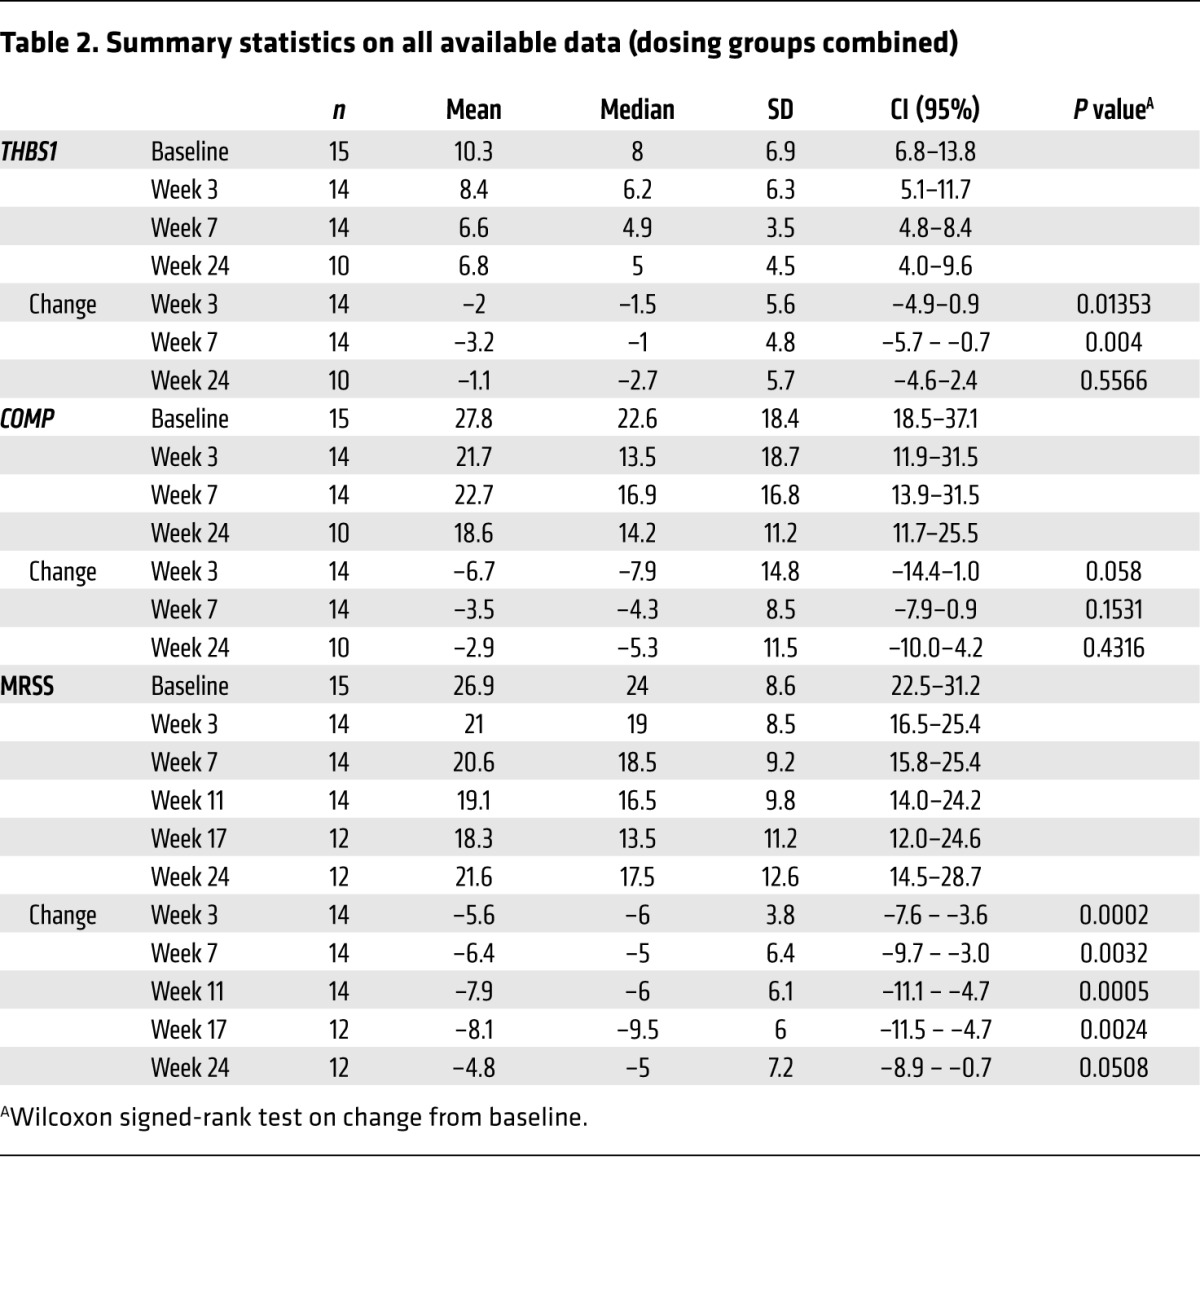
Summary statistics using all available data for patients entered into both treatment groups showed that THBS1 and COMP expression declined rapidly after fresolimumab treatment (Table 2). Gene expression results from skin biopsies following treatment in the first group at 3 weeks and in the second group at 4 weeks were combined for these analyses. Median THBS1 levels at week 3 or 4 were 77% of baseline, reaching a nadir at week 7 of 61% of baseline THBS1 expression. Median COMP levels at week 3 or 4 and week 7 were 60% and 75% of baseline COMP expression , respectively. Examining gene expression of evaluable, paired biopsies from both treatment groups, median THBS1 expression decreased by –1.5 (P = 0.0135) and –1 (P = 0.004) at week 3 or 4 and week 7, respectively (from baseline median of 8), and median COMP expression decreased by –7.9 (P = 0.058) and –4.3 (P = 0.153) at week 3 or 4 and week 7, respectively (from baseline median of 22.6).
Table 2. Summary statistics on all available data (dosing groups combined).
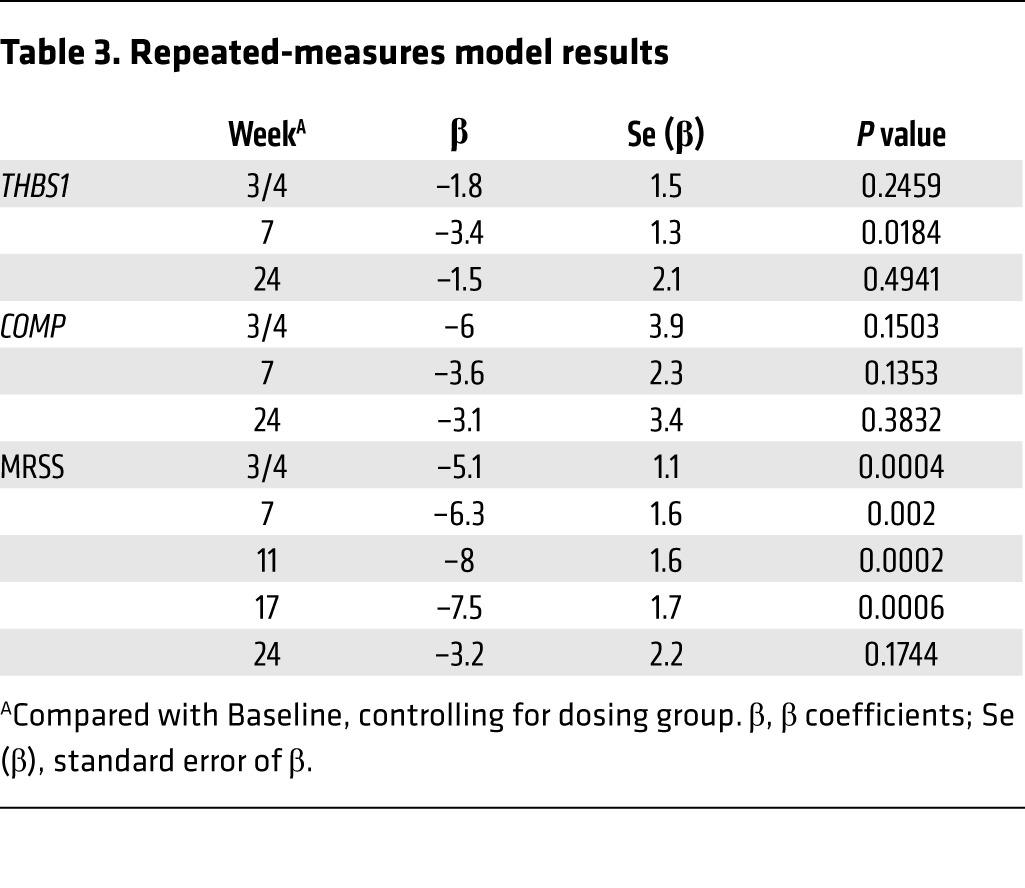
To verify the results using an analytic method robust in accounting for “missing-at-random” data, we used a repeated-measures model to take advantage of the multiple measurements per subject. Controlling for dose group, the predicted mean changes from baseline (β coefficients) closely paralleled the results obtained using all available data (Table 3). Changes in THBS1 and COMP expression were largest at week 7, with predicted decreases of –3.4 (P = 0.018) and –3.6 (P = 0.135), respectively. The dose by time interaction terms were significant for both THBS1 (P = 0.0012) and COMP (P = 0.0492), indicating that the patterns of change over time differed by dose group.
Table 3. Repeated-measures model results.
To better understand the relationship between the skin score at the biopsy site and gene expression, we compared gene expression of THBS1 and COMP to the local forearm skin score, the 0–3 score performed on the same day as the biopsy. The local skin score correlated highly with the MRSS and also with expression of both THBS1 and COMP (Supplemental Figure 2). We also examined autoantibody levels after treatment (week 11) compared with those at baseline (Supplemental Figure 3). Anti-Scl70 autoantibody levels fell modestly in all patients (4 of 4), but our patient group’s size was not sufficient to indicate a statistically meaningful result. Anti-Pol3 levels showed no consistent change, rising in some patients and falling in others. We also examined the effects of autoantibody status on the clinical response. The change in MRSS in anti-Pol3–negative or anti-Scl70–negative patients (median change = –12) was higher than that in anti-Scl70–positive (median change = –5) or anti-Pol3–positive patients (median change = –2), but these groups were too small to make a meaningful statistical comparison. The change in MRSS was different when comparing anti-Pol3–positive patients (median change in MRSS = –2) to anti-Pol3–negative patients (grouping anti-Scl70–positive patients with patients negative for both anti-Scl70 and anti-Pol3; mean change in MRSS = –6, P = 0.014) at week 7 but not at week 3 or 4 (P = 0.33).
Some studies have shown that longer disease duration is associated with spontaneous improvement in skin disease in patients with SSc (18). However, in patients in this early disease cohort, we found no relationship between the baseline disease duration and the subsequent change in MRSS (Supplemental Figure 4).
Skin disease shows rapid improvement after fresolimumab treatment.
The primary clinical outcome in this trial, the MRSS, declined rapidly in most patients, generally within several weeks of the infusion (Table 2). Examining the change in MRSS in each study group separately showed similar seeming response kinetics, with both groups showing rapid decreases in mean MRSS as soon as the first follow-up study visit, and then increasing skin scores by the week 24 study visit, apparently representing recurrent disease (Figure 3, E and F, and Supplemental Table 1B).
The median change in MRSS, using all available data across both dose groups, was most striking at weeks 11 and 17, –6 (P = 0.0005) and –9.5 (P = 0.0024), respectively (Table 2). Many patients then showed recurrent disease, i.e., an increase in the MRSS at a later point in the trial. The repeated-measures model reinforced the analysis of all available data (Table 3), with a nadir in the predicted change of –8 at week 11 (P = 0.0002). There was no statistically significant dose by time interaction in the repeated-measures model, indicating that the patterns of change over time in MRSS were somewhat similar for the 2 dose groups (P = 0.4168).
Decreased expression of a coregulated cluster of TGF-β–regulated genes and macrophage-associated genes after fresolimumab treatment.
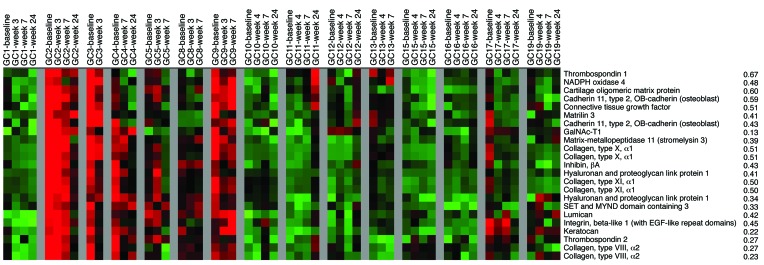
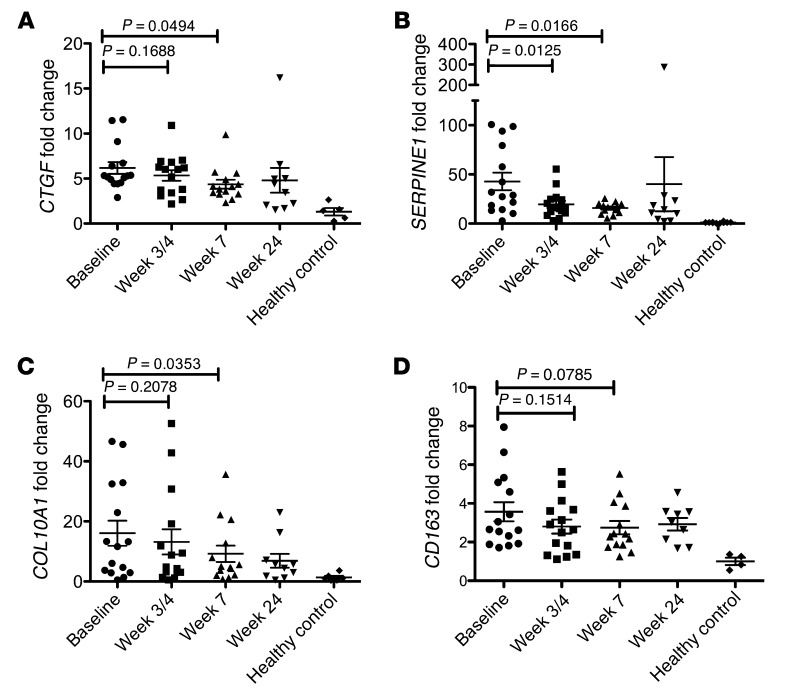
To further understand the genes regulated by fresolimumab in the study patients, biopsies were analyzed by microarray. Clustering of these genes revealed a readily recognizable cluster of TGF-β–regulated genes that included both of the genes predefined as the primary outcome measures: THBS1 and COMP (Figure 4). All of the genes in this cluster were found to correlate highly with the MRSS (Figure 4). Genes clustering with the primary outcome measures included several genes regulated by TGF-β: connective tissue growth factor (CTGF, also known as CCN2) (19), cadherin 11 (CAD11) (20), NADPH oxidase 4 (NOX4) (21), collagen X α 1 (COL10A1) (22), and collagen XI, α 1 (23). We quantified expression of several TGF-β and collagen genes by RT-PCR. CTGF, SERPINE1, and COL10A1 expression levels all declined after fresolimumab treatment compared with those at baseline (Figure 5, A–C).
Figure 4. Hierarchical clustering of skin gene expression in study patients.
The gene cluster, including both primary outcome measures, THBS1 and COMP, is shown. Samples from each study patient (n = 15) are shown as columns of gene expression (red, high gene expression; green, low gene expression; black, intermediate gene expression), labeled by study visit, starting with the baseline biopsy, followed sequentially by subsequent biopsies (top of figure), with a blank column between each patient. Gene names and the correlation between each gene and the MRSS are shown to the right and far right, respectively. GalNAc-T1, UDP-N-acetyl-α-D-galactosamine:polypeptide N-acetylgalactosaminyltransferase 1.
Figure 5. Changes in gene expression before and after fresolimumab treatment.
Skin biopsy RNAs were analyzed for expression of TGF-β–regulated genes, (A) CTGF, (B) SERPINE1, (C) and COL10A1, and a macrophage marker, (D) CD163, at baseline and after fresolimumab treatment. Levels from 5 healthy controls skin samples are also shown. CTGF, SERPINE1, and COL10A1 mRNA expression was assayed by RT-PCR; CD163 expression was assayed by NanoString. Statistical significance was assessed by Wilcoxon signed-rank. Error bars indicate SEM.
We also examined the microarray expression of inflammatory genes after fresolimumab treatment. CD14, CD163, and MS4A4A, all genes expressed mainly in monocytes/macrophages, clustered together (data not shown). Expression of CD163, tested by NanoString, trended lower after fresolimumab treatment (Figure 5D).
Decreased expression of a SSc skin pharmacodynamic biomarker after fresolimumab treatment.
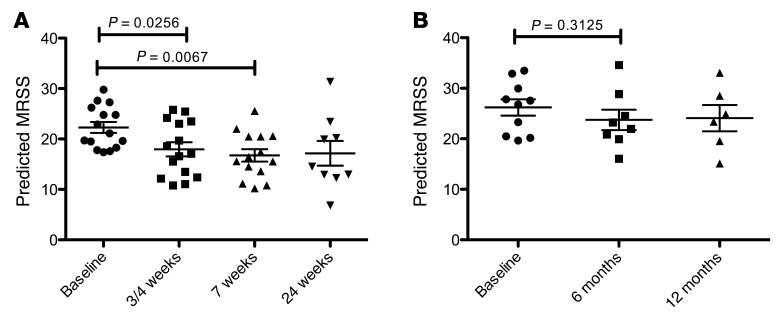
We tested the effect of treatment with fresolimumab on a recently developed, multianalyte, longitudinal pharmacodynamic biomarker (2GSSc skin biomarker; ref. 24). This biomarker is composed of weighted values for THBS1 and MS4A4A mRNA expression assessed by NanoString. The 2GSSc skin biomarker showed reduced expression at both week 3 or 4 and week 7 after fresolimumab treatment compared with baseline expression levels (Figure 6A). We compared the 2GSSc biomarker in samples from a clinical trial of nilotinib in SSc. This trial included very similar patients with early, diffuse SSc (Supplemental Table 2), but skin biopsies were analyzed at baseline, 6 months, and 12 months. This longer time interval between biopsies would be expected to show more dramatic changes in the 2GSSc skin biomarker than seen in samples from fresolimumab-treated patients, due to the natural history of the disease. In contrast to samples from fresolimumab-treated patients, nilotinib-treated patients showed no significant change in 2GSSc skin biomarker at 6 and 12 months compared with that at baseline (Figure 6B).
Figure 6. Decreased 2GSSc biomarker level in skin after fresolimumab treatment.
Skin RNAs from patients entered into (A) the fresolimumab trial or (B) a clinical trial of nilotinib were assayed by NanoString for 2GSSc skin biomarker levels in baseline, week 3 or 4, and week 7 (fresolimumab) or at baseline and 6 and 12 months (nilotinib). Statistical significance was assessed by Wilcoxon signed-rank. Error bars indicate SEM.
Inhibition of myofibroblasts and plasminogen activator protein-1 in fresolimumab-treated patients.
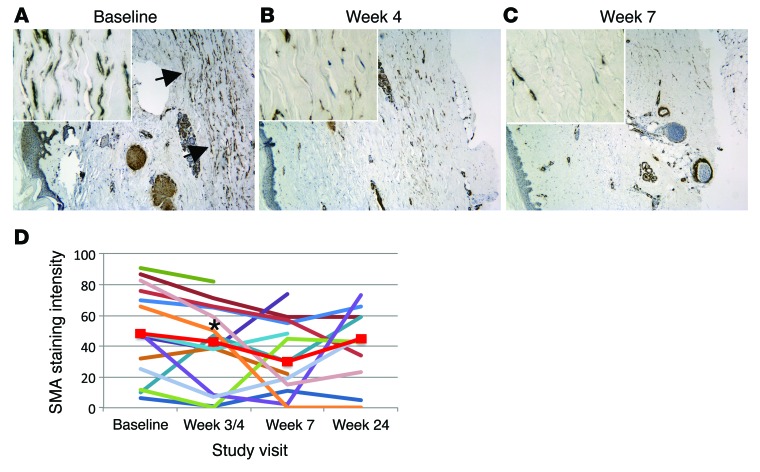
TGF-β stimulates fibroblast differentiation into myofibroblasts, the cell type consistently implicated in fibrosis in many diseases (25). Myofibroblasts are sensitive markers of SSc skin disease, and the intensity of myofibroblast infiltration correlates highly with the severity of skin disease, as assessed by the MRSS (26). In several patients, fresolimumab treatment was associated with a particularly rapid, dramatic decline in myofibroblast infiltration of the deep dermis (Figure 7, A–C). All study patients showed a decrease in myofibroblast infiltration at week 3 or 4 after treatment with fresolimumab (Figure 7D, P = 0.022). The degree of myofibroblast infiltration changed more consistently in patients receiving the higher dose of fresolimumab (second treatment group; data not shown).
Figure 7. Myofibroblast infiltration in fresolimumab-treated patients.
Sequential biopsies from patient GC17 are shown, comparing (B) week 4 and (C) week 7 to (A) baseline myofibroblast infiltration (original magnification, ×10). Arrows indicate myofibroblasts. Insets show myofibroblast staining in the deep dermis (original magnification, ×40). (D) Skin biopsies stained for smooth muscle actin (SMA) were scored by an observer blinded to biopsy sample for intensity of myofibroblast infiltration. Median values for each time point are shown by the red line with rectangular symbols (*P < 0.01, comparing week 4 to baseline, Wilcoxon ranked-sum).
Sections were also stained for the SERPINE1 gene product, plasminogen activator protein-1 (PAI-1). PAI-1 has long been recognized as a target of TGF-β (27). We show above that SERPINE1 mRNA is highly upregulated in SSc skin and its levels are reduced after fresolimumab treatment. PAI-1 protein staining was also reduced in SSc skin (Supplemental Figure 5A). Additionally, we examined dermal thickness in sections from patients after staining with trichrome. However, skin thickness was not found to change after fresolimumab treatment. (Supplemental Figure 5B).
Baseline expression of TGF-β–regulated genes predicts response to fresolimumab.
In order to understand whether expression of some genes might predict patient response to fresolimumab, we examined the relationship between microarray gene expression at baseline to the change in expression of THBS1 at week 3 or 4 and week 7 compared with baseline. A negative correlation would indicate genes whose level of expression at baseline predicts a decrease in THBS1 expression after fresolimumab treatment.
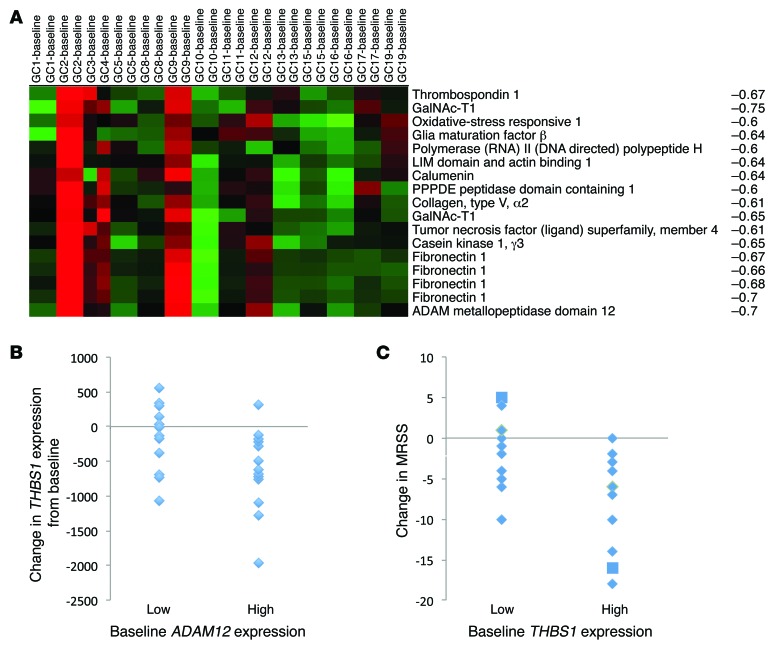
Clustering only genes showing correlations r < –0.6 revealed two known TGF-β–regulated genes, ADAM metallopeptidase domain 12 (ADAM12) and fibronectin (FN), clustering adjacent to each other (r = –0.7 for both, Figure 8A). THBS1 also clustered with these genes, correlating almost as highly as ADAM12 and FN (r = –0.67). Patients stratified dichotomously on the basis of having higher than median baseline ADAM12 expression were found to significantly and more frequently respond to fresolimumab (decreased THBS1 expression compared with baseline; Figure 8B, P < 0.05).
Figure 8. THBS1 and ADAM12 expression predicts response to fresolimumab.
(A) 58 genes showing correlations with the change in THBS1 expression at week 3 or 4 and week 7 compared with baseline of less than –0.6 were clustered. Baseline ADAM12, THBS1, and FN cluster together, showing strongly negative correlations with the change in THBS1 expression after fresolimumab treatment at week 3 or 4 and week 7 (red, higher expression; green, lower expression). Pearson correlations are shown to the right. (B) Patients were stratified into high (n = 14) and low (n = 14) baseline ADAM12 expression groups, based on whether they exhibited greater or less than the median level of ADAM12 expression on microarray. Patients were then graphed according to week 3 or 4 and week 7 THBS1 expression, compared with baseline (change in THBS1). Patient samples showing high baseline ADAM12 expression showed greater decreases in THBS1 after fresolimumab than patient samples with low baseline ADAM12 expression (P < 0.05, Fisher’s exact test). (C) Patient samples were stratified into high (n = 14) and low (n = 14) baseline THBS1 expression groups, based on whether they exhibited greater or less than median level of THBS1 expression on microarray. Samples were then graphed according to week 3 or 4 and week 7 THBS1 expression, compared with baseline (change in THBS1). Samples showing high baseline THBS1 expression showed greater decreases in MRSS after fresolimumab than samples with low baseline THBS1 expression (P < 0.05, Fisher’s exact test).
We also examined whether expression of genes might predict the observed change in the MRSS. Baseline THBS1 expression robustly correlated with the change in MRSS at week 3 or 4 and week 7 compared with that at baseline (r = –0.38). Patients stratified dichotomously on the basis of having a higher median baseline THBS1 expression were found to respond more frequently to fresolimumab, both biochemically (decreased THBS1 expression compared with baseline, P < 0.05, data not shown) and clinically (decreased MRSS compared with baseline, P < 0.05, Figure 8C).
Safety outcomes.
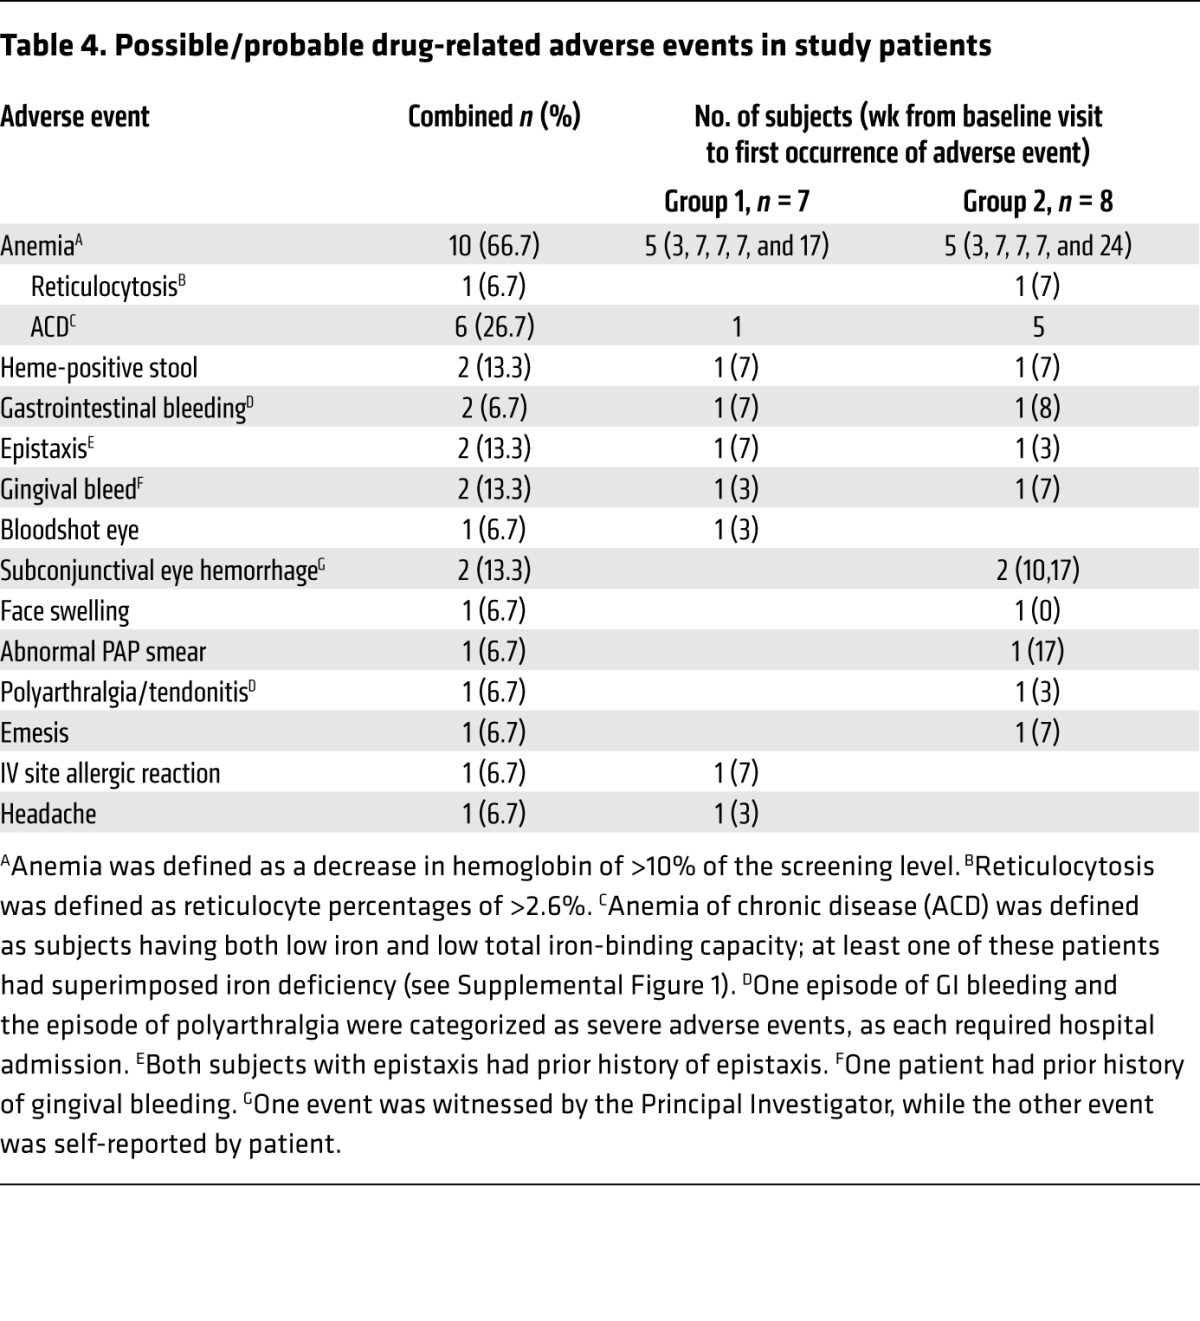
The most significant adverse events were several bleeding episodes and the common occurrence of anemia (Table 4). Two patients developed clinically significant gastrointestinal bleeding from gastric antral vascular ectasia (GAVE); one patient (GC08) with a history of GAVE required hospitalization, and both required transfusion. Both lesions were treated effectively with argon laser photocoagulation. Gingival bleeding and/or epistaxis were described by 3 patients, and 2 patients showed subconjunctival hemorrhages. Hemoglobin levels decreased by more than 10% at some point in the trial in 10 of 15 (66.7%) patients (Table 4 and Supplemental Figure 6), in most cases resolving without further treatment. Most anemic patients had iron studies consistent with anemia of chronic disease, although several also appeared iron deficient.
Table 4. Possible/probable drug-related adverse events in study patients.
One patient (GC13) with severe skin disease, who experienced rapid improvement in skin sclerosis (MRSS = 37 at baseline, improving to 30 at 3 weeks) after receiving one dose of fresolimumab (5 mg/kg), subsequently developed recurrent skin disease (MRSS = 35 at week 11) and developed shortness of breath 12 weeks after fresolimumab dosing. This patient was subsequently diagnosed with severe congestive heart failure and died of heart failure 10 days later. A premorbid cardiac biopsy of this patient showed severe cardiac fibrosis, a known complication of SSc (28).
In another patient, one premalignant lesion was identified, a low-grade squamous intraepithelial cervical lesion found on routine PAP smear 17 weeks after fresolimumab dosing; subsequent colposcopy showed mild dysplasia. This patient had a history of abnormal PAP smears, a low-grade squamous intraepithelial lesion, and a positive test for HPV DNA. Subsequent to the abnormal study PAP smear, the patient has had 2 normal PAP smears.
Discussion
Based on extensive in vitro and animal data, TGF-β has long been suspected as an important mediator of fibrosis in SSc as well as a variety of other fibrotic diseases, including renal, pulmonary, cardiac, and liver fibrosis (29–31). However, to our knowledge there has never previously been clinical data directly supporting its role in humans. Our data show that fresolimumab leads to a rapid decrease of TGF-β–regulated biomarker genes. For the predetermined primary efficacy outcome measures for the trial, THBS1 expression in SSc skin declined significantly in both fresolimumab-treated groups, while COMP trended strongly toward decreased expression in both groups. In addition microarray analyses showed that downregulation of these genes was associated with downregulated expression of a larger cluster of known TGF-β–regulated genes, including NOX4 and CTGF, both implicated as secondary mediators of TGF-β signaling (21, 32). Several collagen genes were also included in this cluster, consistent with a role for fresolimumab on genes directly mediating fibrosis. Expression of all of the genes in this cluster, most with r values greater than 0.4, was found to correlate with the MRSS, suggesting that these genes are part of a cluster of TGF-β–regulated genes that appear to play a driving role in TGF-β–mediated skin fibrosis in SSc.
Further supporting the pivotal role of TGF-β in SSc pathogenesis, patients treated with fresolimumab showed a rapid, significant decrease in MRSS, which correlated closely with the degree and speed of decline in the skin biomarkers. Thus, the biomarker data strongly reinforce the clinical data, while robustly supplementing it as an objective measure. The rate of decline of the skin score in these patients is unprecedented in clinical trials of even much longer duration (18). The natural history of patients with early, diffuse SSc, extracting from 7 large, placebo-controlled, negative large trials (n = 429), showed median MRSS improvements (decreases in MRSS) of 2.9 and 3.4 at 6 and 12 months (13). Thus, much larger and more rapid decreases in MRSS were seen in fresolimumab-treated patients (decreases of 5.1, 6.3, and 8 at week 3 or 4, 7, and 11, respectively).
TGF-β is also known to induce myofibroblasts (25), and the intensity of myofibroblast staining correlates highly with the degree of skin disease (26). Thus, decreased staining of myofibroblasts after fresolimumab treatment further supports the role of TGF-β in SSc pathogenesis as well as the observed clinical effect on skin disease. Expression of genes known to be highly regulated by TGF-β, CTGF and SERPINE (which encodes PAI-1), was also lower in patient skin samples 3 or 4 weeks after fresolimumab treatment, strongly supporting the role of TGF-β in pathogenesis and expression of these genes. On the other hand, skin thickness did not change significantly after fresolimumab treatment. The MRSS is primarily designed to detect changes in skin thickness; however, the effect of fresolimumab on the MRSS is likely due to changes in skin tightness and tethering that result from blocking TGF-β. These clinical manifestations of skin tightness and tethering might be due more to the presence of myofibroblasts in SSc skin and to loss of subcutaneous fat, respectively, than to increased skin thickness. Our data show that at least one of these features, myofibroblast number, changes more rapidly than skin thickness after TGF-β inhibition.
Notably, the statistically significant improvements in both clinical score and biomarker expression observed early after fresolimumab treatment were lost by the last study visit (week 24), 7 or 8 drug half-lives after the last dose given in the first and second patient groups, respectively. Thus, these data further support the role of fresolimumab in the observed declines in MRSS and biomarker gene expression and indicate a need for longer treatment in future studies. Collectively, these observations strongly support a key role for TGF-β in SSc pathogenesis.
Patients treated with fresolimumab showed a trend of decreased levels of the macrophage/monocyte-associated genes, CD163 and MS4A4A. The latter of these genes is the second of two genes in the 2GSSc skin biomarker (24). The change in macrophage marker genes was less dramatic (and not statistically significant in this small trial) but might suggest that TGF-β also contributes to the perivascular inflammation seen in this disease. Indeed, TGF-β is known to induce monocyte chemotaxis, in addition to its antiinflammatory properties (33), and induces Th2, Th17, and plasmacytoid dendritic cell migration into the skin of mice with mutations found in patients with stiff skin syndrome that mimic dermal fibrosis of SSc (34).
We found that baseline expression of THBS1 and ADAM12 was a predictive biomarker for improved THBS1 expression after fresolimumab treatment and baseline THBS1 expression was predictive of improvement in the MRSS after fresolimumab treatment. These observations suggest that patients might be stratified for their likely response to TGF-β inhibition on the basis of their pretreatment gene expression. Both THBS1 and ADAM12 are known to be induced by TGF-β (35, 36). THBS1 can also activate TGF-β, while ADAM12 has also been shown to contribute to TGF-β signaling through an interaction with the type II TGF-β receptor (37). Notably, in recent studies, ADAM12+ pericytes were shown to be progenitors of myofibroblasts induced after skin or muscle injury, and deletion of ADAM12+ cells blocked fibrosis (38). Thus, it is intriguing to consider a possible role for TGF-β in stimulating ADAM12+ pericytes in the generation of myofibroblasts and fibrosis in SSc skin.
An earlier study of the TGF-β mAb CAT-192 in SSc failed to show any difference in change in MRSS between treatment groups (39). Importantly, CAT-192 targets only TGF-β1 (40), with a dissociation constant of 150 nM, whereas fresolimumab is a much higher-affinity antibody for TGF-β1 but also targets TGF-β2 and TGF-β3, with dissociation constants of 2.3 nM, 2.8 nM, and 1.4 nM, respectively (Genzyme, unpublished Biacore analyses). Thus, the neutralizing activity against TGF-β2 and TGF-β3 or much higher target affinity may be critical in the activity of fresolimumab in SSc.
The anti–TGF-β antibody fresolimumab (also known as GC1008) has been tried previously in patients for several diseases. In patients with focal segmental glomerulosclerosis (FSGS), fresolimumab treatment was associated with a decline in proteinuria in some patients, suggesting possible efficacy in this disease, for which TGF-β is also strongly implicated in pathogenesis (41, 42). Like in SSc, THBS1 is overexpressed in FSGS renal glomeruli (43, 44), suggesting that it may provide a strong biomarker in other TGF-β–mediated diseases.
Patients with malignant mesothelioma (n = 13) were treated with 3 mg/kg fresolimumab for up to 6 doses, showing little clinical effect but also few adverse effects. One patient developed erythematous, verrucous papules on biopsy, showing atypical keratinocyte proliferation (45). In patients with malignant melanoma (n = 28) or renal cell carcinoma (n = 1), patients received up to 4 doses of 15 mg/kg fresolimumab over a period of 56 days, with 5 patients also receiving an additional 4 doses ranging from 0.1 to 1 mg/kg (46). Minor bleeding (epistaxis and gingival bleeding) was seen frequently in these patients. In addition, several patients developed epithelial lesions suggestive of squamous cell carcinoma, rather than keratoacanthoma, which is more commonly seen in patients receiving higher doses of medication. All but one of these patients was ultimately diagnosed pathologically as having keratoacanthomas, and the lesions resolved spontaneously after fresolimumab treatment was complete, a clinical course more consistent with keratoacanthoma.
We did not see keratoacanthomas in our study; however, several patients had epistaxis, gum bleeding, or subconjunctival eye hemorrhage, as reported in other studies of fresolimumab (46, 47). Although the incidence of GAVE in this study group was similar to that expected in such a patient cohort, the timing and severity of these and other bleeding incidences in our study patients dictates careful observation of this complication in future trials. Anemia in the study patients has not been reported in past trials and may be related to bleeding, SSc, and/or its treatment. Iron studies did not clearly distinguish iron deficiency from anemia of chronic disease (or both) in most patients. No patients showed evidence of hemolysis, and most showed an inappropriate response to the anemia (low or normal reticulocyte counts). Most patients were also on proton pump inhibitors, known to block iron absorption, and severe anemia associated with GAVE, though not correcting with oral iron, responded promptly to intravenous iron, consistent with underlying iron deficiency and preexisting gastrointestinal blood loss. Thus, future studies of fresolimumab in patients with SSc should include careful baseline evaluation for indolent gastrointestinal bleeding and iron deficiency.
Despite recent studies clarifying the natural history of diffuse cutaneous SSc as a disease that frequently remits spontaneously, the disease often progresses relentlessly and is associated with considerable mortality through a variety of complications (48). Although patients do not typically die directly of skin disease, the underlying pathogenesis for fibrotic complications, including fatal complications of the lung and bowel, is likely similar. Thus, these complications may also be driven by TGF-β and potentially amenable to inhibition by fresolimumab. Fresolimumab has been well tolerated in several trials (described above) at higher doses than those used in this study and multiple doses. The concern for side effects from TGF-β inhibition needs to be carefully weighed against the prognosis of SSc and currently available therapeutics. Cyclophosphamide and immunoablation with stem cell transplant are both associated with neoplastic complications, and stem cell transplant is associated with considerable transplant-associated mortality (8). Fresolimumab is potentially a safer alternative. These complications, as well as the wide array of other diseases associated with organ fibrosis, may also be driven by TGF-β and respond to fresolimumab. Thus, fresolimumab holds promise as a potent antifibrotic therapeutic, which needs further study for the safety of longer-term use and for treatment of skin, lung, and gastrointestinal tract fibrosis.
Methods
Patients.
This single-center study was approved by the Boston University Medical Campus Institutional Review Board and registered with clinicaltrials.gov identifier NCT01284322 prior to patient recruitment. The study was conducted after FDA review under Investigational New Drug 110704. A Data and Safety Monitoring Board, composed of two physicians external to the study investigators, reviewed all adverse events. Patients ≥18 years of age were included who had SSc (49) with diffuse cutaneous disease (50), a MRSS ≥15, and early disease, as defined by occurrence of the first non-Raynaud’s disease symptom within 2 years study entry. Patients with substantial pulmonary compromise (forced vital capacity less than 80% predicted, diffusion capacity less than 70% predicted, or >20% fibrosis on computerized chest tomography); recent (within 6 months of study entry) scleroderma renal crisis or elevated creatinine >2.0; significant arrhythmia, unstable angina, or clinical heart failure; elevated liver function tests >2.5 times normal; bowel obstruction requiring hospitalization within 3 months or malabsorption requiring parenteral nutrition; recent bleeding, anemia (Hgb <8.5), or thrombocytopenia (platelet count <100,000/mm3); active infection; or any history of malignancy or history of premalignancy within 5 years were excluded. Patients were required to be on a stable dose of 10 mg per day or less of prednisone and no other immunosuppressive medication. None of the patients received any immunosuppressive medications before the primary outcome measures, the biomarker skin biopsies, were performed at week 3 or 4 and week 7. Five patients were started on immunosuppressive therapy during the safety follow-up. GC02 was started on methotrexate at week 11, which was discontinued, and the patient started on cyclophosphamide at week 17. GC03 was started on mycophenolate on week 15 after study withdrawal at the week 4 visit. GC11 and GC12 were started on methotrexate at week 11. GC13 was started on methotrexate on week 9.
Study design.
Patients meeting inclusion criteria at the screening visit returned to the Boston University Medical Campus General Clinical Research Unit within 4 weeks. After an interim history and physical examination, two 3-mm skin biopsies were performed on the dorsal surface of the mid-forearm: one biopsy was immediately placed into 10% buffered formalin, and the other was placed into RNAlater (Qiagen). Study medication was then administered by intravenous infusion. The first cohort, receiving 1 mg/kg fresolimumab, returned after 3 weeks for safety laboratory tests and repeat skin biopsies at sites approximately 5 mm from but immediately adjacent to the initial biopsies, followed by a repeat 1 mg/kg dose of fresolimumab at week 4. Fresolimumab was supplied by Genzyme under Investigational New Drug 110704, granted to the Principal Study Investigator, Robert Lafyatis. The second cohort, receiving a single dose of 5 mg/kg fresolimumab, returned at week 4 for safety laboratory tests and skin biopsies. Both cohorts returned for follow-up safety monitoring at weeks 7, 11, 17, and 24, with skin biopsies performed again at week 7 and, optionally, if the patient was willing, at week 24 at sites approximately 5 mm from but immediately adjacent to the most recent biopsy. The MRSS was assessed at each study visit by the same study physician. The scleroderma-modified health assessment questionnaire was administered at weeks 0, 7, and 24.
Safety assessments.
Safety was assessed at each study visit using Common Terminology Criteria for Adverse Events v4.0. Based on FDA protocol recommendations, all adverse events were considered related to the study drug unless there was a clear and identifiable reason or explanation to reject casual relation. Due to concerns regarding possible promotion of tumor progression by blocking TGF-β, in addition to routine physical exam, patients were monitored by complete skin, oropharyngeal, and nasal exams; for the second cohort, patients were monitored by urinalysis for hematuria at baseline and all subsequent study visits. A complete blood count with differential and an extended metabolic panel, including electrolytes and liver and renal function tests, were performed at each study visit.
Skin biomarker measurements.
RNA was collected from skin samples and placed directly at the bedside into RNAlater. The skin was minced and homogenized with a Polytron homogenizer, RNA was purified using the RNeasy Mini Kit (Qiagen), and the concentration of total RNA was measured (Nanodrop 1000; ThermoScientific). 200 ng of RNA was used to make cDNA, according to the SuperScript II RT (Invitrogen) protocol using random primers, and tested for THBS1, COMP, CTGF, SERPINE1, and COL10A1 levels by RT-PCR, normalizing values to 18S RNA and then normalizing the fold change to the average expression of RNAs from 5 healthy control skin samples. Primers were purchased from Applied Biosystems: THBS1 (Hs00962908_m1); COMP (Hs00164359_M1); CTGF (Hs01026927_g1); SERPINE1 (Hs01126606_m1); and COL10A1 (Hs0016657_m1). RNA was also analyzed by microarray on Affymetrix U133A2.0 microarray chips, and data were normalized using the MAS 5.0 algorithm. Gene expression values were clustered using Cluster 2.0 (51). After filtering for genes showing differences of greater than 200 across all samples, genes were mean centered, normalized, clustered by complete linkage, and visualized using Java Treeview. Further exploratory analyses for inflammatory genes were carried out by clustering only genes selected on the basis of an expression correlating with the MRSS >0.4.
RNA from skin biopsies was prepared and analyzed by microarray on Affymetrix U133A2.0 microarray chips. After filtering for genes showing differences of greater than 200 across all samples, genes were mean centered, normalized, clustered by complete linkage using Cluster 2.0 (51), and visualized using Java Treeview. All microarray data have been deposited in the GEO database (accession GSE55036).
Immunohistochemical staining was carried out on formalin-fixed, paraffin-embedded sections. For antigen retrieval, slides were incubated in citrate buffer pH 6.1 (Dako North America) for 20 minutes at 90°C. Sections were then incubated with a rabbit anti–PAI-1 (NBP2-13298, Novus Biologicals; 1:25 dilution) or mouse anti-SMA (clone 1A4, M0851, Dako; 1:400 dilution). After washing, the sections were incubated with polymer/HRP solution (K5361, Dako) and developed using DAB. Staining intensity was assessed by an observer blinded to the patient and visit, as described previously (26). Collagen thickness on trichrome-stained slides was measured using a Nikon Eclipse E400 microscope and SPOT Software Advanced version 4.5. Measurements were taken on each biopsy from the dermal epidermal junction to the point at which collagen staining disappeared.
Statistics.
Summary statistics, including the mean, median, standard deviation, and 95% confidence limits, are reported overall and by dosing group for THBS1, COMP, and MRSSs at each time point and for change from baseline to each follow-up time point. The Wilcoxon signed-rank test was used to assess statistically significant changes in each outcome for all available data for both dosing groups, combined and separately, and graphed using Prism software (GraphPad). Spearman’s correlations were calculated to examine the relationships between gene expression and MRSS.
For each outcome, a general linear model for correlated data was used to incorporate all of the data into a single model and account for potential correlation between repeated measurements on an individual. This approach uses all available data and is robust to “missing-at-random” data mechanisms. An unstructured covariance was used for all analyses. Each model contained terms for dosing group, categorical time, and their interaction. The interaction was removed to assess the main effect of time. β Coefficients and corresponding standard errors are reported. These analyses were performed using SAS v9.3.
The difference in immunohistochemical staining intensities and autoantibody titers, comparing baseline and after treatment in each patient, were analyzed using Wilcoxon signed-rank test. Statistical differences in the changes in skin score in patient groups showing different autoantibody status were compared using the Mann-Whitney test.
For predictive biomarker identification, Pearson correlations between expression of each gene analyzed by microarray and the difference in THBS1 expression at week 3 or 4 and week 7 compared with baseline were calculated. Changes in expression from baseline to week 3 or 4 and week 7 were treated as independent values for these analyses. Genes showing correlations with fresolimumab-associated change in THBS1 expression of r < –0.4 or r < –0.6 were selected for clustering. Using Cluster 2.0, genes were mean centered, normalized, clustered by complete linkage, and visualized using Java Treeview. Fisher’s exact test was used to calculate statistical significance on a contingency table, based on patients having higher or lower than median baseline ADAM12 expression and having increased or decreased THBS1 gene expression from baseline.
Study approval.
The study was reviewed and approved by the Boston University Medical Campus Institutional Review Board, Boston, Massachusetts, USA. All subjects provided informed consent prior to their participation in the study.
Supplementary Material
Acknowledgments
The authors would like to thank Richard Polisson, Patrick Finn, Eileen Budri, Michael Halpin, and Marta Frisinger for help with regulatory and safety review during the study. The authors thank Kate Brennan for help with manuscript preparation and Marc Lenburg and Yuriy Alekseyev for help with microarray analyses. This study was supported by the NIH’s National Center for Advancing Translational Sciences Clinical and Translational Science Award; National Institute of Arthritis Musculoskeletal and Skin Disease grants: Scleroderma Core Centers (5P30AR061271), Scleroderma Center of Research Translation (1P50AR060780), and 2R01AR051089; a Clinician Scientist Development Award through the Kellen Foundation at Hospital for Special Surgery to J. Gordon; and Scleroderma Research Foundation and Dr. Ralph and Marian Falk Medical Research Trust grants to M.L. Whitfield. The nilotinib clinical trial was also supported by an investigator-initiated grant from Novartis and by the Rudolph Rupert Scleroderma Program at Hospital for Special Surgery.
Footnotes
Conflict of interest: Robert F. Spiera has received grants from the Rudolph Rupert Scleroderma Program at Hospital for Special Surgery, Novartis, Genentech/Roche, Human Genome Sciences/GlaxoSmithKline, Actelion, United Therapeutics, ChemoCentryx, and Bristol-Myers Squibb and consulting fees from Boehringer Ingelheim and Alexion Pharmaceuticals. Jessica K. Gordon has received grants from the Kellen Foundation at Hospital for Special Surgery, the Rudolph Rupert Scleroderma Program at Hospital for Special Surgery, and Novartis. Michael L. Whitfield is a scientific founder of Celdara Medical LLC and has filed patents and received patent royalties and fees on gene expression biomarkers for SSc but received no consulting fees or patent royalties for the work conducted in this manuscript. Robert W. Simms received grants from Actelion, Celgene, Reata Pharmaceuticals, Bayer, Genentech/Roche, and InterMune and both grants and consulting fees from Cytori Therapeutics Inc. and Gilead Sciences. Robert Lafyatis has received both grants and consulting fees from Genzyme (now a fully owned subsidiary of Sanofi), Shire, Regeneron, Biogen, Bristol-Myers Squibb, Inception Sciences, Precision Dermatology, PRISM, UCB, Pfizer, and Genentech/Roche. He has received consulting fees from Lycera, Novartis, Celgene, Amira, Celdara, Celltex, Dart Therapeutics, Idera, InterMune, MedImmune, Promedior, Zwitter Technology, Actelion, EMD Serono, Akros, Extera Partners, Reneo, Scholar Rock, and Human Genome Sciences.
Role of funding source: The NIH reviewed and funded the grant supporting the study but otherwise played no direct role in the study conduct. Genzyme supplied the study drug and assisted with regulatory aspects, supplying the Investigational New Drug cross-reference letter and reviewing adverse events, but provided no other financial support for the study.
Reference information:J Clin Invest. 2015;125(7):2795–2807. doi:10.1172/JCI77958.
References
- 1.Roberts AB, Anzano MA, Wakefield LM, Roche NS, Stern DF, Sporn MB. Type β transforming growth factor: a bifunctional regulator of cellular growth. Proc Natl Acad Sci U S A. 1985;82(1):119–123. doi: 10.1073/pnas.82.1.119. [DOI] [PMC free article] [PubMed] [Google Scholar]
- 2.Roberts AB, et al. Transforming growth factor type β: rapid induction of fibrosis and angiogenesis in vivo and stimulation of collagen formation in vitro. Proc Natl Acad Sci U S A. 1986;83(12):4167–4171. doi: 10.1073/pnas.83.12.4167. [DOI] [PMC free article] [PubMed] [Google Scholar]
- 3.Roberts AB, Heine UI, Flanders KC, Sporn MB. Transforming growth factor-β. Major role in regulation of extracellular matrix. Ann N Y Acad Sci. 1990;580:225–232. doi: 10.1111/j.1749-6632.1990.tb17931.x. [DOI] [PubMed] [Google Scholar]
- 4.Penttinen RP, Kobayashi S, Bornstein P. Transforming growth factor β increases mRNA for matrix proteins both in the presence and in the absence of changes in mRNA stability. Proc Natl Acad Sci U S A. 1988;85(4):1105–1108. doi: 10.1073/pnas.85.4.1105. [DOI] [PMC free article] [PubMed] [Google Scholar]
- 5. Derynck R, Miyaono K, eds. The TGF-Beta Family. Cold Spring Harbor Monograph Series 50. Cold Spring Harbor, New York, USA: Cold Spring Harbor Laboratory Press; 2007. [Google Scholar]
- 6. Varga J, Denton CP, Wigley FM, eds. Scleroderma: From Pathogenesis to Comprehensive Management. New York, New York, USA: Springer; 2012. [Google Scholar]
- 7.Tashkin DP, et al. Cyclophosphamide versus placebo in scleroderma lung disease. N Engl J Med. 2006;354(25):2655–2666. doi: 10.1056/NEJMoa055120. [DOI] [PubMed] [Google Scholar]
- 8.van Laar JM, et al. Autologous hematopoietic stem cell transplantation vs intravenous pulse cyclophosphamide in diffuse cutaneous systemic sclerosis: a randomized clinical trial. JAMA. 2014;311(24):2490–2498. doi: 10.1001/jama.2014.6368. [DOI] [PubMed] [Google Scholar]
- 9.Wynn TA. Cellular and molecular mechanisms of fibrosis. J Pathol. 2008;214(2):199–210. doi: 10.1002/path.2277. [DOI] [PMC free article] [PubMed] [Google Scholar]
- 10.Clements PJ, et al. Skin thickness score as a predictor and correlate of outcome in systemic sclerosis: high-dose versus low-dose penicillamine trial. Arthritis Rheum. 2000;43(11):2445–2454. doi: 10.1002/1529-0131(200011)43:11<2445::AID-ANR11>3.0.CO;2-Q. [DOI] [PubMed] [Google Scholar]
- 11.Varga J, Abraham D. Systemic sclerosis: a prototypic multisystem fibrotic disorder. J Clin Invest. 2007;117(3):557–567. doi: 10.1172/JCI31139. [DOI] [PMC free article] [PubMed] [Google Scholar]
- 12.Fischer A, du Bois R. Interstitial lung disease in connective tissue disorders. Lancet. 2012;380(9842):689–698. doi: 10.1016/S0140-6736(12)61079-4. [DOI] [PubMed] [Google Scholar]
- 13.Merkel PA, et al. Patterns and predictors of change in outcome measures in clinical trials in scleroderma: an individual patient meta-analysis of 629 subjects with diffuse cutaneous systemic sclerosis. Arthritis Rheum. 2012;64(10):3420–3429. doi: 10.1002/art.34427. [DOI] [PMC free article] [PubMed] [Google Scholar]
- 14.Matucci-Cerinic M, Steen VD, Furst DE, Seibold JR. Clinical trials in systemic sclerosis: lessons learned and outcomes. Arthritis Res Ther. 2007;9(suppl 2):S7. doi: 10.1186/ar2191. [DOI] [PMC free article] [PubMed] [Google Scholar]
- 15.Farina G, Lafyatis D, Lemaire R, Lafyatis R. A four-gene biomarker predicts skin disease in patients with diffuse cutaneous systemic sclerosis. Arthritis Rheum. 2010;62(2):580–588. doi: 10.1002/art.27220. [DOI] [PMC free article] [PubMed] [Google Scholar]
- 16.Sobanski V, et al. Prevalence of anti-RNA polymerase III antibodies in systemic sclerosis: new data from a French cohort and a systematic review and meta-analysis. Arthritis Rheumatol. 2014;66(2):407–417. doi: 10.1002/art.38219. [DOI] [PubMed] [Google Scholar]
- 17.Okano Y, Steen VD, Medsger TA., Jr Autoantibody reactive with RNA polymerase III in systemic sclerosis. Ann Intern Med. 1993;119(10):1005–1013. doi: 10.7326/0003-4819-119-10-199311150-00007. [DOI] [PubMed] [Google Scholar]
- 18.Amjadi S, et al. Course of the modified Rodnan skin thickness score in systemic sclerosis clinical trials: analysis of three large multicenter, double-blind, randomized controlled trials. Arthritis Rheum. 2009;60(8):2490–2498. doi: 10.1002/art.24681. [DOI] [PMC free article] [PubMed] [Google Scholar]
- 19.Igarashi A, et al. Significant correlation between connective tissue growth factor gene expression and skin sclerosis in tissue sections from patients with systemic sclerosis. J Invest Dermatol. 1995;105(2):280–284. doi: 10.1111/1523-1747.ep12318465. [DOI] [PubMed] [Google Scholar]
- 20.Wu M, et al. Identification of cadherin-11 as a mediator of dermal fibrosis and possible role in systemic sclerosis. Arthritis Rheumatol. 2013;66(4):1010–1021. doi: 10.1002/art.38275. [DOI] [PMC free article] [PubMed] [Google Scholar]
- 21.Hecker L, et al. NADPH oxidase-4 mediates myofibroblast activation and fibrogenic responses to lung injury. Nat Med. 2009;15(9):1077–1081. doi: 10.1038/nm.2005. [DOI] [PMC free article] [PubMed] [Google Scholar]
- 22.Mehlhorn AT, et al. Differential effects of BMP-2 and TGF-beta1 on chondrogenic differentiation of adipose derived stem cells. Cell Prolif. 2007;40(6):809–823. doi: 10.1111/j.1365-2184.2007.00473.x. [DOI] [PMC free article] [PubMed] [Google Scholar]
- 23.Zhou XD, Xiong MM, Tan FK, Guo XJ, Arnett FC. SPARC, an upstream regulator of connective tissue growth factor in response to transforming growth factor beta stimulation. Arthritis Rheum. 2006;54(12):3885–3889. doi: 10.1002/art.22249. [DOI] [PubMed] [Google Scholar]
- 24.Rice LM, et al. A longitudinal biomarker for the extent of skin disease in patients with diffuse cutaneous systemic sclerosis. Arthritis Rheum. doi: 10.1002/art.39287. In press. [DOI] [PMC free article] [PubMed] [Google Scholar]
- 25.Desmouliere A, Geinoz A, Gabbiani F, Gabbiani G. Transforming growth factor-β 1 induces α-smooth muscle actin expression in granulation tissue myofibroblasts and in quiescent and growing cultured fibroblasts. J Cell Biol. 1993;122(1):103–111. doi: 10.1083/jcb.122.1.103. [DOI] [PMC free article] [PubMed] [Google Scholar]
- 26.Kissin EY, Merkel PA, Lafyatis R. Myofibroblasts and hyalinized collagen as markers of skin disease in systemic sclerosis. Arthritis Rheum. 2006;54(11):3655–3660. doi: 10.1002/art.22186. [DOI] [PubMed] [Google Scholar]
- 27.Lund LR, et al. Transforming growth factor-β is a strong and fast acting positive regulator of the level of type-1 plasminogen activator inhibitor mRNA in WI-38 human lung fibroblasts. EMBO J. 1987;6(5):1281–1286. doi: 10.1002/j.1460-2075.1987.tb02365.x. [DOI] [PMC free article] [PubMed] [Google Scholar]
- 28.Meune C, Vignaux O, Kahan A, Allanore Y. Heart involvement in systemic sclerosis: evolving concept and diagnostic methodologies. Arch Cardiovasc Dis. 2010;103(1):46–52. doi: 10.1016/j.acvd.2009.06.009. [DOI] [PubMed] [Google Scholar]
- 29.Gewin L, Zent R. How does TGF-beta mediate tubulointerstitial fibrosis? Semin Nephrol. 2012;32(3):228–235. doi: 10.1016/j.semnephrol.2012.04.001. [DOI] [PMC free article] [PubMed] [Google Scholar]
- 30.Inagaki Y, Higashiyama R, Higashi K. Novel anti-fibrotic modalities for liver fibrosis: molecular targeting and regenerative medicine in fibrosis therapy. J Gastroenterol Hepatol. 2012;27(suppl 2):85–88. doi: 10.1111/j.1440-1746.2011.07006.x. [DOI] [PubMed] [Google Scholar]
- 31.Maher TM. Idiopathic pulmonary fibrosis: pathobiology of novel approaches to treatment. Clin Chest Med. 2012;33(1):69–83. doi: 10.1016/j.ccm.2011.11.002. [DOI] [PubMed] [Google Scholar]
- 32.Sonnylal S, et al. Selective expression of connective tissue growth factor in fibroblasts in vivo promotes systemic tissue fibrosis. Arthritis Rheum. 2010;62(5):1523–1532. doi: 10.1002/art.27382. [DOI] [PMC free article] [PubMed] [Google Scholar]
- 33.Wahl SM, et al. Transforming growth factor type β induces monocyte chemotaxis and growth factor production. Proc Natl Acad Sci U S A. 1987;84(16):5788–5792. doi: 10.1073/pnas.84.16.5788. [DOI] [PMC free article] [PubMed] [Google Scholar]
- 34.Gerber EE, et al. Integrin-modulating therapy prevents fibrosis and autoimmunity in mouse models of scleroderma. Nature. 2013;503(7474):126–130. doi: 10.1038/nature12614. [DOI] [PMC free article] [PubMed] [Google Scholar]
- 35.Kim YM, et al. Proteomic identification of ADAM12 as a regulator for TGF-β1-induced differentiation of human mesenchymal stem cells to smooth muscle cells. PLoS One. 2012;7(7):e40820. doi: 10.1371/journal.pone.0040820. [DOI] [PMC free article] [PubMed] [Google Scholar]
- 36.Negoescu A, Lafeuillade B, Pellerin S, Chambaz EM, Feige JJ. Transforming growth factors β stimulate both thrombospondin-1 and CISP/thrombospondin-2 synthesis by bovine adrenocortical cells. Exp Cell Res. 1995;217(2):404–409. doi: 10.1006/excr.1995.1103. [DOI] [PubMed] [Google Scholar]
- 37.Atfi A, et al. The disintegrin and metalloproteinase ADAM12 contributes to TGF-β signaling through interaction with the type II receptor. J Cell Biol. 2007;178(2):201–208. doi: 10.1083/jcb.200612046. [DOI] [PMC free article] [PubMed] [Google Scholar]
- 38.Dulauroy S, Di Carlo SE, Langa F, Eberl G, Peduto L. Lineage tracing and genetic ablation of ADAM12(+) perivascular cells identify a major source of profibrotic cells during acute tissue injury. Nat Med. 2012;18(8):1262–1270. doi: 10.1038/nm.2848. [DOI] [PubMed] [Google Scholar]
- 39.Denton CP, et al. Recombinant human anti-transforming growth factor beta1 antibody therapy in systemic sclerosis: a multicenter, randomized, placebo-controlled phase I/II trial of CAT-192. Arthritis Rheum. 2007;56(1):323–333. doi: 10.1002/art.22289. [DOI] [PubMed] [Google Scholar]
- 40.Rapoza ML, Fu D, Sendak RA. Development of an in vitro potency assay for therapeutic TGFβ antagonists: the A549 cell bioassay. J Immunol Methods. 2006;316(1):18–26. doi: 10.1016/j.jim.2006.07.009. [DOI] [PubMed] [Google Scholar]
- 41.Qu X, et al. Regulation of renal fibrosis by Smad3 thr388 phosphorylation. Am J Pathol. 2014;184(4):944–952. doi: 10.1016/j.ajpath.2013.12.003. [DOI] [PubMed] [Google Scholar]
- 42.Lee HS. Mechanisms and consequences of TGF-ss overexpression by podocytes in progressive podocyte disease. Cell Tissue Res. 2012;347(1):129–140. doi: 10.1007/s00441-011-1169-7. [DOI] [PMC free article] [PubMed] [Google Scholar]
- 43.Kim JH, Kim BK, Moon KC, Hong HK, Lee HS. Activation of the TGF-β/Smad signaling pathway in focal segmental glomerulosclerosis. Kidney Int. 2003;64(5):1715–1721. doi: 10.1046/j.1523-1755.2003.00288.x. [DOI] [PubMed] [Google Scholar]
- 44.Bennett MR, Czech KA, Arend LJ, Witte DP, Devarajan P, Potter SS. Laser capture microdissection-microarray analysis of focal segmental glomerulosclerosis glomeruli. Nephron Exp Nephrol. 2007;107(1):e30–e40. doi: 10.1159/000106775. [DOI] [PubMed] [Google Scholar]
- 45.Stevenson JP, et al. Immunological effects of the TGFbeta-blocking antibody GC1008 in malignant pleural mesothelioma patients. Oncoimmunology. 2013;2(8):e26218. doi: 10.4161/onci.26218. [DOI] [PMC free article] [PubMed] [Google Scholar]
- 46.Morris JC, et al. Phase I study of GC1008 (fresolimumab): a human anti-transforming growth factor-beta (TGFβ) monoclonal antibody in patients with advanced malignant melanoma or renal cell carcinoma. PLoS One. 2014;9(3):e90353. doi: 10.1371/journal.pone.0090353. [DOI] [PMC free article] [PubMed] [Google Scholar]
- 47.Trachtman H, et al. A phase 1, single-dose study of fresolimumab, an anti-TGF-β antibody, in treatment-resistant primary focal segmental glomerulosclerosis. Kidney Int. 2011;79(11):1236–1243. doi: 10.1038/ki.2011.33. [DOI] [PMC free article] [PubMed] [Google Scholar]
- 48.Elhai M, Meune C, Avouac J, Kahan A, Allanore Y. Trends in mortality in patients with systemic sclerosis over 40 years: a systematic review and meta-analysis of cohort studies. Rheumatology (Oxford). 2012;51(6):1017–1026. doi: 10.1093/rheumatology/ker269. [DOI] [PubMed] [Google Scholar]
- 49.[No authors listed]. Preliminary criteria for the classification of systemic sclerosis (scleroderma). Subcommittee for scleroderma criteria of the American Rheumatism Association Diagnostic and Therapeutic Criteria Committee. Arthritis Rheum. 1980;23(5):581–590. doi: 10.1002/art.1780230510. [DOI] [PubMed] [Google Scholar]
- 50.LeRoy EC, et al. Scleroderma (systemic sclerosis): classification, subsets and pathogenesis. J Rheumatol. 1988;15(2):202–205. [PubMed] [Google Scholar]
- 51.de Hoon MJ, Imoto S, Nolan J, Miyano S. Open source clustering software. Bioinformatics. 2004;20(9):1453–1454. doi: 10.1093/bioinformatics/bth078. [DOI] [PubMed] [Google Scholar]
Associated Data
This section collects any data citations, data availability statements, or supplementary materials included in this article.


