

Abstract
There is an increasing need in biology and clinical medicine to robustly and reliably measure tens to hundreds of peptides and proteins in clinical and biological samples with high sensitivity, specificity, reproducibility, and repeatability. Previously, we demonstrated that LC-MRM-MS with isotope dilution has suitable performance for quantitative measurements of small numbers of relatively abundant proteins in human plasma and that the resulting assays can be transferred across laboratories while maintaining high reproducibility and quantitative precision. Here, we significantly extend that earlier work, demonstrating that 11 laboratories using 14 LC-MS systems can develop, determine analytical figures of merit, and apply highly multiplexed MRM-MS assays targeting 125 peptides derived from 27 cancer-relevant proteins and seven control proteins to precisely and reproducibly measure the analytes in human plasma. To ensure consistent generation of high quality data, we incorporated a system suitability protocol (SSP) into our experimental design. The SSP enabled real-time monitoring of LC-MRM-MS performance during assay development and implementation, facilitating early detection and correction of chromatographic and instrumental problems. Low to subnanogram/ml sensitivity for proteins in plasma was achieved by one-step immunoaffinity depletion of 14 abundant plasma proteins prior to analysis. Median intra- and interlaboratory reproducibility was <20%, sufficient for most biological studies and candidate protein biomarker verification. Digestion recovery of peptides was assessed and quantitative accuracy improved using heavy-isotope-labeled versions of the proteins as internal standards. Using the highly multiplexed assay, participating laboratories were able to precisely and reproducibly determine the levels of a series of analytes in blinded samples used to simulate an interlaboratory clinical study of patient samples. Our study further establishes that LC-MRM-MS using stable isotope dilution, with appropriate attention to analytical validation and appropriate quality control measures, enables sensitive, specific, reproducible, and quantitative measurements of proteins and peptides in complex biological matrices such as plasma.
Biology and clinical medicine are increasingly in need of methods to robustly and reliably measure many tens to hundreds of peptides and proteins in a given sample with high sensitivity, specificity, and reproducibility. Targeted mass spectrometry (MS) methods offer biologists and clinical researchers an ever-increasing suite of experimental approaches and data analysis tools to accomplish this task without the need for immunoassays (1–4). With rapid advances in sample processing, instrument hardware and data acquisition software over the past 10 years, liquid chromatography multiple reaction monitoring mass spectrometry (LC-MRM-MS) using stable-isotope-labeled peptide standards has matured into a robust approach for peptide-based protein quantification. This approach is available to any laboratory with access to a triple quadrupole mass spectrometer interfaced with a high performance LC system. Ever increasing refinement of targeted LC-MS methods has positioned this technique as an attractive workflow for verification of candidate protein biomarkers in the clinical arena, as well as biology (5–26). Achievable limits of quantification (LOQs) can be in the ng/ml to low μg/ml range with coefficients of variation (CVs)1 <20%, which are suitable for verification studies in clinical or biological contexts (5, 9, 14, 18, 26, 27). Furthermore, coupling peptide immunoaffinity enrichment with LC-MRM-MS allows for limits of detection (LODs) that approach those of ELISA assays (low pg/ml) (28–30) and intra- and interlaboratory CVs of <15% (31).
Despite numerous reports describing the application of LC-MRM-MS for quantification of target peptides, questions remain about the sensitivity, specificity, reproducibility, quantitative precision, and accuracy of the measurements as well as the transferability of the methods and assays across laboratories. These questions are driven, in part, by the lack of methodological detail or rigorous analytical validation of targeted MS measurements in many published studies, preventing readers from understanding how well the assays work or to be able to implement the described assays in their own laboratories (10). Since 2005, the Clinical Proteomics Technology Assessment for Cancer (CPTAC) network of the National Cancer Institute has had, as one area of focus, the evaluation, refinement, and application of LC-MRM-MS methodology for peptide-based verification of proteins and their modifications in biofluids and tissue. Our efforts have focused on making these assays more precise, accurate, reproducible, and transferable between different laboratories, expertise levels, and LC-MS instrument platforms with the goal of widespread adoption initially by the proteomics community but ultimately also by the clinical laboratory and biology communities. Previously, we demonstrated the reproducibility and transferability of peptide-based MRM assays across eight laboratories (5) by measuring levels of 10 signature peptides representing seven proteins that were spiked across a defined concentration range (1–500 fmol/μl) into neat human plasma. The study was performed in three phases whereby each phase introduced additional sources of variability in sample preparation and instrumental analyses. In the final phase, which included all sources of variability, including proteolytic digestion, the median interlaboratory CV of the eight peptides consistently detected was ≤20% across the concentration range tested. This study demonstrated the implementation of a targeted, quantitative, and multiplexed LC-MRM-MS assay across multiple laboratories to reproducibly measure a small number of proteins present at moderate to high abundance (≥2–6 μg/ml in plasma) yielding CVs in an acceptable range for biomarker verification studies (10, 27, 32).
Here, we significantly expand upon our previous work, detailing critical steps in the assay development phase essential for successful development of highly multiplexed MRM assays, including the use of an SSP (33) to monitor LC-MRM-MS performance during assay development to detect and correct problems early. We also highlight key advances in hardware and software that we have incorporated into the current design that became available since our initial study. The present study utilized eight different LC-MS instrument configurations in 11 separate laboratories on a total of 14 individual systems to target and quantitatively measure >100 peptides from a total of 34 proteins, including 27 that are cancer relevant (Table I). Similar considerations on a smaller scale have been recently discussed using protein and peptide standards as part of quality control for large quantitative studies (34). In our study, sensitivity for proteins in plasma was increased into the low- to subnanogram/ml level by one-step immunoaffinity depletion as well as gradient optimization to maximize the chromatographic resolution in the sample matrix. Use of heavy-labeled protein internal standards added to samples prior to processing greatly improved the accuracy of protein-level quantification. Intra- and interlaboratory reproducibility sufficient for most biological studies as well as for candidate protein biomarker verification was achieved. Overall, this study demonstrates that highly multiplexed MRM-MS based assays can, with appropriate attention to experimental design, analytical validation, and suitable quality control measures, be implemented by multiple laboratories to provide sensitive, specific, reproducible, and quantitative measurements of proteins and peptides of clinical and biological interest in complex biological matrices, specifically plasma.
Table I. List of 34 proteins for which MRM-MS assays were developed and the heavy-isotope labeled internal standard (SIS) peptides used.a Peptides annotated with an asterisk (96 of 115) were detected at all sites used throughout the data analysis.
| SwProt | Protein description | Synthetic internal standard 13C/N15 peptidesb | E coli expressed L/H proteinc |
|---|---|---|---|
| P09972 | Fructose-bisphosphate aldolase C | ALQASALNAWR*, AEVNGLAAQGK*, ELSDIALR*, TPSALAILENANVLAR*, QVLFSADDR* | +/+ |
| P04083 | Annexin A1 | ALYEAGER*, GTDVNVFNTILTTR*, GVDEATIIDILTK, AAYLQETGKPLDETLK*, TPAQFDADELR* | +/+ |
| P09525 | Annexin A4 | VLVSLSAGGR*, GLGTDEDAIISVLAYR, DEGNYLDDALVR*, GLGTDDNTLIR, GAGTDEGCLIEILASR* | +/+ |
| P20073 | Annexin A7 | LYQAGEGR*, SEIDLVQIK*, GAGTDDSTLVR*, EFSGYVESGLK*, GFGTDEQAIVDVVANR | +/+ |
| Q53G71 | Calreticulin variant (Fragment) | QIDNPDYK*, GLQTSQDAR, FYALSASFEPFSNK*, EQFLDGDGWTSR*, GQTLVVQFTVK | +/+ |
| O00299 | Chloride intracellular channel protein 1 | LHIVQVVCK*, YLSNAYAR*, IEEFLEAVLCPPR*, GVTFNVTTVDTK*, GFTIPEAFR* | +/+ |
| P15311 | Ezrin | IQVWHAEHR*, EDEVEEWQHR*, SGYLSSER*, IALLEEAR*, SQEQLAAELAEYTAK* | +/+ |
| Q16658 | Fascin | YLTAEAFGFK*, FLIVAHDDGR*, YLAPSGPSGTLK*, VTGTLDANR*, LSCFAQTVSPAEK* | +/+ |
| P02792 | Ferritin light chain | LGGPEAGLGEYLFER (R6), KPAEDEWGK (K6) | +/+ |
| P39748 | Flap endonuclease 1 | HLTASEAK, WSEPNEEELIK*, SIEEIVR*, QLQQAQAAGAEQEVEK*, LIADVAPSAIR* | +/+ |
| P09211 | Glutathione S-transferase P | FQDGDLTLYQSNTILR*, YISLIYTNYEAGK, EEVVTVETWQEGSLK*, PPYTVVYFPVR, ASCLYGQLPK* | +/+ |
| Q04760 | Lactoylglutathione lyase | FSLYFLAYEDK*, SLDFYTR*, IAWALSR*, GFGHIGIAVPDVYSACK*, FEELGVK* | +/+ |
| P62993 | Growth factor receptor-bound protein 2 | FNSLNELVDYHR*, FGNDVQHFK*, NYVTPVNR*, ATADDELSFK*, ESESAPGDFSLSVK* | +/+ |
| P04792 | Heat shock protein beta-1 | LFDQAFGLPR*, AQLGGPEAAK*, VSLDVNHFAPDELTVK*, DGVVEITGK*, QLSSGVSEIR* | +/+ |
| Q14116 | Interleukin-18 | EDELGDR, SDIIFFQR*, TIFIISMYK*, ISTLSCENK*, GMAVTISVK* | +/+ |
| P09382 | Galectin-1 | DGGAWGTEQR*, DSNNLCLHFNPR*, FNAHGDANTIVCNSK*, SFVLNLGK*, LPDGYEFK* | +/+ |
| O00151 | PDZ and LIM domain protein 1 | CGTGIVGVFVK, GCTDNLTLTVAR*, VAASIGNAQK*, VWSPLVTEEGK*, DFEQPLAISR* | +/+ |
| P32119 | Peroxiredoxin-2 | GLFIIDGK*, TDEGIAYR*, LSEDYGVLK*, ATAVVDGAFK* | +/+ |
| Q13162 | Peroxiredoxin-4 | DYGVYLEDSGHTLR*, LVQAFQYTDK*, IPLLSDLTHQISK*, QITLNDLPVGR* | +/+ |
| P23297 | Protein S100-A1 | ELLQTELSGFLDAQK (L6) | +/+ |
| P29034 | Protein S100-A2 | ELPSFVGEK* (K6), YSCQEGDK (K6) | +/+ |
| P04271 | Protein S100-B | AMVALIDVFHQYSGR* (R6), ELINNELSHFLEEIK (K6) | +/+ |
| P54727 | UV excision repair protein RAD23 homB | EQVIAALR*, IDIDPEETVK*, ILNDDTALK* | +/+ |
| O76070 | Gamma-synuclein | EQANAVSEAVVSSVNTVATK, EGVVGAVEK*, ENVVQSVTSVAEK*, TVEEAENIAVTSGVVR* | +/+ |
| P09493 | Tropomyosin alpha-1 chain | HIAEDADR, LVIIESDLER*, SIDDLEDELYAQK*, QLEDELVSLQK* | +/+ |
| O00762 | Ubiquitin-conjugating enzyme E2 C | YLQETYSK*, WSALYDVR*, LSLEFPSGYPYNAPTVK*, DPAATSVAAAR*, GISAFPESDNLFK* | +/+ |
| P63279 | SUMO-conjugating enzyme UBC9 | DHPFGFVAVPTK*, GTPWEGGLFK*, DDYPSSPPK*, DWRPAITIK | +/+ |
| P00974 | Pancreatic trypsin inhibitor | AGLCQTFVYGGCR (V5) | +/−d |
| P41160 | Leptin | INDISHTQSVSAK | +/−e |
| P68082 | Myoglobin | LFTGHPETLEK | +/−e |
| P02687 | Myelin basic protein | YLASASTMDHAR (R6), HGFLPR (R6) | +/−e |
| P07288 | Prostate-specific antigen | LSEPAELTDAVK, IVGGWECEK (V5) | +/−e |
| P00433 | Peroxidase C1A | SSDLVALSGGHTFGK | +/−e |
| P02741 | C-reactive protein | GYSIFSYATK, ESDTSYVSLK | +/−e |
a MRM-MS assays were constructed and run for a total of 365 peptides: 125 peptides were unlabeled and derived from synthesis as well as digestion of the light versions of all of the proteins shown. Another 125 peptides were chemically synthesized heavy-labeled versions, and another 115 peptides derived by digestion from the 27 uniformly heavy-labeled proteins.
b Chemically synthesized 13C/N15-labeled peptides used as internal standards; labeled amino acids are indicated in bold. These peptides are labeled on the C-terminal Lys as K8 (13C6, 15N2) or C-terminal Arg as R10 (13C6, 15N4) unless otherwise noted. Exceptions include peptides from ferritin, protein S100-A2, protein S100-B, and myelin basic protein that were labeled with K6 (13C6) Lys or R6 (13C6) Arg. Protein S100-A1 was labeled at an internal Leu, L6 (13C6). Prostate-specific antigen and pancreatic trypsin inhibitor were labeled at an internal Val, V5 (13C5).
c Twenty-seven proteins expressed in E. coli in both natural isotope abundance and uniformly N15-labeled (U-N15) forms. A total of 115 U15N-labeled peptides derived from the heavy labeled proteins were monitored.
d Commercially available unlabeled protein.
e Commercially available unlabeled proteins used as controls (5).
MATERIALS AND METHODS
Materials
A tryptic digest of six bovine proteins in equamolar mix (P/N PTD/00001/63) was purchased from Bruker-Michrom, Inc. (Auburn, CA). Picofrit columns (75 μm inner diameter, 10 μm tip inner diameter) prepacked with ReproSil-Pur C18-AQ resin (3 μm particle size, Dr. Maisch, Germany) were purchased from New Objective (Woburn, MA). Synthetic unlabeled (light) peptides and the corresponding stable-isotope-labeled (heavy) versions were purchased from Thermo Fisher Scientific (San Jose, CA). Twenty-seven proteins were expressed in Escherichia coli in both unlabeled (light) and uniformly 15N-labeled forms and purified for use in this study at Argonne National Laboratories (Table I and Supplemental Table 1). Pooled and filtered (0.2 μm) human K2EDTA plasma was obtained from the National Institute of Standards and Technology (NIST). Plasma delipidation and depletion of the 14 most abundant proteins using the Multiple Affinity Removal System (MARS-14) depletion column (Agilent, Santa Clara, CA) was performed at Caprion Proteomics, Menlo Park, CA (formerly PPD Biomarker Discovery Sciences). Mass spectrometry grade Trypsin Gold was obtained from Promega (Madison, WI). Iodoacetamide, dithiothreitol, and urea were purchased from Sigma Chemical Company.
Synthetic Peptides and Proteins
Peptides were selected from proteins detected in data-dependent experiments in breast cancer samples conducted at the Broad Institute (data not shown) and supplemented with publicly available data in The Global Proteome Machine and the in silico prediction program ESP Predictor (35). Between one and five peptides per protein were selected for synthesis based on the common rules for peptide stability, length, and unique sequence. One hundred twenty-five synthetic peptides were purchased in their unlabeled and labeled form, the latter containing C-terminal arginine and lysine residues as 13C615N4 (R10) and 13C615N2 (K8) analogs, respectively (Table I). Of the 125 synthetic peptides used in this study, 115 peptides represented new, potentially cancer-relevant peptide targets (derived from 27 proteins), while 10 peptides (derived from seven proteins) were previously assayed in Addona et al. (5). Peptide and isotopic purity of the synthetic peptides was estimated to be >98% as determined by LC-UV and MALDI-MS by Thermo Fisher Scientific (San Jose, CA). The concentrations of synthetic peptides and target proteins were determined by amino acid analysis. 1:1 mixtures of the heavy and light versions of each of the proteins were evaluated in two of the study centers by LC-MS/MS following reduction, alkylation, and digestion using the same digestion protocol used for the plasma samples. The observed ratios of released peptides were close to the expected 1:1 ratios. Of course, all peptide and protein LODs, LOQs, and determined amounts of peptides or proteins present are subject to potential inaccuracies of amino acid analysis. Isotopic purity of heavy U-15N-labeled proteins was assessed after tryptic digestion at the Buck Institute for Research on Aging by ESI-MS/MS on a hybrid quadrupole time-of-flight QSTAR Elite mass spectrometer (AB SCIEX, Concord, Canada). For the resulting tryptic U-15N-labeled peptides, comparisons between the observed isotope distributions obtained in the acquired spectra and simulated distributions suggested that the isotopic peptide purity was typically >98%. This process was automated using the Isotope Pattern Calculator (IPC) available at PNNL (http://omics.pnl.gov/software/IPC.php), that was customized further in-house.
Study Phases: Samples, Sample Preparation, and Experimental Setup
Study Phase I
This phase (see Fig. 1) consisted of MRM assay development, including selection, testing, and optimization of peptide transitions, nano-chromatography conditions and LC-MRM operating conditions. Details are found in sections immediately below. Assay development was carried out at six of the participating sites using instrument platforms from four vendors (AB SCIEX, ThermoFisher Scientific, Waters (Milford, MA), and Agilent) prior to distribution of peptide reagents and plasma samples for use in Phases II and III. A range of heavy spike concentrations were evaluated by these groups using a 16-point response curve. From the results obtained, the nine best concentrations for Phases II and III were selected. Conditions for plasma digestion were chosen based on digestion studies of 34 protein standards used in the study. Proteins were spiked into depleted plasma and digested under various conditions, including denaturation with deoxycholate, trifluroethanol, and urea, as well as assessing the subsequent use of two enzymes for digestion (Lys-C/trypsin). The resulting data were evaluated for missed cleavage products and maximized peptide recovery. Digestion with Lys-C in 2 m urea (2 h) followed by dilution of urea to <1 M and addition of trypsin (16 h) was the most reproducible of the methods evaluated, yielding the lowest median % CV for all peptides quantified by SID-MRM-MS. More complete results are described elsewhere (36). Reduction and alkylation conditions were as previously reported (5). All sample kits were centrally prepared at Vanderbilt University and subsequently distributed to each participating site. Reagents and samples are described in Supplemental Document 1.
Fig. 1.

Schematic of the experimental design of the three phases of the study. Phase I consisted of method development and optimization of the sample handling, LC, and MS parameters for peptide detection. Phase II was generation of the peptide-level response curve in which 125 light peptides were spiked into depleted, digested plasma at nine concentrations and 125 13C/15N peptides were spiked in as internal standards and 750 transitions were monitored on the different LC-MRM-MS platforms. Phase III introduced unlabeled (light) and uniformly 15N-labeled proteins into the workflow, which were spiked into depleted plasma to generate a nine-point response curve. Samples were further processed at the individual sites to denature, reduce, alkylate, desalt, and reconstitute the samples with 13C/15N peptide standards for LC-MRM-MS analysis, resulting in a total of 1,095 transitions for each method. Skyline was integral from Phase I through Phase III for transition selection, method building, retention time scheduling, and data integration across the different vendor platforms.
MRM Assay Method Development
MRM-MS transition lists were developed and applied to all 14 participating triple quadrupole mass spectrometers, representing four different vendors (AB SCIEX, ThermoFisher Scientific, Waters, and Agilent). Skyline (37) MRM transition selection for each peptide was performed independently for each instrument configuration. For AB SCIEX and Waters instruments, spectral libraries were built in Skyline from data-dependent acquisitions (on a 4000 QTRAP, a QSTAR Elite, and a QTOF Premier instrument) and peptide search engine results using the BiblioSpec library builder (38). Then, MRM transitions were selected based on the most abundant fragment ions from these discovery platform data. Alternatively, for ThermoFisher and Agilent platforms, the SRM refinement approach (39) was employed on the triple quadrupole MS to determine optimal MRM transitions for each peptide. For each vendor platform, the best five transitions per peptide based on extracted ion current chromatogram peak intensity were selected. Evaluation of interferences from the plasma and from the exogenous peptide spikes was conducted by preparing 3 Light to Heavy (L:H) peptide mixtures in 0.5 μg/μl plasma: 10:1, 1:1, and 1:10, where the concentrations of the light heavy peptides were 1 fmol/μl or 10 fmol/μl to generate the L:H ratios. Each transition was evaluated to ensure the L:H peak area ratio for that sample matched the theoretical ratio in the prepared sample, and if the ratio deviated by more than 10%, the transition was removed from the list. The final MRM assay culminated in the three most abundant and interference-free transitions per peptide (transitions were selected for the unlabeled, 13C/15N-isotopically labeled, and U-15N-isotopically labeled version of each peptide). Collision energy values used were based upon linear regression equations provided in Skyline for each vendor platform (40). The final list of MRM transitions for each platform is listed in Supplemental Table 2. Finally, four different Skyline “Instrument Method templates” documents (transition lists only) were generated, including all specific MRM transition information, and were distributed to instrument operators.
Optimization of Reversed Phase Nanoflow High Performance Liquid Chromatography (NanoHPLC)
Peptide mixtures were separated by on-line reversed phase nanoHPLC systems equipped with autosamplers: specifically, two NanoLC-1D Plus systems, seven NanoLC-2D systems, and two NanoLC_Ultra systems (i.e. one NanoLC_Ultra 1D Plus and one NanoLC_Ultra 2D Plus) from Eksigent Technologies (Dublin, CA), one Ultimate 3000 system from Dionex (Sunnyvale, CA), one nanoAquity system (Waters), and two 1100 series systems (Agilent). Peptide separations were performed on PicoFrit® (New Objective, Woburn, MA) prepacked columns (75 μm inner diameter × 120 mm, 10 μm inner diameter tip) packed with ReproSil-Pur C18-AQ (3 μm particle size and 120 Å pore size) using a flow rate of 300 nl/min. Mobile phase compositions were 0.1% (v/v) formic acid in water (Solvent A) and 90% (v/v) acetonitrile with 0.1% (v/v) formic acid (Solvent B). One microliter injections of the peptide digestion mixtures were separated using a binary gradient of 3–7% B in 3 min, 7–25% B in 27 min, 25–40% B in 7 min, 40–90% B in 3 min, and at 90% B for 4 min. All instrument configurations acquired data using a direct injection configuration setup, with the exception of the Agilent ChipCube-LC instruments that used an HPLC chip containing both precolumn (160 nL) and analytical column (75 μm inner diameter × 150 mm, Zorbax 5 μm or Polaris 3 μm beads). Additional details, including plumbing configurations and autosampler injection routines, are described in the Standard Operating Procedure (SOP) (see Supplemental Documents 1 and 2). Mass spectrometer operating parameters are described in detail in Supplemental Document 3. All MRM transitions are listed in Supplemental Table 2 for each instrument platform. A total of 750 MRM transitions were monitored for Phase II and 1,095 for Phase III.
Study Phase II
The samples analyzed in this phase of the study (see Fig. 1) were prepared centrally at Vanderbilt University. Briefly, samples used to generate a nine-point response curve were prepared in human MARS-14 depleted K2EDTA plasma. The depleted plasma was denatured, reduced and alkylated, digested with Lys-C and trypsin, and desalted according to a standard operating procedure (see Supplemental Document 1). The resulting digested, depleted plasma was spiked with 125 synthetic 12C/14N and corresponding 13C/15N-isotopically labeled internal standard (IS) peptides. Nine concentration point samples were prepared by serial dilution to generate calibration curves spanning a concentration range of 1 amol/μl to 100 fmol/μl (with 1 μl volume on-column) of all light peptides spiked into a 0.5 μg/μl background of the depleted plasma digestion with a constant concentration of 10 fmol/μl of all 13C/15N-isotopically labeled IS peptides. The individual concentrations of the light peptides were 100.00, 23.71, 5.62, 1.33, 0.316, 0.075, 0.018, 0.004, 0.001 fmol/μl (loading 1 μl of sample on-column). The four calibration curves were generated individually. In addition, six samples, referred to as blinded samples, with light peptide concentrations unknown to the instrument operator were provided to each site. The blinded samples were analyzed at the end of each of the four singlicate response curves (see Supplemental Table 3). Phase II sample kits were shipped to the nine participating laboratories (representing 14 LC MSMS instrument configurations). Of the original 11 laboratories involved in Phase II, two were unable to continue with Phase III and were removed from the study. Additional details regarding sample kits, reagents, and sample preparation, including details for digestion, desalting, sample acquisition order, etc. are described in the Phase II SOP (see Supplemental Document 1).
Study Phase III
For Phase III (see Fig. 1), response curves and blinded samples were generated by spiking 27 unlabeled, undigested Argonne National Laboratory (ANL) cancer-relevant target proteins (Table I) and six unlabeled undigested previously characterized proteins (5) into depleted, undigested human K2EDTA plasma. The nine-point response curve for the 27 unlabeled cancer relevant proteins spanned a concentration range of 10 amol/μl to 100 fmol/μl (loading 1 μl of sample on-column) in a background of depleted human K2EDTA plasma (0.5 μg/μl). The six additional unlabeled proteins, used as a digestion reproducibility control, were spiked at a constant concentration such that following digestion and dilution, a final on-column amount of 2.5 fmol equivalent was achieved. In addition, 27 U-15N-labeled proteins were spiked into depleted plasma at a constant concentration so that, after digestion and dilution, it yielded 115 U-15N target peptides at 25 fmol equivalent on-column. Samples were prepared such that, after protein digestion, the individual concentrations of the proteolytically generated light peptides were calculated to be 100, 24, 5.6, 1.3, 0.82, 0.32, 0.075, 0.018, and 0.010 fmol/μl (1 μl injection volume). In addition, six blinded samples with light protein concentrations unknown to the instrument operator at each site were provided and analyzed at the end of each of the four singlicate response curves (see Supplemental Table 3). Phase III sample kits with undigested light and heavy proteins spiked into undigested depleted plasma were prepared at Vanderbilt University and sent to the seven participating laboratories (representing 11 LC-MRM-MS instrument configurations). The samples were digested and desalted at the individual sites. MS operators digested three independent protein calibration sets and blinded samples. Data for the third protein calibration curve were acquired as a technical MS duplicate so that, as in Phase II, there was a total of four LC-MRM-MS acquisition replicates. All instruments operators spiked the 13C/15N-isotopically labeled peptides, post desalt, to yield a final concentration of 10 fmol/μl. At three participating sites the 13C/15N-isotopically labeled peptides were spiked in pre- and post desalt as independent experiments to assess sample loss during desalting. Protein digestion efficiencies were estimated using U-15N-labeled proteins that had been spiked into depleted plasma. Additional details are described in the Phase III SOP (see Supplemental Document 2).
System Suitability Monitoring
Stock solutions (1 pmol/μl per protein) of the commercial predigested “Bovine 6 Protein Mix,” referred to as 6 ProteinMix-QC (33), was prepared at Vanderbilt University. As described in detail in the SOP (see Supplemental Documents 1 and 2), prior to analysis, individual CPTAC sites further diluted the stock solution to a working solution of 50 fmol/μl 6 ProteinMix-QC and monitored prior to and during Phases II and III.
LC-MRM-MS Data Acquisition
Mass spectrometric data were acquired following a comprehensive and well-defined run order of all calibration curves and blinded samples in quadruplicates per study. Run orders also included definition of system suitability acquisitions to track instrument performance throughout the studies. Sample setup, sample and file naming nomenclature, etc. are described in the accompanying SOP (Supplemental Documents 1 and 2). Scheduled, multiplexed LC-MRM-MS acquisition was employed based on the retention times of each peptide monitored. In preparation for the scheduled response curve LC-MRM-MS runs, in which 750 transitions were monitored in one run (Phase II), participating sites monitored all synthetic isotopically labeled peptides with ∼375 transitions (125 peptides with three transitions each) in 6–7 unscheduled LC-MRM-MS runs (∼60 transitions per run, keeping cycle times ∼1 s). Retention times for scheduling were determined empirically using these six/seven runs and were verified by performing a single scheduled LC-MRM-MS run prior to analyzing the response curve samples. Retention times of all peptides were used to generate a single scheduled method with 2 min retention time windows. All method building and data analysis were performed using Skyline.
To minimize instrument-to-instrument variability in chromatography, prepacked PicoFrit columns (New Objective, Woburn, MA) were purchased for all sites except for those using ChipCube ion sources (Agilent), Nanoflex cHiPLC dual column systems (AB SCIEX, Foster City, CA) chip-based column plumbing, and NanoAcquity UHPLC systems (Waters). Sites with alternate hardware configurations were set up to take advantage of best currently available technologies suited to their LC systems (see Supplemental Documents 1–3).
Data Analysis
Skyline was used as a common data analysis platform across sites that fostered sharing of data during acquisition as well as creating final reports from each laboratory. Raw data files were imported into Skyline, which uses the ProteoWizard Data Access Library. The MRM transitions for each peptide were integrated with Skyline to generate extracted ion chromatograms that were then manually adjusted, if necessary. Skyline peak area calculations based on the final, adjusted peak boundaries were used as the primary measure or peptide abundance. Each site performed their own data analyses and Skyline peak boundary adjustments. Skyline custom reports were used to export results from processed MRM data, such as peak areas, peak heights, chromatographic parameters, etc. These data results reports were further processed in R statistical programming language (41) and our own cross-site validation tools to generate further statistical results and graphics.
Statistical and Graphical Methods
Data from MRM-MS experiments were preprocessed and integrated in Skyline and exported as a table in comma-separated value (csv) format. A uniform processing and Skyline export template was used for all MS instruments, which resulted in an output that was instrument independent. Specific data fields were extracted from Skyline and include sample name, peptide sequence, replicate name, retention time, area light, area heavy, full-width-half-maximum peak width, fragment ion, precursor charge, and product m/z. These extracted fields were then processed using custom-developed code written in the R statistical programming language (41). QuaSAR, an open source software algorithm, was used to generate calibration curve regressions and a variety of different plots for each site (http://genepattern.broadinstitute.org/gp/pages/index.jsf?lsid=QuaSAR). This link prompts the user to login at GenePattern; it also provides free registration at the GenePattern website upon choosing “click to register,” then under modules, browse to “Proteomics” then to “Quasar” or search for the “Quasar” module directly. Comprehensive plots were generated to analyze not only the overall statistics, e.g. CV, but also to provide a more detailed understanding of the LC and MS parameters and measurements from replicate to replicate, between sites, and across peptides.
Metrics for Assessing the Performance of the Quantitative MRM Assays
The metrics used for assessing reproducibility of the MRM assays were intra- and interlab precision. Intralab precision was defined as the median CV calculated from replicates of each concentration point for a particular peptide for each site study. Interlab precision was defined as the CV calculated at each concentration point for a particular peptide across all replicates and sites and for each study. Values for CVs were calculated as the ratio of the standard deviation to the mean of the replicate measurements at a given concentration. Both of these assessment metrics were determined based on quadruplicate measurements for a single transition used to calculate LOD and LOQ; see below.
Determination of LOD and LOQ
Limit of detection for all monitored peptides from the nine-point response curve in 0.5 μg/μl depleted plasma were determined as previously described (5, 42). Once the LOD was determined separately for each peptide transition, the LOQ was calculated using the customary relation: LOQ = 3 × LOD (43). The LOD was based on the variance of the blank sample (sample A, digested depleted plasma with the heavy isotope peptides and no analyte spiked in) and the variance of the lowest level spike-in sample (sample B, with analyte at 1 amol/μl). Assuming a type I error rate α = 0.05 for deciding that the analyte is present when it is not, and a type II error rate β = 0.05 for not detecting the analyte when it is present, the LOD was derived as
LOB (limit of blank) was defined as the 95th percentile of the blank A1 samples (44). This was estimated as the mean plus t1-βx SDb, where SDb was the standard deviation in the blank samples, and SDS was the standard deviation of the low-level spike in sample B. For a relatively small number of repeated measurements for sample B, cβ was approximated as t1-β where t1-β is the (1-β) percentile of the standard t distribution on f degrees of freedom, where f is the number of replicates minus 1. Detailed calculations of the various components of the LOD are listed in the QuaSAR LOD/LOQ output tables for each site, which are available on the Panorama webserver for the manuscript.
LOD values are initially calculated for all three transitions monitored for each peptide. The transition with the minimum LOD is chosen as the “best” transition. This transition is used to report LOD and LOQ for inter- and intralab CV calculations.
Digestion and desalt losses are calculated using Phase III data from the three sites where the SIS peptides were spiked in both before and after desalting (pre- and post desalt, respectively). Using the slope of the calibration curve as a representation of overall recovery for a given peptide, we calculate
 |
 |
Percentage loss is calculated by normalizing the respective loss to corresponding total peptide loss (= digestion loss + desalt loss). The results are averaged over the three sites for tabulation (Supplemental Table 8) and visualization (Supplemental Fig. 2).
Public Access to the Data
An ftp server at the National Institute of Standards (NIST) was used by the CPTAC teams for initiating uploads and downloads of all data files. Currently, all raw data associated with this manuscript are uploaded at Chorus (https://chorusproject.org). The processed, quantitative data associated with this manuscript reside at the interactive Panorama webserver: ‘http://proteome.gs.washington.edu/software/panorama/cptac_study9.html’. Posted information includes processed data results and downloadable Skyline documents from all participating sites.
RESULTS
Overview of Experimental Design
The experimental design incorporated three discrete phases (Fig. 1). Phase I consisted of assay development prior to distribution of peptide reagents and plasma samples for use by the participating laboratories. Assay development included gradient optimization, peptide transition selection, optimization of depleted plasma digestion conditions, determination of the heavy peptide spike amount, and a 16-point response curve to select the nine concentrations spanning the linear range and below the LOD for Phases II and III. Assay development was conducted at six of the participating sites and employed instrument platforms from all four vendors.
In Phase II, samples consisting of depleted plasma spiked with increasing amounts of 125 peptides (Table I) from 1 amol to 100 fmol and constant 10 fmol amounts of the heavy-labeled versions of each peptide were distributed in quadruplicate to each participating site as “ready-to-analyze” kits, together with a detailed analysis protocol (Supplemental Document 1). In addition, six samples with four different analyte concentrations (Supplemental Table 3) blinded to the participants were also provided in quadruplicate. Some of the 11 participating sites had multiple instruments in the study, resulting in a total of 14 instruments and eight distinct LC-MS platforms (see Methods and Supplemental Document 3). Each site used a predefined and instrument-specific MRM-MS transition list to establish the retention times of the target peptides in their systems. Response curves were generated on each instrument for each of the quadruplicate sample sets by analyzing the samples from low to high concentration followed by wash and blank runs and then six blinded samples (Supplemental Documents 1 and 2). In addition, all groups also acquired data for a common quality control sample using an SSP (33) before starting analyses and after every 6–8 subsequent LC-MRM-MS runs. Phase II primarily evaluated instrument variability as all sample preparation, including digestion of depleted plasma, which was performed centrally in a single laboratory prior to sample distribution.
In Phase III, variability caused by sample processing and handling and determination of LOD/LOQ were evaluated by having each site reduce, alkylate, and trypsin digest samples spiked with proteins (versus spiked peptides) as the source of the analyte peptides (Fig. 1). Twenty-seven proteins were expressed in E. coli in both unlabeled (light) and uniformly 15N-labeled forms and purified for use in this study at Argonne National Laboratories (Supplemental Table 1). To generate response curves, light proteins were spiked into depleted plasma (0.01–100 fmol/μl) while the U15N-labeled proteins were added as internal standards to evaluate increased accuracy of protein-level quantification when using labeled peptides released from labeled proteins during enzymatic digestion. The labeled proteins were also used to assess the extent of peptide loss during enzymatic digestion (see below and Supplemental Fig. 2 and Supplemental Table 8). Synthetic 13C/15N-labeled versions of all peptide analytes were introduced post desalt of the digest and immediately prior to LC-MRM-MS analysis (analogous to Phase II). The heavy synthetic peptides contain only a single labeled amino acid and have different and readily distinguishable masses and transition ions compared with the peptides derived from the U15N-proteins in which every nitrogen atom in the peptide has been replaced with 15N (Supplemental Table 1).
While peptide standards are typically spiked in prior to the desalting step to account for losses during desalting, (31, 45–49), in this experiment, the peptide standards were spiked post desalt to allow for measurement of percent recovery of targeted peptides from the digested proteins and to assess variability in the reduction, alkylation, and digestion steps within and across laboratories. Therefore, we also calculated the loss and effect on CV for addition of stable isotope-labeled peptides predesalt versus post desalt (see below and Supplemental Fig. 2 and Supplemental Table 8). Six additional unlabeled proteins were added at constant levels to all Phase III plasma samples to serve as process controls (Supplemental Table 1). A separate set of depleted plasma samples containing three different concentrations of the 27 cancer-relevant proteins were also generated, and the spike concentrations of the proteins in these samples were blinded to the participants.
All sample sets were prepared centrally, in triplicate, and shipped to the participating sites. Following the SOP (Supplemental Document 2), each site denatured, reduced, alkylated, trypsin digested, and desalted each sample and then added 13C/15N-labeled peptide standards prior to LC-MRM-MS analysis. The SSP was again used, as described above. All LC-MRM-MS data were integrated at the individual sites using Skyline. Reports were exported from Skyline in a predefined format and further processed in QuaSAR (http://genepattern.broadinstitute.org/gp/pages/index.jsf?lsid=QuaSAR) to determine limits of detection and quantitation, CVs for replicate samples, to construct response curves, and to evaluate data for interferences. All data (raw and processed) were submitted for review using a central ftp site with controlled access at the National Institute of Standards and Technology (NIST).
Assay Development and Ongoing Monitoring of Site Performance
Purified light (12C/14N) and heavy (13C/15N) peptide forms of 125 peptides were used to optimize LC gradient and triple quadrupole transition selection (Q1/Q3) for all instrument platforms (Supplemental Table 2). The sequences of 115 of these peptides were derived from the 27 cancer-relevant proteins while 10 peptides were the same as used in our earlier study (5). Selection of specific peptides to target from each protein to target was based on a combination of empirical data from discovery proteomics experiments (Broad Institute, data not shown), Peptide Atlas, The Global Proteome Machine, and, when empirical data were not available, by using the peptide selection algorithm ESPPredictor [(35), http://www.broadinstitute.org/cancer/software/genepattern/modules/ESPPredictor.html]. In Phase I, three to five transitions per peptide were evaluated for interference in depleted plasma using AuDIT (50), and the three most abundant transitions with the least interference for each peptide were selected to monitor. Protein digestion was optimized to reduce missed cleavage products and achieve maximum peptide recovery (see Methods). The final digestion protocol used both Lys-C and trypsin in tandem (Supplemental Documents 1 and 2). The missed cleavage rate for proteins using the double digestion protocol was determined to be ca. 20% (36).
Not all peptides initially selected and analyzed by LC-MRM-MS were used in the final analyses. Peptide performance was assessed by the following criteria. The peak area of the analyte peptide at the concentration above the calculated LOQ (determined in Phase II) was defined as the minimum acceptable peak area and varied by peptide and instrument. Peptides were excluded if the peak areas of the U15N-labeled peptides derived from the labeled protein standards (Phase III) were smaller than the minimum acceptable peak area. This criterion was applied to maintain consistency in comparing Phase II and Phase III data across the same subset of peptides and to ensure that reliable quantification could be maintained such that the internal standard area was above the LOQ. This resulted in a total of 96 peptides compared across the two study phases (peptides marked with an asterisk in Table I). Data from all peptides are available in Chorus.
In order to be included in the cross-instrument comparison, each data set had to be generated following the SOP (Supplemental Documents 1 and 2) with only minor deviations permitted. In addition, data sets from each instrument were evaluated using the SSP data to ensure instruments were in good working order during each study phase prior to inclusion in data analysis. Thirteen of 14 instruments completed Phase II, while eight instruments completed Phase III. Instruments were excluded from a specific phase of the study based on failing the SSP due to large retention time shifts, retention time scheduling problems, or unacceptably high peak area CVs. In addition to these objective criteria, three instruments did not continue to Phase III because the sites had other commitments and/or lacked funding to continue the studies. Complete data sets for all instruments, regardless of inclusion in data analysis, can be found on Panoramaweb.org (http://proteome.gs.washington.edu/software/panorama/cptac_study9.html).
Limits of Detection and Quantification
The LODs and LOQs were determined from the response curve data generated at each site for the peptides monitored in Phase II and Phase III (Fig. 2, Supplemental Tables 4 and 5). The median peptide LOD ranged from 0.053–0.162 fmol/μl for the 13 instruments in Phase II. For Phase III, the median LODs determined using the synthetic heavy-labeled peptides as internal standards ranged from 0.037 to 0.186 fmol/μl for the eight participating instruments. This corresponds to LODs between 17 ng/ml to 83 ng/ml of protein assuming 100% release efficiency of the analyte peptide from the protein (using average protein MW of 50 kDa). When U15N-labeled proteins were used as internal standards in Phase III, LODs ranged from 0.096 to 0.51 fmol/μl across sites (44–230 ng/ml protein concentration in plasma). This increase in LOD is attributed to higher variability exhibited by the U15N-labeled peptides due to a combination of losses related to proteolytic digestion and losses during desalting.
Fig. 2.
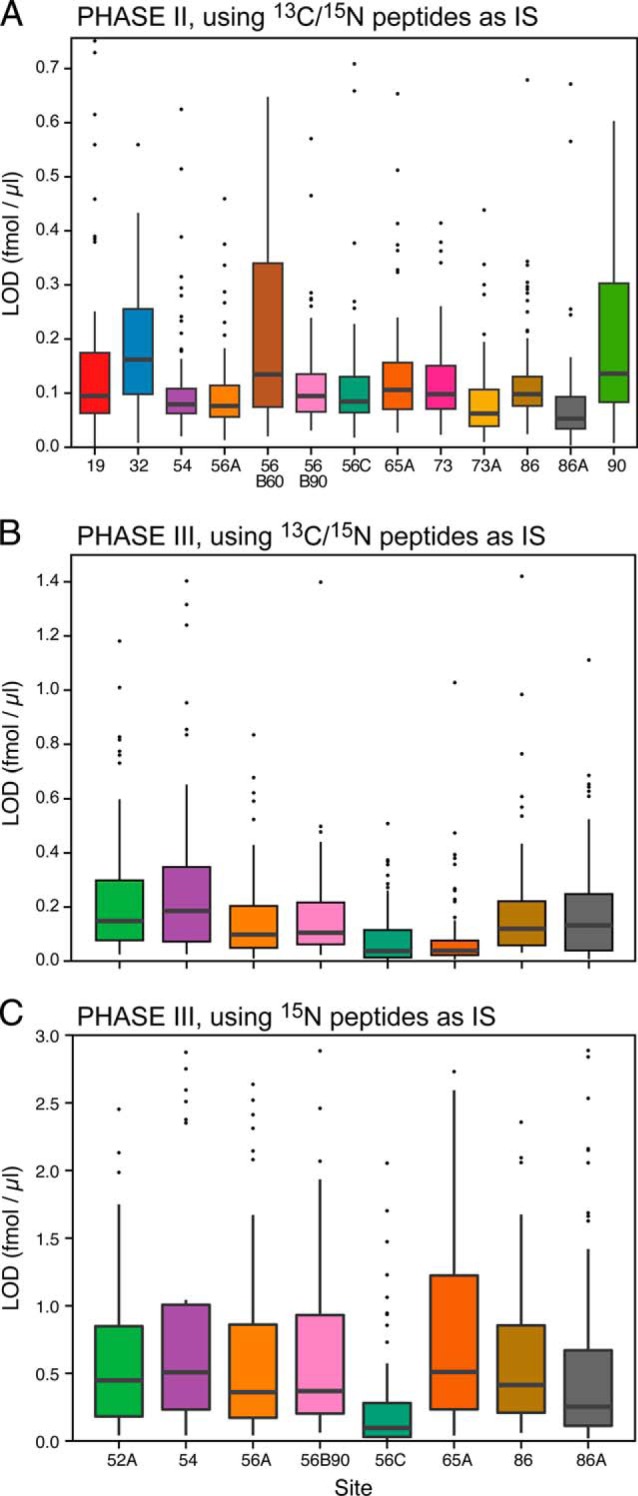
Limit of detection distributions for the peptides monitored at each site. The black bar in each box represents the median peptide LOD at that site, the box represents the interquartile range and the whiskers represents 3x the interquartile range. Outlier peptides are shown as black dots. Panel A represents data from Phase II for the 13 instruments completing the study. Panel B shows the LOD distribution for the eight instruments that completed Phase III, with the synthetic 13C/15N peptides used as internal standards. Panel C represents the same Phase III data, except the U15N-peptides, derived from the U15N-proteins, were used as internal standards.
The LOD and LOQ achieved in Phase II of this study were compared with our previous SID-MRM-MS interlaboratory study in which 10 peptides were monitored in neat plasma digests [(5), Fig. 3, Supplemental Table 6]. Two of the 10 peptides were derived from C-reactive protein, a moderately abundant plasma protein, and are readily detected in all samples (including the depleted plasma blanks) in both studies. Therefore, these peptides were not used for this comparison. The LOD and LOQ of the remaining eight peptides were improved between three- and fivefold in the current study (Phase II) compared with our previous study (5). The improvement in detection sensitivity is likely due to a combination of the increased relative concentration of the monitored analytes in the depleted plasma, decreased interference/ion suppression from removal of peptides from highly abundant proteins that were depleted, and optimization of the chromatographic conditions.
Fig. 3.
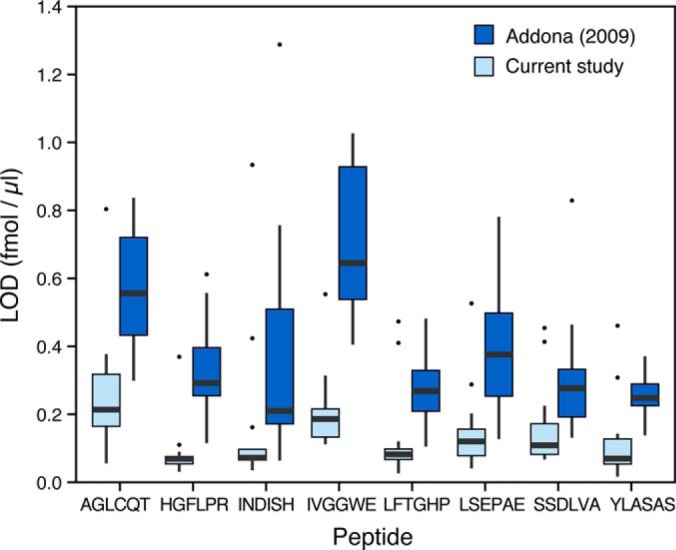
Comparison of the LODs for the eight peptides from the Addona et al., 2009 study and the current study (Phase II). The box and whisker chart represents the distribution of LODs from the participating sites in both studies for the peptide-level spike experiment.
Use of U-15N-labeled Protein Standards for Improved Quantitative Accuracy
The response curves generated in Phase III exhibited less than 100% recovery due to incomplete release of analyte peptides from the light proteins and peptide loss from desalting post digestion (21, 31). To evaluate the potential to compensate for idiosyncrasies in peptide release and recovery post desalt, and to improve quantitative accuracy, we added U15N-labeled proteins as internal standards for 27 of the target proteins (Fig. 1, Phase III). Labeled proteins were spiked into all samples (i.e. response curve concentration points, blank samples containing no added light proteins, and blinded samples) at 25 fmol/μl prior to digestion. Synthetic 13C/15N peptides were introduced post desalt at 10 fmol/μl to monitor for analyte peptide recovery from both the light and heavy versions of the proteins. When the U15N-heavy peptides derived from the U15N-labeled proteins were used to normalize the analyte peptide response (arising from the unlabeled protein spikes), the measured concentration more accurately reflected the protein amounts spiked into the original samples (Supplemental Fig. 1). Using heavy protein internal standards, the median peptide recoveries now approached 100% (97% median value across all sites, all peptides, Supplemental Table 7), reflecting improved quantitative accuracy in the calculation of protein concentration in the samples. In contrast, median peptide recovery using only labeled peptide standards was 34% across the nine instruments due to losses occurring during proteolytic digestion as well as loss of peptide during the desalting step (see below, Supplemental Fig. 2 and Supplemental Table 8).
Evaluation of Peptide Loss Related to Digestion and Desalting and Effects on CV and Determined LOD
Apparent loss of peptides during the proteolytic digestion step can arise by incomplete digestion of the corresponding proteins or by loss of fully released peptides by precipitation, adsorption on surfaces, etc. The loss of peptides during proteolysis was assessed using the peak area ratios of 13C/15N-labeled peptides spiked predesalt to U15N-protein-derived peptide (see Methods). The median peptide loss was ca. 70% (i.e. 30% recovery), with a range in loss from 30% to 99% (i.e. 1% to 70% recovery) across >96 peptides used in the measurement (Supplemental Fig. 2 and Supplemental Table 8).
To determine peptide loss due to desalting post digestion, labeled standard peptides were added pre- and post desalt and analyzed by three participating instruments in Phase III. Comparing peptide recovery in these sample pairs with the peptide derived from the U15N-labeled protein standard enabled estimation of peptide loss due to desalting (see Methods for details). The median loss due to desalting was ca. 27%, with an interquartile range of 13% to 40% (Supplemental Fig. 2 and Supplemental Table 8).
The effects of SIS peptide addition pre- or post desalt on CV and LOD were also evaluated. Addition of peptides post desalt resulted in higher CVs than for predesalt addition (Supplemental Figs. 2A and 2C, respectively). The overall precision is better above the LOQ when the SIS peptide is added predesalt as analyte and SIS peptide are affected equivalently during the desalt step. As expected, the determined median peptide LOD was artificially lower (more sensitive) when SIS peptides were added post desalt because losses occurring due to desalt are not taken into account.
Analysis of Blinded Sample Performance
Sets of samples spiked with peptide (125 peptides in Phase II) and protein (27 proteins in Phase III) analytes at concentrations blinded to the study participants were analyzed at the sites after each response curve replicate in Phases II and III. The blinded sample concentrations were chosen to span a range similar to the response curve (0.1–75 fmol/μl) and were run in pseudo-random order to mimic the analysis of unknown samples in a biomarker verification study. Results are shown in Fig. 4 and Supplemental Table 9 and allow for direct comparison of quantitative accuracy and peptide recovery across the participating laboratories and instruments. In Phase II, the blinded levels of spiked peptides were determined using heavy synthetic peptides (Fig. 4A), with a median concentration of 1.6 fmol/μl and a range of 1.4–2.9 fmol/μl across the 13 instruments for the 1.8 fmol/μl concentration point (Supplemental Table 9). The median CVs of these measurements were below 20% for 11 out of 13 instruments (Supplemental Fig. 3), similar to the CVs achieved in the response curve data for samples with concentrations ≥ 1.8 fmol/μl (see below). Twelve out of 13 instruments demonstrated CVs well below 15% for the 20 fmol/μl blinded samples, and 12 out of 13 had CVs 12% or lower for the 72 fmol/μl point.
Fig. 4.
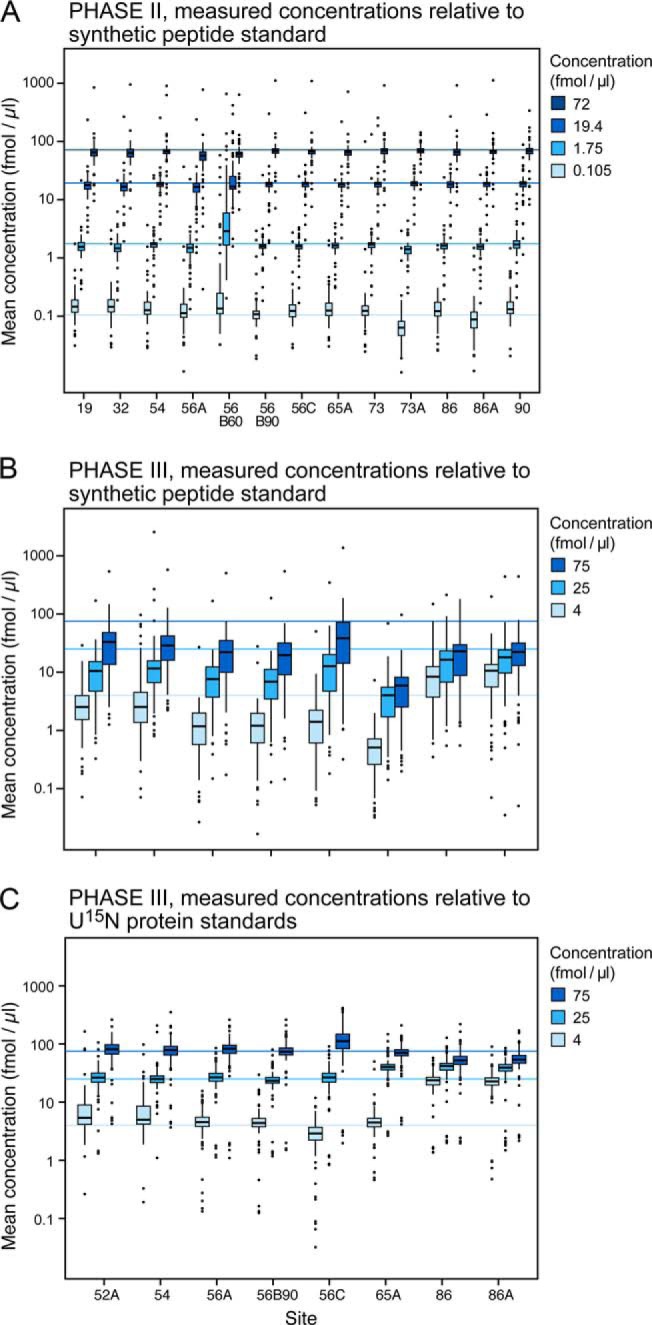
Evaluation of the accuracy of determined concentrations for 125 peptides in the blinded samples. Sets of samples were spiked with peptide (125 peptides in Phase II) and protein (27 proteins in Phase III) analytes at concentrations blinded to the study participants. Blinded samples were analyzed at the sites after each response curve replicate in Phases II and III. Panel A shows the four blinded sample concentrations and the range of peptide concentrations detected at each site in Phase II. Panels B and C represent the Phase III blinded sample concentrations determined when using the 13C/15N peptides (panel B) or the U15N-proteins (panel C) as internal standards. The light blue lines represent the actual concentrations of spiked proteins. Note that in panel B all measured concentrations are well below the actual concentrations when calculating concentration based on spiked heavy peptides. Concentration values are much closer to the actual values in panel C where concentration values were relative to peptides derived from the digestion of U15N-labeled internal standard proteins.
In Phase III, the blinded levels of spiked proteins were determined using both heavy synthetic peptides and U15N-labeled protein standards (Figs. 4B and 4C, respectively). The lowest concentration point was removed based on lack of robust detection at this level in preliminary studies, and the remaining concentrations were adjusted to the three values shown (Figs. 4B and 4C). The median concentrations in Phase III determined at each of the sites for the spiked proteins using synthetic peptides added post desalt were significantly lower than their actual concentrations and lower than the concentrations determined in Phase II (Fig. 4 and Supplemental Table 10. This was expected since the peptides being measured were derived from digestion of proteins (Phase III) in the sample rather than spiked synthetic peptides (Phase II). When peptides derived from the U-15N-labeled proteins were used to calculate concentration, peptide recovery (synonymous with accuracy in this context) improves from 30% to 101% for the 75 fmol/μl sample. For the three sites that also added the heavy-isotope-labeled peptides predesalt, the median recovery calculated using the SIS peptides was 42%. The range of median determined concentrations using protein standards (Fig. 4C) was narrower using heavy protein standards and similar to the peptide spikes alone (Fig. 4A). The CVs for Phase III are significantly higher for all instruments relative to Phase II, reflecting the greater variability introduced by incomplete digestion and/or loss of peptides released from the protein spikes as well as variable losses from desalting (Supplemental Fig. 2).
Inter- and Intralaboratory Reproducibility
The median CV for all peptides at each concentration point for each of the participating laboratories and instruments in Phases II and III of the study are shown in Fig. 5 and Supplemental Table 11. The CV was calculated for 96 peptides monitored in the assay) from the process replicates analyzed (n = 4 for Phase II, n = 4 for Phase III, where three replicates were process, and one was a technical replicate). Overall, Phase II (Fig. 5A) showed a steep decrease (improvement) in intralaboratory CV as the analyte peptide concentrations increased above 0.018 fmol/μl, with nine out of 13 sites having median CVs below 20% at 0.316 fmol/μl. In Phase III (Fig. 5B), where the majority of the sample processing was conducted at the individual sites and protein-level spike-ins were used (with 13C/15N-labeled peptides as internal standards), the variability was higher at the same protein concentrations, most likely due to incomplete digestion and peptide recovery. The median intralaboratory CV values did not fall below the 20% mark until the analyte protein concentration exceeded 1.3 fmol/μl. When the Phase III data were processed using the U15N peptides derived from the U15N-labeled proteins versus the synthetic 13C/15N peptides as internal standards, both intralab and interlab CVs improved above the LOQ, indicating the variability observed in the analyte was also observed in the U15N peptide standard, further supporting addition of an internal standards as far upstream in the workflow as possible (data not shown).
Fig. 5.
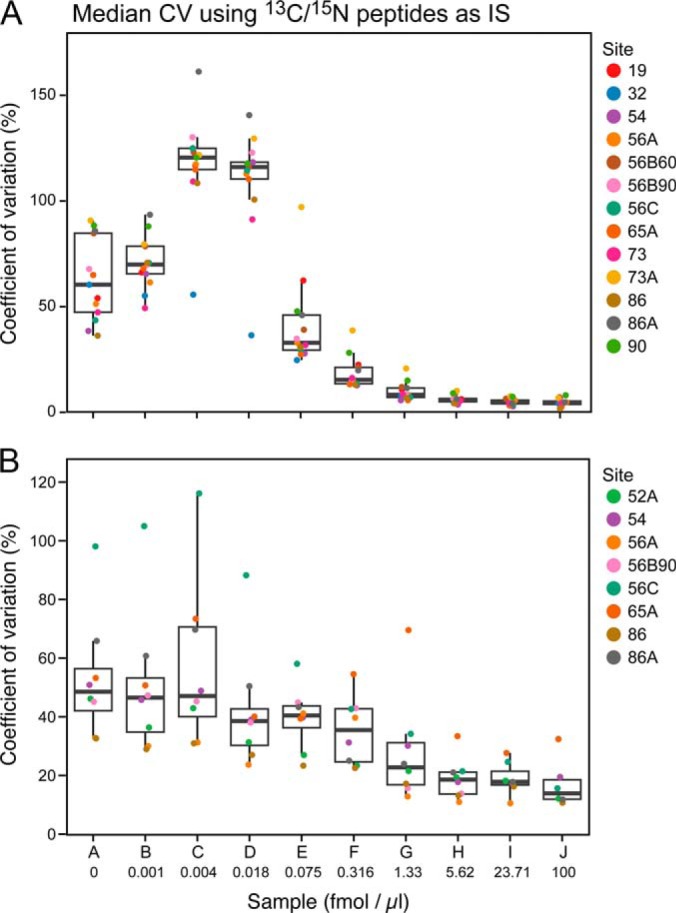
Reproducibility plots for Phases II and III at each sample concentration. The median peak area %CV for 115 peptides is shown for Phase II (panel A) and Phase III (panel B) for all sites.
Interlaboratory CV, which was calculated for each peptide across all sites (n = 52 for Phase II and n = 32 for Phase III) were considerably higher. The median interlaboratory CV by peptide was 18% at the 1.3 fmol/μl concentration point, while in Phase III for the same concentration, it was 45% when using 13C/15N peptide spikes post desalt, and 36% when using U15N-labeled proteins. This calculation of CV takes into account the variability between sites, which was found to be much larger in general, particularly when more sample handling was involved.
Monitoring Digestion and Assay Variability with Protein and Peptide Controls
To better assess variability due to protein digestion and sample handling, six unlabeled proteins were spiked into all Phase III samples above the anticipated peptide LOQs (2.5 fmol/μl) to serve as digestion controls. The six proteins were well-characterized in our previous study (5). In addition eight synthetic 13C/15N-labeled peptides (selected tryptic sequences from the six proteins) were added to the samples post desalt (10 fmol/μl). To assess process variability encompassing the digestion and desalt protocol, the CV of the raw peak areas of the unlabeled digestion control peptides were determined across each sample monitored on each instrument (n = 100–150 sample injections). Figure 6 shows the process variability (black bars) for the eight peptides at one representative site. The majority of the peptides (five out of eight) have raw peak area CVs less than 30% with all peptides having CVs of 35% or less. It is important to note that these CVs are calculated with raw peak area, not peak area ratios as are used for quantification and do not reflect precision of quantification. Variability of raw peak areas tends to be higher when assessed over an experiment due to variations in the LC and MS, whereas use of an internal standard normalizes for this type of variation. Technical variability, reflecting the LC-MRM-MS system performance during the Phase III study, is represented by the gray bars in which the raw peak area CVs of the 13C/15N-labeled peptides are plotted. All eight peptides had CVs less than 25%, indicating good system performance over the course of the study.
Fig. 6.

Technical and process variability assessed from digestion controls and SIS peptide spikes for Phase III. Six unlabeled (light) proteins were spiked into all samples predigestion at a fixed concentration (2.5 fmol/μl). The black bars represent the CV of the raw peak areas arising from the light peptides and reflect the process variability (due to digestion, desalt, and sample handling) of the assay for 40 individual samples. Eight 13C/15N peptides were spiked into all samples post-desalt at 10 fmol/μl. The gray bars represent the CV of the raw peak areas from the 13C/15N peptides and reflect the technical variability of the LC-MRM-MS measurements. Here, we see the process variability exceeds the technical variability for all peptides and is 35% or less, based on raw peak area. The technical variability is 25% or less for all peptides over the measurement of 40 different samples, and is 20% or less for six of the eight peptides. This is an example from Phase III, site 56B90, plotted in Skyline.
DISCUSSION
The current study builds upon the prior work of Addona et al. (5) and focuses on defining and addressing the issues encountered in the development and execution of large-scale SID-MRM-MS assays. Here, we designed the largest interlaboratory investigation to date, targeting 125 peptides derived from 27 cancer-relevant proteins and six control proteins to precisely and reproducibly measure the analytes in human plasma at 11 laboratories using eight distinct instrument platforms and a total of 14 LC-MS instrument configurations. We evaluated additional aspects of SID-MRM-MS assay development and application, including the use of U15N-labeled protein standards for improved quantitative accuracy, use of internal digestion controls to monitor intra- and interlab reproducibility, the benefits of immuno-depletion of abundant plasma proteins to increase sensitivity for quantification of protein analytes, use of prepacked columns and column heaters to improve assay reproducibility, uniform data processing using vendor neutral Skyline and QuaSAR software, and use of a SSP for monitoring instrument performance throughout assay development and study phases.
Successful Assay Development Requires Optimization of Multiple Experimental Parameters
Substantial work was performed to develop the highly multiplexed assay described herein. Digestion studies were performed to select the best digestion conditions for the target proteins in plasma, minimizing missed cleavage products and maximizing peptide recovery. The precursor/product ion pairs used for each of the eight different LC-triple quadrupole configurations were selected and prioritized by ion intensity and lack of interferences. Importantly, the selected transitions were tested in the presence of digested, depleted plasma to account for interferences from the sample matrix or from the standards themselves. Collision energy values were based on previously determined linear regression equations for each vendor platform in Skyline, based on charge and m/z of the analyte peptides (40). Of note, different vendor platforms had different lists of transitions for each target peptide, based on their empirical performance. A highly detailed SOP was written and circulated with the sample kits to ensure uniform sample handling, chromatography, and data acquisition across sites.
Peptide selection was based on both empirical data and predictive algorithms. Between one and five peptides were selected for each protein, adhering to the usual selection rules (see Methods and (2, 35)). However, not all peptides had the same level of performance by LC-MRM-MS, as was revealed during Phase I (method development). We found that we could not rely solely on historic targeted data or predictive algorithms, which necessitated obtaining empirical data on the peptides in the targeted assay. One peptide containing an N-terminal carboxyamidomethyl cysteine (CGTGIVGVFVK, PDLI1) was found to spontaneously cyclize at the N terminus with associated loss of hydrogen (observed in synthetic standard, data not shown, (51)). Other peptides had poor chromatographic peak shapes or were found to elute over several minutes rather than the 7–15 s full-width-half-maximum elution time observed for the majority of the peptides. Additionally, and important in Phase III, not all peptides were efficiently recovered from the protein during digestion and/or post desalting, resulting in a wide range of recoveries of the U-15N peptides generated from the U-15N-protein standards, ranging from “not detected” to ca. 70% recovered. These effects were observed despite having selected proteotypic peptides for MRM assay development based largely on prior observation from discovery proteomics data in the literature. However, neither prior observation of peptides or prediction tools for selecting the best responding peptides from proteins are predictors of completeness of digestion or recovery of peptides post digestion. In the present study, the largest source of loss of target peptides occurred during the digestion step, with a median loss of ca. 70% across the nearly 100 peptides. Losses due to the digestion step were over two times greater than losses due to desalting for the set of peptides studies here. Unfortunately, no predictive tools are available to score peptide release/recovery efficiency during protein digestion, which is the dominant reason for the lower success rate in Phase III.
Assessment of the data and comparing multiple peptides per protein allowed the option to select the best performing peptides for subsequent calculations and site-to-site comparisons for assay metrics. Only those peptides found to have detectable signal in the U-15N-labeled form in Phase III were used for calculations. In Phase III, the peptide-level success rate for detection was 83%, while the success rate for detection and quantification of proteins was 93%, with peptides for 25 out of 27 protein spikes detected and quantified. This likely reflects average success rates for detection in targeted peptide quantification when peptide prediction tools are used and empirical data are not always available.
System Suitability Standards and Rigorous SOPs Can Greatly Reduce Problems in Assay Construction
Highly multiplexed MRM-MS assays require an elevated level of system performance in order to target >100 peptides in a single LC run. Through development and utilization of SOPs and a SSP, we have demonstrated here that highly multiplexed (hundreds of analytes), quantitative assays having high sensitivity, well-defined specificity, and good reproducibility within and across labs can be developed and implemented. Each site was required to acquire SSP data before and throughout the study to track system performance. Instruments that did not maintain good retention time stability, such that peaks were cut off during acquisition or missed entirely and could not provide data for the four process replicates were removed from subsequent data analysis. In addition, instruments with elevated peak area CVs for the SSP, either before (>25%) or throughout the study (>45%), were also eliminated because peak area CV of a SSP has been shown to correlate with assay sensitivity (33). The use of an SSP was evaluated as a proof-of-concept for data evaluation in this study and was new to some of the participating laboratories. As a result, some of the sites failed to examine their SSP data in real-time, leading to deterioration in performance that was not identified and corrected during the study but instead was identified post acquisition. In this study, the most common reasons for repeated sample injections were related to shifting retention times in the chromatography or decreased MS signal due to a dirty ion source. Sites that followed the SOP and used the SSP produced superior results.
Use of Peptide and Protein Controls Allows for Monitoring of Technical and Process Variation
Phase III of our study incorporated two additional controls to monitor both technical and process variability. Technical variation throughout the assay was monitored by determining the raw peak area CV for eight synthetic 13C/15N-labeled peptides that were spiked into each sample at 10 fmol/μl. This approach allowed for monitoring variability introduced through the LC or MS and could be considered analogous to the SSP. Use of Skyline to visualize the data allowed for a quick assessment of variability at the individual sample level based on raw peak area as well as across the entire study (peak area CV, Fig. 6). Technical variability in LC-MS instrument performance between the peptide controls and the SSP were compared for Phase III for the nine different instruments and showed good agreement in general. Sample-to-sample deviations could be caused by either LC-MS issues or fluctuations in the sample background, which could affect the overall signal intensities of the technical control peptides. Any discord between the technical peptide controls and the SSP is likely sample related. Process variability was tracked through the use of six unlabeled protein standards spiked into each sample at low concentrations. Monitoring the peak area ratio between the light, protein-derived peptides, and the heavy synthetic peptides, as well as the raw peak area of the protein-derived peptides, provided an assessment of the variability introduced due to digestion and desalting for each data set. In this study, the same information could be obtained by monitoring the peptides derived from the U15N -labeled proteins, which were compared with the unlabeled process control proteins.
Limits of Quantification Are Substantially Improved by Immunoaffinity Depletion and to a Lesser Extent by Use of Newer LC-MS Technology
Significant improvements in sensitivity were achieved in the present study as compared with our previous work. The principal, but not sole difference, was the use of immunoaffinity depletion of plasma for these studies. Depletion of the top 14 most abundant human plasma proteins decreased sample complexity and allowed a higher effective concentration of monitored analytes to be loaded on the column. LOQs were improved 3–5-fold (at the peptide level) relative to our earlier study while simultaneously increasing assay multiplex level more than 10-fold. The increase in sensitivity afforded by depletion is best captured at the protein level, which was over 20-fold for the seven proteins compared between the studies. This value agrees well with previously published data in which the effects of immuno-depletion were evaluated (19). Optimization of the reversed phase gradient to improve peptide separation likely also contributed to the improvement observed in the LOQ.
The use of newer technologies such as latest generation triple quadrupole mass spectrometers with faster dwell times and brighter ion sources, as well as UHPLC systems for improved chromatographic resolution, did enhance sensitivity but less than we initially anticipated (Fig. 2). The differences in determined LODs between different generations of instruments from different vendors that were operating properly and that met SSP performance criteria generally varied by less than twofold (Fig. 2; instruments not meeting performance standards were excluded from these results). The largest differences (for example, between sites 56C, 65A, and the rest of the sites/instruments) were likely due to small differences in chromatographic configurations. For example, the AB SCIEX 4000 QTRAPs used PicoFrits while the AB SCIEX 5500 QTRAPs used chip columns in parallel with postcolumn attachment to ion source that introduced some band broadening. Another example is the Waters Xevo TQ that employed a trap column while the Waters TQS system did not. We conclude that while use of the newest technology has the potential to improve sensitivity, signal-to background biological noise remained the principal limiter on assay sensitivity. The two methods that have been clearly demonstrated to decrease biological noise while retaining high analyte signal are fraction MRM (fMRM) and Stabel Isotope Standard Capture with Anti-Peptide Antibodies (SISCAPA) also referred to as immunoMRM (9, 19, 28–31).
Reproducibility of Assays Within and Across Sites
The variability observed at each site (intralaboratory CV) was found to range from 13 to 39% (median of 15% across sites) at the 0.316 fmol/μl concentration point for the 13 sites in Phase II. The interlaboratory CV, calculated according to Hoofnagle (52) was 31% at the 1.3 fmol/μl concentration point when using U15N-labeled protein standards. The variability observed in Phase II is a measurement of technical variability in the LC-MS platforms used at each site and was found to be improved over that found in our previous study. This improvement can be attributed to several factors implemented in this study, including a more rigorous SOP, the use of prepacked columns and column heaters, and close monitoring of instrument performance using an SSP, which when combined will minimize technical variability. Phase III variability was higher (58% at 0.316 fmol/μl and 46% at 1.3 fmol/μl) than in Phase II, which was not surprising considering that reduction, alkylation, digestion, and other sample handling steps were performed at each instrument site rather than centrally. Use of the U15N-labeled proteins improved variability for many peptides as compared with the 13C/15N-labeled peptides (42% at 0.316 fmol/μl and 31% at 1.3 fmol/μl), further supporting their use for both precise and accurate quantification by LC-MRM-MS.
Samples were immunoaffinity depleted of abundant plasma proteins at a single site prior to further analysis (see Methods). Therefore, variability that could be introduced by the abundant protein depletion step was not directly measured. Assessing the contribution of this step to the variability would have required additional experiments involving depletion of all process replicates in Phase III samples at each protein concentration at each of the sites. While time and funding were limiting factors preventing us from evaluating this step in the current study, several published studies have evaluated the reproducibility of column-based abundant protein depletion and have found it to be robust and reproducible. The Smith Laboratory at PNNL evaluated protein recovery and depletion efficiency using the IgY-12 column from Sigma, alone (53) or in combination with a second column that removes an additional ca. 50–60 proteins (so-called “Supermix” strategy (54)). In both cases, the reproducibility of process replicates was <20% based upon the number of proteins identified and spectral counting (n = 5). The Carr Laboratory (55) used IgY-12 column depletion and peptide fractionation prior to SID-MRM-MS to quantify low-level candidate cardiovascular biomarkers in plasma from multiple patients and multiple time points/patient. They found the total process variability (%CV), including that introduced by SCX-based peptide fractionation prior to MRM, to range from <1% to a maximum of 35% across three process replicates of 24 samples. This degree of variability is similar to, and no higher than, the intra- and interlaboratory CVs presented here as well as that reported in our previous interlaboratory study (5). Together, these prior studies suggest that minimal additional variation is introduced within laboratories by use of column-based abundant protein depletion methods. Factors that could affect interlaboratory reproducibility include incomplete wash and regeneration steps and lot-to-lot variability of the depletion columns. One impact of incomplete depletion could be a change in the LOD/LOQ for some analytes caused by ion suppression from peptides derived from abundant proteins that were not adequately depleted. However, unless detection of the analyte was near the noise level in the MS, such variation in depletion would not likely result in either a failure to be able to detect the analyte or in the ability to quantify that analyte relative to the heavy internal standard peptide as both analyte and labeled standard would be affected equally by any ion suppression. Protein analytes partially bound to proteins targeted by the depletion column could also have their levels change in the depleted plasma sample. In such a case, the values measured for peptides from that protein could be lower than for a properly operating column.
Use of Labeled Internal Standard Proteins Improves Quantitative Accuracy
This is the largest study to date utilizing U15N-labeled proteins as internal standards for protein quantification. The U15N-labeled proteins were expressed and purified using the same process as the unlabeled proteins used in this study and, in all regards, should behave quite similarly. An added benefit to using heavy-labeled proteins as internal standards is the ability to monitor multiple peptides from each protein. In cases where digestion is incomplete, resulting in missed cleaved peptides, or in cases where additional peptides from the protein would strengthen the statistics of the measurement, as long as the heavy-labeled protein behaves the same way as the endogenous protein, the additional peptide forms can be readily monitored. Such experiments are especially tractable using instruments with high resolution, accurate mass capabilities where the accurate mass measurement of the precursor and the fragments significantly improve the confidence of the analyses, and selection and optimization of transitions are not necessarily required (15, 56).
Blinded samples were incorporated in our study to model real-world sample analysis such as would be encountered in a biomarker verification study and to evaluate consistency of results across laboratories. The accuracy obtained in Phase III of the study, where laboratories did all sample processing themselves, was 101% when using the U15N-labeled proteins for normalization. While use of heavy-labeled proteins in the present study greatly improved quantitative accuracy for measurement of the light versions of the same proteins also expressed in E. coli, their use in general for quantification of endogenous proteins may not be as accurate. Discrepancies could arise as a result of modifications (e.g. cleavage forms, posttranslational modifications, etc.) present in the endogenous protein that are not present in the heavy-labeled protein standard. In studies where accuracy is a requirement, demonstrations of parallelism of the internal standard to the endogenous protein in the sample matrix should be carried out (10).
When heavy-labeled proteins are not available, using synthetic 13C/15N-labeled peptides is the next best option and is likely a necessity for quantification of most posttranslational modifications, which are difficult or impossible to recapitulate accurately in a recombinant protein. However, SIS peptides added post digestion and predesalt cannot account for variability in peptide recovery from the digestion step. Peptide recovery from the digestion step ranged from 1% to 70% for the 96 peptides in the present study. While it makes sense to avoid peptides that are predicted to have a higher miscleavage propensity (i.e. double basics at either end of the peptide or acidic residues in close proximity to the cleavage sites), such miscleaved peptides are not necessarily recovered to a lesser extent from the digest than peptides that are predicted to be fully tryptic (57). A miscleaved form may be the dominant form of the peptide released from the protein and/or it may have solubility properties that are superior to that of the fully tryptic. Adding SIS peptides or “wing peptides” to the sample predigest (47, 58) may improve accuracy when using heavy labeled peptides as substitutes for labeled proteins.
While uniformly 15N-labeled proteins are commonly synthesized for NMR (59), they are not the ideal choice for heavy-labeled protein reference standards for mass spectrometry. The mass shift relative to the unlabeled peptide varied depending on the number of nitrogen atoms per peptide. Shorter peptides with lysine at the C terminus tend to have precursor masses that are close (<2 amu) to the 13C/15N-labeled synthetic peptides. This makes the internal standard peptide difficult to distinguish from the analyte peptide on instruments like triple quadrupole MS systems that use relatively wide (0.4 to >1.0 mass unit) precursor selection windows. In addition, the monoisotopic (M+H)+ peptide masses were typically not the dominant precursor ions derived from the intact proteins that had isotopic purities of >98% (Supplemental Fig. 4 and Supplemental Table 12). In future studies, the proteins would ideally be produced with only specific amino acid residues labeled (e.g. 13C/15N-labeled lysine and arginine) at very high isotopic purity to minimize underlabeled forms of each peptide as well as allow for fixed mass shifts for each peptide.
In conclusion, this study explored the feasibility of developing and implementing a highly multiplexed SID-MRM-MS assay targeting 125 peptides in depleted plasma on 14 different triple quadrupole instrument platforms. Improved LOQs were achieved through the use of depleted plasma, LC gradient optimization, and reduced sample load per injection. Reproducibility was improved over our previous study due to addition of a SSP and the use of prepacked columns and column heaters as well as protein internal standards. Improved quantitative accuracy was achieved through the use of U15N-labeled proteins and addition of the synthetic 13C/15N-labeled peptide standards earlier in the sample handling workflow. The use of Skyline made it possible to develop targeted assays on all instrument platforms and integrated data for further processing and analyses in QuaSAR. We demonstrated the ability to use proteins and synthetic peptides as process and technical controls that can be used in any type of targeted experiment to assess and track variability from sample to sample throughout a study. The evaluation and rigorous testing, in addition to development of tools and technologies to improve the precision and accuracy of SID-MRM-MS resulted in a plethora of data for benchmarking targeted MRM-MS workflows as well as developing additional computational tools for analysis.
Supplementary Material
Footnotes
Author contributions: S.E.A., B.S., L.J.Z., S.C.H., N.S., E.K., and S.A.C. designed the research; S.E.A., B.S., L.J.Z., M.A., S.A., M.B., M.G., V.H., J.M.H., H.I., A.J., H.K., J.L., P.R., P.S., S.J.S., D.S., J.R.W., and S.Z. performed the research; L.J.Z., L.M., K.S., and C.W. contributed new reagents or analytic tools; S.E.A., B.S., D.M., L.J.Z., S.C.H., B.M., M.P.C., N.S., and S.A.C. analyzed the data; S.E.A., B.S., D.M., L.J.Z., S.C.H., and S.A.C. wrote the paper; C.R.K., L.M., M.M., H.R., C.H.B., S.J.F., B.W.G., D.C.L., M.J.M., T.A.N., A.G.P., F.E.R., and P.T. provided useful discussions.
* This work was supported by grants from the National Cancer Institute (U24 CA126476, U24 126477, U24 126480, U24 CA126485, and U24 126479), part of NCI Clinical Proteomic Technologies for Cancer (http://proteomics.cancer.gov) initiative. A component of this initiative is the Clinical Proteomic Technology Assessment for Cancer (CPTAC) Network and teams, which include the Broad Institute of MIT and Harvard (with the Fred Hutchinson Cancer Research Center, Massachusetts General Hospital, the University of North Carolina at Chapel Hill, the University of Victoria, and the Plasma Proteome Institute), Memorial Sloan-Kettering Cancer Center (with the Skirball Institute at New York University), Purdue University (with Monarch Life Sciences, Indiana University, Indiana University-Purdue University Indianapolis, and the Hoosier Oncology Group), University of California, San Francisco (with the Buck Institute for Research on Aging, Lawrence Berkeley National Laboratory, and the University of Texas M.D. Anderson Cancer Center), and Vanderbilt University School of Medicine (with the University of Texas M.D. Anderson Cancer Center, the University of Washington, and the University of Arizona). The Broad Institute and Fred Hutchinson Cancer Research Center also acknowledge CPTAC phase 2 support from NCI U24CA160034, as does the Vanderbilt University Center via NCI U24CA159988. The UCSF CPTAC team gratefully acknowledges the support of the Canary Foundation for providing funds to purchase a 4000 QTRAP mass spectrometer. The Vanderbilt CPTAC team was additionally supported by Cooperative Agreement No. 70NANB9H9001 from the National Institute of Standards and Technology. B.W.G. and T.A.N. acknowledge support from the NCRR Shared Instrumentation program for instrumentation (grants S10 RR027953 and S10 RR024604, respectively). The NCI CPTAC also supported the work by the National Institute of Statistical Sciences.
 This article contains supplemental material Supplemental Figs. 1–4, Supplemental Tables 1–12, and Supplemental Documents 1–3.
1 The abbreviations used are:
- coefficient of variation
- (CV)
- Clinical Proteomics Technology Assessment for Cancer
- (CPTAC)
- limit of detection
- (LOD)
- limits of quantification
- (LOQ)
- LC-MRM-MS
- liquid chromatography multiple reaction monitoring mass spectrometry
- Stable isotope dilution
- (SID)
- stable isotope-labeled peptides as internal standards
- (SIS peptides)
- Stable Isotope Standard Capture with Anti-Peptide Antibodies
- (SISCAPA)
- SOP
- Standard Operating Procedure
- SSP
- system suitability protocol.
REFERENCES
- 1. Grebe S. K., Singh R. J. (2011) LC-MS/MS in the clinical laboratory—Where to from here? Clin. Biochem. Rev. 32, 5–31 [PMC free article] [PubMed] [Google Scholar]
- 2. Picotti P., Aebersold R. (2012) Selected reaction monitoring-based proteomics: workflows, potential, pitfalls and future directions. Nature Meth. 9, 555–566 [DOI] [PubMed] [Google Scholar]
- 3. Gillette M. A., Carr S. A. (2013) Quantitative analysis of peptides and proteins in biomedicine by targeted mass spectrometry. Nature Meth. 10, 28–34 [DOI] [PMC free article] [PubMed] [Google Scholar]
- 4. Marx V. (2013) Targeted proteomics. Nature Meth. 10, 19–22 [DOI] [PubMed] [Google Scholar]
- 5. Addona T. A., Abbatiello S. E., Schilling B., Skates S. J., Mani D. R., Bunk D. M., Spiegelman C. H., Zimmerman L. J., Ham A. J., Keshishian H., Hall S. C., Allen S., Blackman R. K., Borchers C. H., Buck C., Cardasis H. L., Cusack M. P., Dodder N. G., Gibson B. W., Held J. M., Hiltke T., Jackson A., Johansen E. B., Kinsinger C. R., Li J., Mesri M., Neubert T. A., Niles R. K., Pulsipher T. C., Ransohoff D., Rodriguez H., Rudnick P. A., Smith D., Tabb D. L., Tegeler T. J., Variyath A. M., Vega-Montoto L. J., Wahlander A., Waldemarson S., Wang M., Whiteaker J. R., Zhao L., Anderson N. L., Fisher S. J., Liebler D. C., Paulovich A. G., Regnier F. E., Tempst P., Carr S. A. (2009) Multi-site assessment of the precision and reproducibility of multiple reaction monitoring-based measurements of proteins in plasma. Nature Biotech. 27, 633–641 [DOI] [PMC free article] [PubMed] [Google Scholar]
- 6. Agger S. A., Marney L. C., Hoofnagle A. N. (2010) Simultaneous quantification of apolipoprotein A-I and apolipoprotein B by liquid-chromatography-multiple-reaction-monitoring mass spectrometry. Clin. Chem. 56, 1804–1813 [DOI] [PMC free article] [PubMed] [Google Scholar]
- 7. Anderson L., Hunter C. L. (2006) Quantitative mass spectrometric multiple reaction monitoring assays for major plasma proteins. Mol. Cell. Proteomics 5, 573–588 [DOI] [PubMed] [Google Scholar]
- 8. Barnidge D. R., Dratz E. A., Martin T., Bonilla L. E., Moran L. B., Lindall A. (2003) Absolute quantification of the G protein-coupled receptor rhodopsin by LC/MS/MS using proteolysis product peptides and synthetic peptide standards. Anal. Chem. 75, 445–451 [DOI] [PubMed] [Google Scholar]
- 9. Burgess M. W., Keshishian H., Mani D. R., Gillette M. A., Carr S. A. (2014) Simplified and efficient quantification of low-abundance proteins at very high multiplex via targeted mass spectrometry. Mol. Cell. Proteomics 13, 1137–1149 [DOI] [PMC free article] [PubMed] [Google Scholar]
- 10. Carr S. A., Abbatiello S. E., Ackermann B. L., Borchers C., Domon B., Deutsch E. W., Grant R. P., Hoofnagle A. N., Hüttenhain R., Koomen J. M., Liebler D. C., Liu T., MacLean B., Mani D. R., Mansfield E., Neubert H., Paulovich A. G., Reiter L., Vitek O., Aebersold R., Anderson L., Bethem R., Blonder J., Boja E., Botelho J., Boyne M., Bradshaw R. A., Burlingame A. L., Chan D., Keshishian H., Kuhn E., Kinsinger C., Lee J. S., Lee S. W., Moritz R., Oses-Prieto J., Rifai N., Ritchie J., Rodriguez H., Srinivas P. R., Townsend R. R., Van Eyk J., Whiteley G., Wiita A., Weintraub S. (2014) Targeted peptide measurements in biology and medicine: Best practices for mass spectrometry-based assay development using a fit-for-purpose approach. Mol. Cell. Proteomics 13, 907–917 [DOI] [PMC free article] [PubMed] [Google Scholar]
- 11. Cerciello F., Choi M., Nicastri A., Bausch-Fluck D., Ziegler A., Vitek O., Felley-Bosco E., Stahel R., Aebersold R., Wollscheid B. (2013) Identification of a seven glycopeptide signature for malignant pleural mesothelioma in human serum by selected reaction monitoring. Clin. Proteomics 10, 16. [DOI] [PMC free article] [PubMed] [Google Scholar]
- 12. Drabovich A. P., Jarvi K., Diamandis E. P. (2011) Verification of male infertility biomarkers in seminal plasma by multiplex selected reaction monitoring assay. Mol. Cell. Proteomics 10, M110 004127 [DOI] [PMC free article] [PubMed] [Google Scholar]
- 13. Gerber S. A., Rush J., Stemman O., Kirschner M. W., Gygi S. P. (2003) Absolute quantification of proteins and phosphoproteins from cell lysates by tandem MS. Proc. Natl. Acad. Sci. U.S.A. 100, 6940–6945 [DOI] [PMC free article] [PubMed] [Google Scholar]
- 14. Huttenhain R., Soste M., Selevsek N., Rost H., Sethi A., Carapito C., Farrah T., Deutsch E. W., Kusebauch U., Moritz R. L., Nimeus-Malmstrom E., Rinner O., Aebersold R. (2012) Reproducible quantification of cancer-associated proteins in body fluids using targeted proteomics. Sci. Translation. Med. 4, 142ra194. [DOI] [PMC free article] [PubMed] [Google Scholar]
- 15. Jaffe J. D., Wang Y., Chan H. M., Zhang J., Huether R., Kryukov G. V., Bhang H. E., Taylor J. E., Hu M., Englund N. P., Yan F., Wang Z., Robert McDonald E., 3rd, Wei L., Ma J., Easton J., Yu Z., deBeaumount R., Gibaja V., Venkatesan K., Schlegel R., Sellers W. R., Keen N., Liu J., Caponigro G., Barretina J., Cooke V. G., Mullighan C., Carr S. A., Downing J. R., Garraway L. A., Stegmeier F. (2013) Global chromatin profiling reveals NSD2 mutations in pediatric acute lymphoblastic leukemia. Nature Genetics 45, 1386–1391 [DOI] [PMC free article] [PubMed] [Google Scholar]
- 16. Jia Y., Wu T., Jelinek C. A., Bielekova B., Chang L., Newsome S., Gnanapavan S., Giovannoni G., Chen D., Calabresi P. A., Nath A., Cotter R. J. (2012) Development of protein biomarkers in cerebrospinal fluid for secondary progressive multiple sclerosis using selected reaction monitoring mass spectrometry (SRM-MS). Clin. Proteomics 9, 9. [DOI] [PMC free article] [PubMed] [Google Scholar]
- 17. Jin L. L., Tong J., Prakash A., Peterman S. M., St-Germain J. R., Taylor P., Trudel S., Moran M. F. (2010) Measurement of protein phosphorylation stoichiometry by selected reaction monitoring mass spectrometry. J. Proteome Res. 9, 2752–2761 [DOI] [PubMed] [Google Scholar]
- 18. Kennedy J. J., Abbatiello S. E., Kim K., Yan P., Whiteaker J. R., Lin C., Kim J. S., Zhang Y., Wang X., Ivey R. G., Zhao L., Min H., Lee Y., Yu M. H., Yang E. G., Lee C., Wang P., Rodriguez H., Kim Y., Carr S. A., Paulovich A. G. (2014) Demonstrating the feasibility of large-scale development of standardized assays to quantify human proteins. Nature Meth. 11, 149–155 [DOI] [PMC free article] [PubMed] [Google Scholar]
- 19. Keshishian H., Addona T., Burgess M., Kuhn E., Carr S. A. (2007) Quantitative, multiplexed assays for low abundance proteins in plasma by targeted mass spectrometry and stable isotope dilution. Mol. Cell. Proteomics 6, 2212–2229 [DOI] [PMC free article] [PubMed] [Google Scholar]
- 20. Kuhn E., Wu J., Karl J., Liao H., Zolg W., Guild B. (2004) Quantification of C-reactive protein in the serum of patients with rheumatoid arthritis using multiple reaction monitoring mass spectrometry and C-13-labeled peptide standards. Proteomics 4, 1175–1186 [DOI] [PubMed] [Google Scholar]
- 21. Kuzyk M. A., Smith D., Yang J., Cross T. J., Jackson A. M., Hardie D. B., Anderson N. L., Borchers C. H. (2009) Multiple reaction monitoring-based, multiplexed, absolute quantitation of 45 proteins in human plasma. Mol. Cell. Proteomics 8, 1860–1877 [DOI] [PMC free article] [PubMed] [Google Scholar]
- 22. Rebecca V. W., Wood E., Fedorenko I. V., Paraiso K. H., Haarberg H. E., Chen Y., Xiang Y., Sarnaik A., Gibney G. T., Sondak V. K., Koomen J. M., Smalley K. S. (2014) Evaluating melanoma drug response and therapeutic escape with quantitative proteomics. Mol. Cell. Proteomics 13, 1844–1854 [DOI] [PMC free article] [PubMed] [Google Scholar]
- 23. Soste M., Hrabakova R., Wanka S., Melnik A., Boersema P., Maiolica A., Wernas T., Tognetti M., von Mering C., Picotti P. (2014) A sentinel protein assay for simultaneously quantifying cellular processes. Nature Meth. 11, 1045–1048 [DOI] [PubMed] [Google Scholar]
- 24. Surinova S., Hüttenhain R., Chang C. Y., Espona L., Vitek O., Aebersold R. (2013) Automated selected reaction monitoring data analysis workflow for large-scale targeted proteomic studies. Nature Protocols 8, 1602–1619 [DOI] [PubMed] [Google Scholar]
- 25. Tan C. T., Croft N. P., Dudek N. L., Williamson N. A., Purcell A. W. (2011) Direct quantitation of MHC-bound peptide epitopes by selected reaction monitoring. Proteomics 11, 2336–2340 [DOI] [PubMed] [Google Scholar]
- 26. Végvári A., Sjödin K., Rezeli M., Marko-Varga G. (2013) Quantification of human kallikrein-2 in clinical samples by selected reaction monitoring. J. Proteome Res. 12, 4612–4616 [DOI] [PubMed] [Google Scholar]
- 27. Paulovich A. G., Whiteaker J. R., Hoofnagle A. N., Wang P. (2008) The interface between biomarker discovery and clinical validation: The tar pit of the protein biomarker pipeline. Proteome Clin. Appl. 2, 1386–1402 [DOI] [PMC free article] [PubMed] [Google Scholar]
- 28. Anderson N. L., Anderson N. G., Haines L. R., Hardie D. B., Olafson R. W., Pearson T. W. (2004) Mass spectrometric quantitation of peptides and proteins using stable isotope standards and capture by anti-peptide antibodies (SISCAPA). J. Proteome Res. 3, 235–244 [DOI] [PubMed] [Google Scholar]
- 29. Whiteaker J. R., Zhao L., Anderson L., Paulovich A. G. (2010) An automated and multiplexed method for high throughput peptide immunoaffinity enrichment and multiple reaction monitoring mass spectrometry-based quantification of protein biomarkers. Mol. Cell. Proteomics 9, 184–196 [DOI] [PMC free article] [PubMed] [Google Scholar]
- 30. Whiteaker J. R., Zhao L., Lin C., Yan P., Wang P., Paulovich A. G. (2012) Sequential multiplexed analyte quantification using peptide immunoaffinity enrichment coupled to mass spectrometry. Mol. Cell. Proteomics 11, M111.015347. [DOI] [PMC free article] [PubMed] [Google Scholar]
- 31. Kuhn E., Whiteaker J. R., Mani D. R., Jackson A. M., Zhao L., Pope M. E., Smith D., Rivera K. D., Anderson N. L., Skates S. J., Pearson T. W., Paulovich A. G., Carr S. A. (2012) Interlaboratory evaluation of automated, multiplexed peptide immunoaffinity enrichment coupled to multiple reaction monitoring mass spectrometry for quantifying proteins in plasma. Mol. Cell. Proteomics 11, M111.013854. [DOI] [PMC free article] [PubMed] [Google Scholar]
- 32. Rifai N., Gillette M. A., Carr S. A. (2006) Protein biomarker discovery and validation: The long and uncertain path to clinical utility. Nature Biotech. 24, 971–983 [DOI] [PubMed] [Google Scholar]
- 33. Abbatiello S. E., Mani D. R., Schilling B., Maclean B., Zimmerman L. J., Feng X., Cusack M. P., Sedransk N., Hall S. C., Addona T., Allen S., Dodder N. G., Ghosh M., Held J. M., Hedrick V., Inerowicz H. D., Jackson A., Keshishian H., Kim J. W., Lyssand J. S., Riley C. P., Rudnick P., Sadowski P., Shaddox K., Smith D., Tomazela D., Wahlander A., Waldemarson S., Whitwell C. A., You J., Zhang S., Kinsinger C. R., Mesri M., Rodriguez H., Borchers C. H., Buck C., Fisher S. J., Gibson B. W., Liebler D., Maccoss M., Neubert T. A., Paulovich A., Regnier F., Skates S. J., Tempst P., Wang M., Carr S. A. (2013) Design, implementation and multisite evaluation of a system suitability protocol for the quantitative assessment of instrument performance in liquid chromatography-multiple reaction monitoring-MS (LC-MRM-MS). Mol. Cell. Proteomics 12, 2623–2639 [DOI] [PMC free article] [PubMed] [Google Scholar]
- 34. Gallien S., Bourmaud A., Domon B. (2014) A simple protocol to routinely Assess the uniformity of proteomics analyses. J. Proteome Res. 13, 2688–2695 [DOI] [PubMed] [Google Scholar]
- 35. Fusaro V. A., Mani D. R., Mesirov J. P., Carr S. A. (2009) Prediction of high-responding peptides for targeted protein assays by mass spectrometry. Nature Biotech. 27, 190–198 [DOI] [PMC free article] [PubMed] [Google Scholar]
- 36. Markell J., Abbatiello S. E., Zimmerman L. J., Whitwell C. A., Rudnick P., Stein S. E., Schilling B., Hall S. C., Carr S. A. (2011) Investigation of denaturants on digestion efficiency and reproducibility: What are the “best” digestion conditions? (WP34, #635). Proceedings of the 59th Annual ASMS Conference on Mass Spectrometry Allied Topics, Denver, CO [Google Scholar]
- 37. MacLean B., Tomazela D. M., Shulman N., Chambers M., Finney G. L., Frewen B., Kern R., Tabb D. L., Liebler D. C., MacCoss M. J. (2010) Skyline: an open source document editor for creating and analyzing targeted proteomics experiments. Bioinformatics 26, 966–968 [DOI] [PMC free article] [PubMed] [Google Scholar]
- 38. Frewen B., MacCoss M. J. (2007) Using BiblioSpec for creating and searching tandem MS peptide libraries. Current Protocols in Bioinformatics. 13:13.7.1–13.7.12 [DOI] [PubMed] [Google Scholar]
- 39. Bereman M. S., MacLean B., Tomazela D. M., Liebler D. C., MacCoss M. J. (2012) The development of selected reaction monitoring methods for targeted proteomics via empirical refinement. Proteomics 12, 1134–1141 [DOI] [PMC free article] [PubMed] [Google Scholar]
- 40. MacLean B., Tomazela D. M., Abbatiello S. E., Zhang S., Whiteaker J. R., Paulovich A. G., Carr S. A., MacCoss M. J. (2010) Effect of Collision Energy Optimization on the Measurement of Peptides by Selected Reaction Monitoring (SRM) Mass Spectrometry. Anal. Chem. 82, 10116–10124 [DOI] [PMC free article] [PubMed] [Google Scholar]
- 41. (2011) R Development Core Team. R: A Language and Environment for Statistical Computing, R Foundation for Statistical Computing, Vienna, Austria [Google Scholar]
- 42. Currie L. A. (1968) Limits for qualitative detection and quantitative determination. Application to radiochemistry. Anal. Chem. 40, 586–593 [Google Scholar]
- 43. Marazzi A. (1993) Algorithms, Routines and S Functions for Robust Statistics, CRC Press, Boca Raton, FL [Google Scholar]
- 44. Armbruster D. A., Pry T. (2008) Limit of blank, limit of detection and limit of quantitation. Clin. Biochem. Rev. 29, S49–S52 [PMC free article] [PubMed] [Google Scholar]
- 45. Brun V., Dupuis A., Adrait A., Marcellin M., Thomas D., Court M., Vandenesch F., Garin J. (2007) Isotope-labeled protein standards: Toward absolute quantitative proteomics. Mol. Cell. Proteomics 6, 2139–2149 [DOI] [PubMed] [Google Scholar]
- 46. Kito K., Ito T. (2008) Mass spectrometry-based approaches toward absolute quantitative proteomics. Curr. Genomics 9, 263–274 [DOI] [PMC free article] [PubMed] [Google Scholar]
- 47. Picard G., Lebert D., Louwagie M., Adrait A., Huillet C., Vandenesch F., Bruley C., Garin J., Jaquinod M., Brun V. (2012) PSAQ standards for accurate MS-based quantification of proteins: From the concept to biomedical applications. J. Mass Spec. 47, 1353–1363 [DOI] [PubMed] [Google Scholar]
- 48. Shuford C. M., Sederoff R. R., Chiang V. L., Muddiman D. C. (2012) Peptide production and decay rates affect the quantitative accuracy of protein cleavage isotope dilution mass spectrometry (PC-IDMS). Mol. Cell Proteomics 11, 814–823 [DOI] [PMC free article] [PubMed] [Google Scholar]
- 49. Singh R., Crow F. W., Babic N., Lutz W. H., Lieske J. C., Larson T. S., Kumar R. (2007) A liquid chromatography-mass spectrometry method for the quantification of urinary albumin using a novel 15N-isotopically labeled albumin internal standard. Clin. Chem. 53, 540–542 [DOI] [PubMed] [Google Scholar]
- 50. Abbatiello S. E., Mani D. R., Keshishian H., Carr S. A. (2010) Automated detection of inaccurate and imprecise transitions in peptide quantification by multiple reaction monitoring mass spectrometry. Clin. Chem. 56, 291–305 [DOI] [PMC free article] [PubMed] [Google Scholar]
- 51. Krokhin O. V., Ens W., Standing K. G. (2003) Characterizing degradation products of peptides containing N-terminal Cys residues by (off-line high-performance liquid chromatography)/matrix-assisted laser desorption/ionization quadrupole time-of-flight measurements. Rapid Commun. Mass Spec. 17, 2528–2534 [DOI] [PMC free article] [PubMed] [Google Scholar]
- 52. Hoofnagle A. N. (2010) Peptide lost and found: internal standards and the mass spectrometric quantification of peptides. Clin. Chem. 56, 1515–1517 [DOI] [PubMed] [Google Scholar]
- 53. Liu T., Qian W. J., Mottaz H. M., Gritsenko M. A., Norbeck A. D., Moore R. J., Purvine S. O., Camp D. G., 2nd, Smith R. D. (2006) Evaluation of multiprotein immunoaffinity subtraction for plasma proteomics and candidate biomarker discovery using mass spectrometry. Mol. Cell. Proteomics 5, 2167–2174 [DOI] [PMC free article] [PubMed] [Google Scholar]
- 54. Qian W. J., Kaleta D. T., Petritis B. O., Jiang H. L., Liu T., Zhang X., Mottaz H. M., Varnum S. M., Camp D. G., 2nd, Huang L., Fang X. M., Zhang W. W., Smith R. D. (2008) Enhanced detection of low abundance human plasma proteins using a tandem IgY12-SuperMix immunoaffinity separation strategy. Mol. Cell. Proteomics 7, 1963–1973 [DOI] [PMC free article] [PubMed] [Google Scholar]
- 55. Addona T. A., Shi X., Keshishian H., Mani D. R., Burgess M., Gillette M. A., Clauser K. R., Shen D., Lewis G. D., Farrell L. A., Fifer M. A., Sabatine M. S., Gerszten R. E., Carr S. A. (2011) A pipeline that integrates the discovery and verification of plasma protein biomarkers reveals candidate markers for cardiovascular disease. Nature Biotech. 29, 635–643 [DOI] [PMC free article] [PubMed] [Google Scholar]
- 56. Rochat B., Peduzzi D., McMullen J., Favre A., Kottelat E., Favrat B., Tissot J. D., Angelillo-Scherrer A., Bromirski M., Waldvogel S. (2013) Validation of hepcidin quantification in plasma using LC-HRMS and discovery of a new hepcidin isoform. Bioanalysis 5, 2509–2520 [DOI] [PubMed] [Google Scholar]
- 57. Brownridge P., Beynon R. J. (2011) The importance of the digest: Proteolysis and absolute quantification in proteomics. Methods 54, 351–360 [DOI] [PubMed] [Google Scholar]
- 58. Neubert H., Muirhead D., Kabir M., Grace C., Cleton A., Arends R. (2013) Sequential protein and peptide immunoaffinity capture for mass spectrometry-based quantification of total human beta-nerve growth factor. Anal. Chem.y 85, 1719–1726 [DOI] [PubMed] [Google Scholar]
- 59. Takahashi H., Shimada I. (2010) Production of isotopically labeled heterologous proteins in non-E. coli prokaryotic and eukaryotic cells. J. Biomol. NMR 46, 3–10 [DOI] [PubMed] [Google Scholar]
Associated Data
This section collects any data citations, data availability statements, or supplementary materials included in this article.