Abstract
Fern spore is a good single-cell model for studying the sophisticated molecular networks in asymmetric cell division, differentiation, and polar growth. Osmunda cinnamomea L. var. asiatica is one of the oldest fern species with typical separate-growing trophophyll and sporophyll. The chlorophyllous spores generated from sporophyll can germinate without dormancy. In this study, the spore ultrastructure, antioxidant enzyme activities, as well as protein and gene expression patterns were analyzed in the course of spore germination at five typical stages (i.e. mature spores, rehydrated spores, double-celled spores, germinated spores, and spores with protonemal cells). Proteomic analysis revealed 113 differentially expressed proteins, which were mainly involved in photosynthesis, reserve mobilization, energy supplying, protein synthesis and turnover, reactive oxygen species scavenging, signaling, and cell structure modulation. The presence of multiple proteoforms of 25 differentially expressed proteins implies that post-translational modification may play important roles in spore germination. The dynamic patterns of proteins and their encoding genes exhibited specific characteristics in the processes of cell division and rhizoid tip growth, which include heterotrophic and autotrophic metabolisms, de novo protein synthesis and active protein turnover, reactive oxygen species and hormone (brassinosteroid and ethylene) signaling, and vesicle trafficking and cytoskeleton dynamic. In addition, the function skew of proteins in fern spores highlights the unique and common mechanisms when compared with evolutionarily divergent spermatophyte pollen. These findings provide an improved understanding of the typical single-celled asymmetric division and polar growth during fern spore germination.
Plant cell polar establishment and tip growth are crucial for plant growth and development. Pollen tubes and root hairs have been well studied as models of polar growth. Germinating fern spores constitute a new single-cell model for investigating molecular networks underlying asymmetric cell division, differentiation, and polar growth (1). Fern spores contain a center nucleus and are usually surrounded by a thick two-layer spore coat, which is composed of a thin cellulose-contained intine and a thick decorated extine of sporopollenin (2). Fern spore coat has a characteristic trilete or monolete aperture, a region where the rhizoid emerges when the spore starts to germinate (3). In most ferns, spores are rehydrated in darkness, and then the nucleus migrates from the center to the proximal part of spores in the direction of gravity (4, 5). After exposure to light, fern spores perform first asymmetric mitosis, resulting in the formation of a small rhizoidal cell and a large protonemal cell (4). Subsequently, the two cells develop along divergent pathways. The small cell elongates out of the spore aperture to form the rhizoid by tip growth, and the large protonemal cell divides again to give rise to the photosynthetic prothallus of fern gametophyte (4). When compared with the germination of spermatophyte pollen, spore germination of diverse fern species is somewhat more complex and dependent on various environmental factors, including light quality/intensity, gravity, calcium, phytohormones (e.g. auxin, gibberellin, abscisic acid, jasmonic acid, and ethylene), temperature, as well as spore density and nutrient in the culture medium (6).
Some common genes were found in fern spores and Arabidopsis pollen and seeds, and they reveal conserved features of fern spore germination (7, 8, 9). The establishment of spore polarity is oriented by gravity and regulated by several genes of phytochromes (PHYs) and cryptochromes (CRYs) (9, 10, 11), as well as dark-germinating 1 gene (12). Importantly, G protein-mediated Ca2+ signaling and nitric oxide (NO) signaling pathways are proved to be crucial in gravity response and the polarity establishment upon spore germination (1, 7, 13). In addition, several genes (e.g. plasma membrane (PM)-type Ca2+-ATPase, calmodulin-2, no pollen germination 1, Rop GTPase, and phospholipase D) are supposed to function in Ca2+ and NO signaling pathways (1, 7, 14). Moreover, the Rop GTPase 1 was shown to regulate F-actin assembly, and an annexin-like protein was involved in tip-oriented exocytosis in a calcium-dependent manner during the initiation and growth of fern rhizoids (15). This result implies the dynamics of cytoskeleton and vesicle trafficking are critical for spore germination. In addition, the changes of several genes encoding RNA localization-related protein, transcription factor, ribosome protein, translation initiation factor, and ubiquitin-related protein indicate that specific gene expression, protein synthesis and turnover are active in the germinating spores (8, 16). Some induced genes/proteins in germinating spores from several fern species, such as a vicilin-like gene in Matteuccia struthiopteris (17), a aconitase gene in Ceratopteris richardii (2), and two glyoxylate cycle-related enzymes (isocitrate lyase and malate synthase) in Onoclea sensibilis and Anemia phyllitidis (18, 19), imply that reserve (e.g. storage globulin and lipid) mobilization is crucial for energy and material supply during spore germination (19).
We suspect the fine-tuned process of fern spore germination is more complex than the germination of pollen and seeds. Especially, the germination of chlorophyll-containing spores is a sophisticated cellular process on the basis of both heterotrophic and autotrophic metabolisms. Ferns represent a class of ancient groups, which typically have much higher chromosome number and larger genome than spermatophyte, leading to the difficulty of obtaining mutants (20). In addition, many ferns have exceedingly long generation time, which made the genetic analysis difficult (21). Although it has been proposed that dormant fern spores have presynthesized mRNAs and proteins in storage for the early stage of spore germination (4), our knowledge about the detailed genetic and molecular mechanism of fern spore germination is still lacking. Osmunda cinnamomea L. var. asiatica belongs to the Osmundaceae family, which is one of the oldest fern groups. O. cinnamomea L. plant has the separate-growing trophophyll and sporophyll. Mature spores (MSs) generated from sporophyll contain a number of chlorophylls and germinate immediately without dormancy (22). It is a good material for the study of chlorophyll-containing spore germination.
State-of-the-art proteomics technologies have enabled high throughput and sensitive analyses using single cell types of plants, such as pollen grains, eggs, guard cells, trichomes, and root hairs (23). Especially, proteomics have been applied to the investigation of pollen and seed germination, which have provided comprehensive information for understanding the cellular processes of polar growth and reserve mobilization in germination systems (24–29). In the present study, we aim to discover the molecular mechanisms for understanding the cytological and physiological features of mature and germinating spores of O. cinnamomea L. using proteomic approaches. Our results provide novel insights into the molecular processes including photosynthesis, reserve mobilization, reactive oxygen species (ROS) homeostasis, cytoskeleton dynamic, vesicle trafficking, and protein synthesis and turnover in the course of spore germination.
EXPERIMENTAL PROCEDURES
Collection and In Vitro Germination of Mature O. cinnamomea Spores
O. cinnamomea L. var. asiatica grew naturally in Yabuli Village of Shangzhi County, Heilongjiang Province, China. About 10 days before spore maturation, plants with root matrix were collected from the field and cultured in pots in a growth chamber. MSs were collected directly when they were released from sporangium of sporophyll. The fresh MSs were stored at 4 °C until used. Spores (0.03 g) were sown and germinated in 10 ml of modified Knop's sterile liquid medium. The medium contained 0.8 g Ca(NO3)2·4H2O, 0.2 g KNO3, 0.2 g KH2PO4, and 0.2 g MgSO4·7H2O per liter of distilled water. Illumination (photon flux of 55–60 μmol·m−2·s−1) was initiated right after the spores were allowed to imbibe in darkness for 12 h in order to synchronize spore germination. The cultures were maintained at 25 ± 2 °C with a relative humidity of 50–70%.
Observation of Fern Spore Microstructure and Ultrastructure
To monitor cytological changes of fern spore germination, the mature and germinating spores were stained with toluidine blue and examined under light microscope. In addition, the spores at the different germination stages were stained with 0.2 μg/μl 4,6-diamidino-2-phenylindole (DAPI)1 (Molecular Probes, Eugene, OR) for 25–30 min, followed by the observation of nucleus changes during spore germination under fluorescence microscopy (Axioskop 40 fluorescence microscope, Zeiss, Jena, Germany).
For ultrastructure observation, mature and germinating spores were prefixed in 3% glutaraldehyde, and then fixed with 2% osmic acid for 2 h in darkness at room temperature. After being rinsed in 0.1 m phosphate buffer, samples were dehydrated in acetone, and then embedded in Spurr (Sigma-Aldrich, St. Louis, MO) according to a previous method (30). Sections were cut on an Ultracut E ultramicrotome using a diamond knife and stained with uranyl acetate and lead citrate. Finally, the stained specimens were observed under a transmission electron microscopy (Hitachi 600, Tokyo, Japan).
Biomass and Chlorophyll Content Analysis
For the biomass analysis of spores at different germination stages, fresh weight was measured right after harvesting, and dry weight was determined after dehydration at 60 °C until reaching a constant weight. Water content was estimated as the difference between fresh weight and dry weight divided by the fresh weight (31). The chlorophyll contents were determined using a method described by Lichtenthaler and Wellburn (32).
H2O2 Content Detection and Antioxidant Enzyme Activity Assay
For H2O2 content detection, spore samples were homogenized on ice in 0.1% trichloroacetic acid buffer, and centrifuged at 15,000 × g for 20 min at 4 °C. The supernatant was used for H2O2 content assay. After reacting with potassium iodide, the absorbance was measured at 390 nm. The H2O2 content was determined and calculated according to a standard curve.
For antioxidant enzyme activity assay, spore samples were ground to a fine powder in liquid nitrogen and resuspended in 50 mm phosphate buffer (pH 7.8). After being centrifuged at 15,000 × g for 20 min at 4 °C, the supernatant was collected for enzyme activity assay. The activities of superoxide dismutase (SOD), catalase (CAT), peroxidase (POD), ascorbate peroxidase (APX), glutathione reductase (GR), and glutathione S-transferase (GST) were assayed as previously described (33). The activities of monodehydroascorbate reductase (MDHAR), dehydroascorbate reductase (DHAR), and glutathione peroxidase (GPX) were measured by recording the absorbance changes at 340 nm because of oxidation of NADH (ε = 6.22 mm−1·cm−1), at 265 nm because of the production of oxidized glutathione (GSSG) (ε = 14 mm−1·cm−1), and at 340 nm because of the oxidation of NADPH (ε = 6.22 mm−1·cm−1), respectively. Their activities were subsequently expressed as the amount of NADH oxidized, GSSG produced, and NADPH oxidized per minute per milligram protein, respectively.
Protein Sample Preparation
Spores at various stages of germination were ground to powder in liquid nitrogen with chilled mortar and pestle. After 10 ml of Tris pH 8.8 buffered phenol and 10 ml of extraction buffer (0.1 m Tris-HCl, pH 8.8, 0.9 m sucrose, 10 mm EDTA, 0.4% β-mercaptoethanol) were added, the samples were homogenized for 15 min. The supernatant was collected by centrifugation at 18,000 × g for 20 min at 4 °C, and then precipitated by adding ammonium acetate in methanol and incubated overnight at −20 °C. The precipitant was collected by centrifugation at 20,000 × g for 20 min at 4 °C and rinsed with ammonium acetate in methanol and cold acetone. The resulting pellets were dissolved in a lysis buffer (7 m urea, 2 m thiourea, 4% Nonidet P-40, 13 mm DTT, 2% pharmalyte of pH 4–7) and used for two-dimensional gel electrophoresis (2-DE) immediately or stored at −80 °C. Protein samples were prepared from three independent biological replicates, and protein concentration was determined using a Quant-kit according to the manufacturer's instructions (GE Healthcare, Salt Lake City, UT).
2-DE, Gel Staining, and Image Analysis
Protein samples prepared from spores were diluted in a rehydration buffer containing 7 m urea, 2 m thiourea, 2% Nonidet P-40, 13 mm DTT, 0.5% IPG buffer, pH 4–7, and 0.002% bromphenol blue for gel electrophoresis using a 24 cm, pH 4–7 linear gradient IPG strip (GE Healthcare). IEF was performed using the Ettan IPGphor isoelectric focusing system, following the manufacturer's protocols. The strips were equilibrated with a reduction buffer (6 m urea, 2% SDS, 50 mm Tris-HCl, 30% glycerol, 0.002% bromphenol blue, and 1% DTT) for 15 min, and then with an alkylation buffer (6 m urea, 2% SDS, 50 mm Tris-HCl, 30% glycerol, 0.002% bromphenol blue, and 2.5% iodoacetamide) for 15 min. The second-dimension separations were carried out on 12.5% SDS-PAGE gels using an Ettan DALT Six electrophoresis unit. Low molecular mass protein markers (Fermentas, Burlington, Canada) were co-electrophoresed as molecular mass standards. The experiments were repeated three times using protein samples independently prepared from different samples. The proteins in gels were visualized by Coomassie Brilliant Blue staining, and images were acquired by scanning each stained gel using an ImageScanner III (GE Healthcare) at a resolution of 300 dpi, and then analyzed with ImageMaster 2D software (version 5.0) (GE Healthcare). For quantitative analysis, the volume of each spot was normalized against the total valid spots. Protein spots from three biological replicates with reproducible and statistically significant changes in intensity (greater than 1.5-fold and p < 0.05) were considered to be differentially expressed proteins (DEPs) (26).
Protein Identification and Database Searching
DEP spots were excised from the 2-DE gels and digested with trypsin, according to Dai et al. (26). The MS and MS/MS spectra were acquired on ESI-Q-TOF MS (QSTAR XL, AB Sciex, Framingham, MA) as previously described (33). The peaklist of MS/MS spectra were generated via ProteinPilot 2.0 (AB Sciex), and then were searched against the National Center for Biotechnology Information nonredundant (NCBInr) protein database (http://www.ncbi.nlm.nih.gov/) (5,222,402 sequence entries in NCBI) using the search engine MASCOT (Matrix Science, London, UK) (http://www.matrixscience.com). The taxonomic category was green plants (385,707 sequences). The searching criteria include mass tolerance for precursor ions of 0.3 Da, mass tolerance for fragment ions of 100 ppm, one missed cleavage allowed, carbamidomethylation of cysteine as a fixed modification, and oxidation of methionine as a variable modification. To obtain high confident identification, proteins had to meet the following criteria: the top hits on the database searching report, a probability-based MOWSE score greater than 43 (p < 0.01), and more than two peptides matched with nearly complete y-ion series and complementary b-ion series present.
Protein Classification and Hierarchical Clustering Analysis
Protein functional domains were predicted using the PSI and PHI-BLAST programs (http://www.ncbi.nlm.nih.gov/BLAST/). Combined BLAST alignments with Gene Ontology and knowledge from literatures, proteins were classified into different categories. Self-organizing maps clustering analysis of the protein expression profiles was performed based on the standardization of each data to a mean of 0 and variance of 1 across all samples using GeneCluster software (version 2.0) (Massachusetts Institute of Technology, Cambridge, MA).
Protein Subcellular Location and Protein–Protein Interaction Analysis
The subcellular locations of the DEPs were determined using five internet tools: YLoc (http://abi.inf.uni-tuebingen.de/Services/YLoc/webloc.cgi); LocTree3 (https://rostlab.org/services/loctree3/); ngLOC (http://genome.unmc.edu/ngLOC/index.html); TargetP (http://www.cbs.dtu.dk/services/TargetP/); and Plant-mPLoc (http://www.csbio.sjtu.edu.cn/bioinf/plant-multi/).
The protein–protein interactions were predicted using the web-tool STRING 9.1 (http://string-db.org). The DEP homologs in Arabidopsis were found by sequence BLASTing in TAIR database (http://www.arabidopsis.org/Blast/index.jsp), and then the homologs were subjected to the molecular interaction tool of STRING 9.1 for creating the proteome-scale interaction network.
Total RNA Extraction, Reverse Transcription, and qReal-Time (qRT)-PCR Analysis
Total RNA was isolated from 100 mg homogenized spores using the pBiozol plant total RNA extraction reagent according to the manufacturer's instructions (BioFlux, Hangzhou, China). A 1% agarose gel was run to preliminarily indicate the integrity of the RNA. All RNA samples were quantified and examined for protein contamination (A260 nm/A280 nm ratios) and DNA contamination (A260 nm/A230 nm ratios) using an Eppendorf Biophotometer (Eppendorf, Hamburg, Germany). A first-strand cDNA was prepared from 1 μg of total RNA from each sample using a PrimeScript® RT reagent kit with gDNA Eraser according to the protocols of the manufacturer (Takara Bio, Inc., Otsu, Japan).
The sequence of candidate genes were selected as the best match from the Osmunda lancea EST database (http://blast.ncbi.nlm.nih.gov/Blast/) using a BLASTn program. Specific primer pairs used in qRT-PCR were designed using Primer Premier 5.0 software (Premier Biosoft International, Palo Alto, CA) (supplemental Table S1). qRT-PCR amplification was performed on a 7500 real time PCR system (Applied Biosystems, Foster City, CA) using the UltraSYBR mixture (with Rox I) (CWBio. Co., Ltd., Beijing, China). The amplifications were subjected to an initial denaturation step of 95 °C for 10 min, followed by 40 cycles of 95 °C for 15 s and 60 °C for 1 min. A temperature ramp step was added to the end of the amplification for melting curve analysis, with an initial temperature of 60 °C and a final temperature of 95 °C. The expression levels of different genes were normalized to the constitutive expression level of Ubiquitin 5 (UBQ5). Each qRT-PCR experiment with different primer pairs and/or different templates was replicated three times. The relative gene expression levels were calculated by the 2−ΔΔt method (34).
Statistical Analysis
All results were presented as means ± S.E. of at least three replicates. Data were analyzed by one-way ANOVA using the statistical software SPSS 18.0 (SPSS Inc., Chicago, IL). The treatment mean values were compared by least significant difference post-hoc test. A p value less than 0.05 was considered statistically significant.
RESULTS
The Spore Germination Process
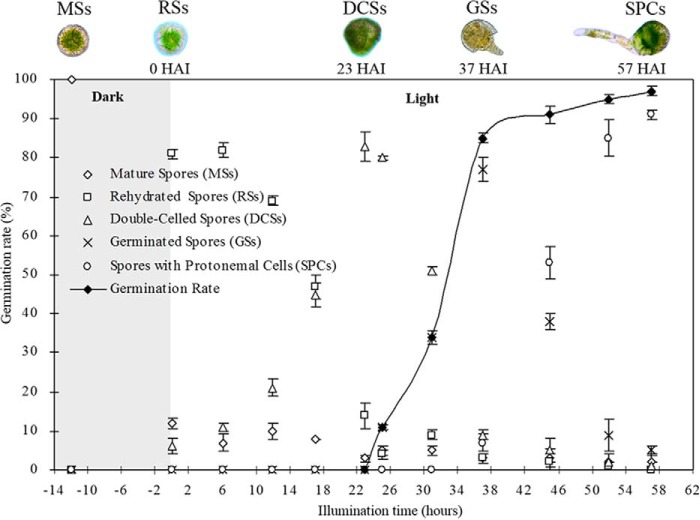
O. cinnamomea L. var. asiatica spores are chlorophyll-containing spores with trilete aperture. To better understand the process of spore germination, fresh MSs were inoculated on Knop's medium. After 12 h dark imbibition, 81.3% spores were fully rehydrated (Fig. 1). The rehydrated spores (RSs) were enlarged and its trilete aperture was open for rhizoid emerging. Under continuous illumination, the spores initiated cell division rapidly. After 23 h illumination, 82.7% spores completed first asymmetric mitosis to form a small cell and a large cell. The germinating spores at this stage were called double-celled spores (DCSs) (Fig. 1). Subsequently, the two cells in spores differentiated along divergent ways. The small cell elongated out of spore from trilete aperture, forming the primary rhizoids by polar growth. After 37 h illumination, 77.3% spores exhibited rhizoids emergence. The spores at this stage were defined as germinated spores (GSs) (Fig. 1). The large cell differentiated as the protonemal cell, which will divide again to give rise to the photosynthetic prothallus. After 57 h light irradiation, 91% spores finished second cell division and grew to a prothallus with two photosynthetic cells and a rhizoid. The spores at this stage were defined as spores with protonemal cells (SPCs) (Fig. 1). During this germination process, the spore germination rate was increased gradually and reached to 95% at SPCs stage.
Fig. 1.
Germination time course of spores from Osmunda cinnamomea L. var. asiatica. Mature spores (MSs) were cultured on Knop's medium. After 12 h dark imbibition, 81.3% spores completed rehydration, and the rehydrated spores (RSs) were enlarged with a trilete aperture opened. Then spores were continuously illuminated. At 23 h after illumination (HAI), 82.7% spores completed first asymmetric mitosis to form a small cell and a large cell, and they were defined as double-celled spores (DCSs). At 37 HAI, 77.3% spores exhibited rhizoids emergence, which were called germinated spores (GSs). Subsequently, 91% spores finished the second cell division at 57 HAI, being defined as spores with protonemal cells (SPCs). In this time course, the spore germination rate was increased gradually and reached to 95% at the stage of SPCs.
Structural Characteristics of Germinating Spores
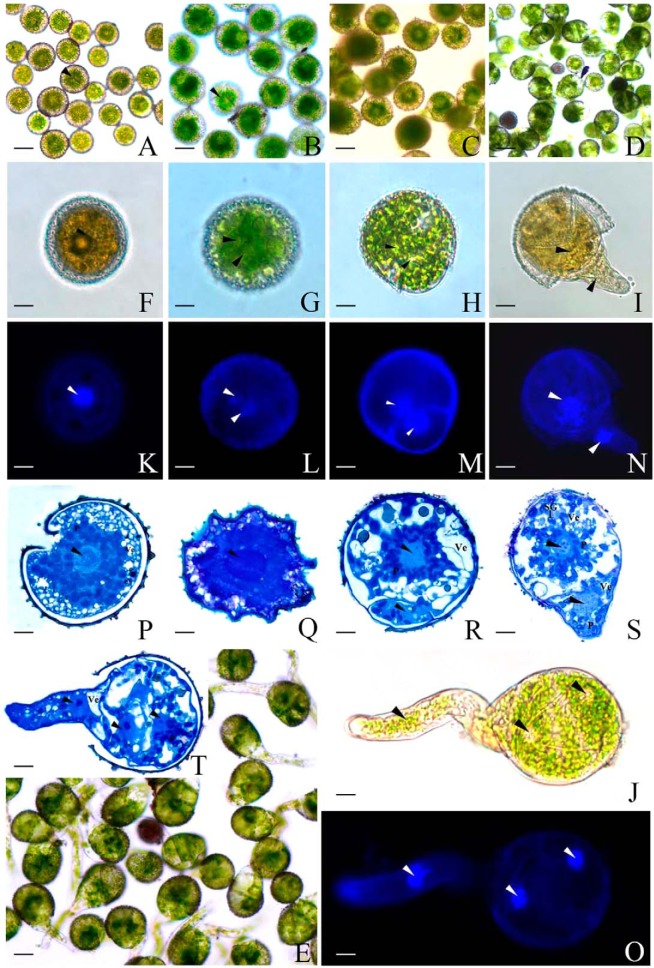
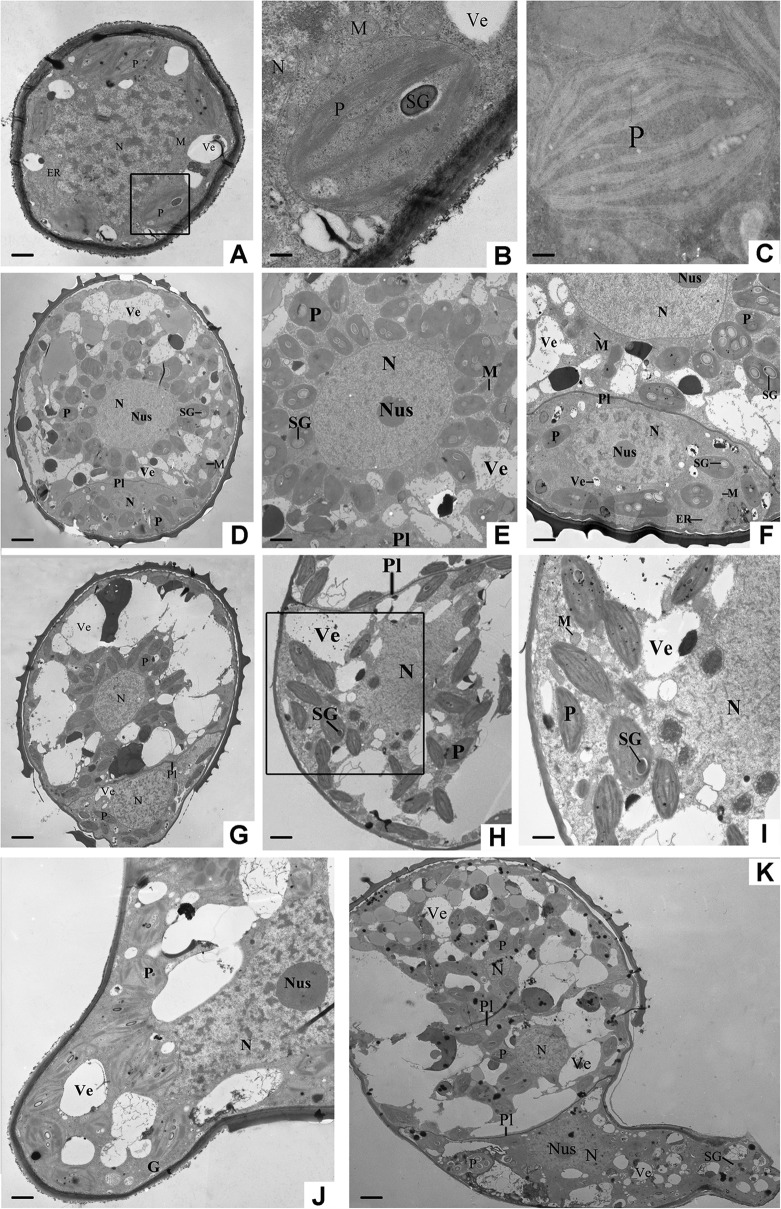
During the process of fern spore germination, a series of important morphological events and cytological changes took place. We observed the microstructure and ultrastructure of mature and germinating spores using toluidine blue/DAPI staining and uranyl acetate and lead citrate staining under optical/fluorescence and transmission electron microscopes, respectively. The cellular features of spores were observed, including nuclear movement and division, variation in the number of chloroplasts and small vesicles, as well as the concentration of starch at different germination stages (Figs. 2 and 3).
Fig. 2.
Morphology of mature and germinating spores from O. cinnamomea L. var. asiatica under optical and fluorescence microscopes. A, F, K, P, Mature spores. B, G, L, Q, Rehydrated spores. C, H, M, R, Double-celled spores. D, I, N, S, Germinated spores. E, J, O, T, Spores with protonemal cells. A–J, The spores without staining. A–E, Bar = 30 μm. F–J, Bar = 10 μm. K–O, The spores stained with DAPI, bar = 10 μm. P–T, Cross section of spores stained with toluidine blue, bar = 6.5 μm. Arrows in A and B are showing the opening trilete, and arrows in F–T are showing the nucleus. P, plastid; SG, starch grain; Ve, vesicle.
Fig. 3.
Ultrastructure of germinating spores from O. cinnamomea L. var. asiatica. A, Rehydrated spores (RSs), bar = 1 μm. B, Partial magnification of the circled area in A, showing chloroplasts and starch grains, bar = 0.2 μm. C, Plastid in RSs, bar = 0.2 μm. D, Double-celled spores (DCSs), bar = 3.2 μm. E, The large cell of DCSs, showing the nucleus and plastids, bar = 1.8 μm. F, The small cell of DCSs, bar = 1.25 μm. G, Germinated spores (GSs), bar = 3.2 μm. H, The large cell of GSs, showing the nucleus, plastids, and vesicles, bar = 1.8 μm. I, Partial magnification of circled area in H, bar = 0.8 μm. J, Small cell elongation image of GSs, bar = 1.25 μm. K, Overview of the spores with protonemal cells, bar = 3 μm. ER, Endoplasmic reticulum; G, Golgi body; M, Mitochondria; N, Nucleus; Nus, Nucleolus; P, Plastid; Pl, Plasmalemma; SG, Starch grain; Ve, Vesicle.
MSs were subglobose and green, and measured 40 to 50 μm in diameter. The pale-taupe spore coat was composed of an intimate intine and a short rods modified exine. The spores had a trilete aperture running along the proximal face. A centrally located nucleus with a single nucleolus was surrounded by a thick layer of close packed chloroplasts. The peripheral cytoplasm contained numerous small vesicles (Fig. 2A, 2F, 2K, and 2P).
After 12 h dark imbibition, spores were completely imbibed for germination. RSs were enlarged to a diameter of about 60 μm. The cellular nucleus was also enlarged, migrating toward the gravity direction. Nucleus in a number of RSs has begun to divide, but was not completely separated. The spore coat was ruptured at the trilete aperture (Fig. 2B, 2G, 2L, and 2Q). The plastids in spores were arranged in a ring around the nucleus, and almost every chloroplast contained several starch grains in the chloroplast lamellae. In addition, numerous dense mitochondria were localized closely to the nucleus, and scattered endoplasmic reticulum showed connections with the double nuclear membrane. Several vesicles were localized in the peripheral cytoplasm (Fig. 3A, 3B, and 3C).
At DCSs stage, nucleus migrated from the center to the proximal part of spore. After this movement, the nucleus was adjacent to the trilete aperture and divided into two equal daughter nuclei. Importantly, nuclear division was followed by an uneven division of the cytoplasm (Fig. 2C, 2H, 2M, and 2R). The asymmetric cell division generated a large protonemal cell and a small rhizoidal cell, with plasmalemma emerging between them. Shortly thereafter, the protonemal cell nucleus enlarged with the contents became more diffuse and moved back to the center of the protonemal cell, whereas the rhizoidal cell nucleus was relatively compact (Fig. 3D, 3E, and 3F). The intine layer of spore coat was still intact, and the protoplast was still restricted in size and shape by the intine (Fig. 2C, 2H, 2M, and 2R). Plastids in spores began to move toward protoplast periphery, but still occupied most space of spore cytoplasm. Starch synthesis increased considerably, leading to numerous ellipsoidal or spindle-like starch grains within chloroplasts. The starch grains were variable in size and shape, and became abundant during the late stage of DCSs (Fig. 3D, 3E, and 3F).
At the GSs stage, the spore coat was completely opened at the trilete aperture. The small rhizoid cell was enlarged and grew out of spores, and the protonemal cell was expanded by an increase of vacuolation (Fig. 2D, 2I, 2N, and 2S). As the emerging of the rhizoid, the intine ruptured along the trilete aperture. The cytoplasm of the protonemal cell was filled with plastids and a number of mitochondria. However, few chloroplasts were incorporated into the tip region of rhizoidal cell, and the starch grains in protonemal cell and rhizoidal cell were all decreased (Fig. 3G, 3H, and 3I).
At the SPCs stage, the rhizoid kept elongating and its length was over the spore diameter (Fig. 2E, 2J, 2O, and 2T). The rhizoid contained a large number of vesicles, mitochondria, Golgi bodies, and chloroplasts, being concentrated at the tip region of the rhizoid. The nucleus in rhizoidal cell was often behind the extending rhizoid tip, and became spindle-shaped as rhizoid growth. At the same time, the protonemal cell of spores divided again, giving rise to two cells for protonema. Large vesicles occurred at the basal end of the protonemal cell (near the rhizoid cell), and a few mitochondria and plastids randomly distributed in the cytoplasm (Fig. 3K).
Water and Chlorophyll Contents in Germinating Spores
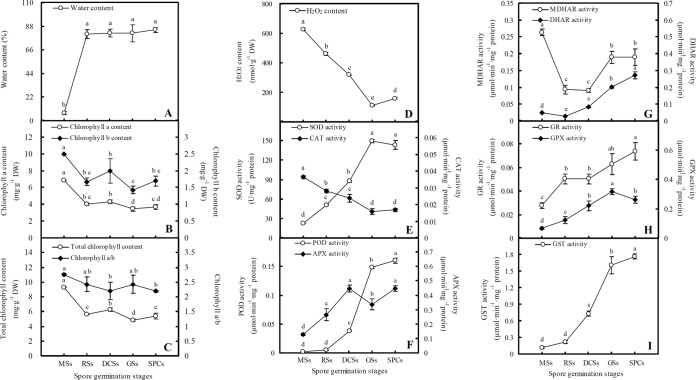
After imbibition, the water content in spores was increased significantly. The water contents in RSs, DCSs, GSs, and SPCs were all over 80% (Fig. 4A). The contents of chlorophyll a, chlorophyll b, and total chlorophyll were gradually reduced during spore germination, and the ratio of chlorophyll a/b was also decreased at the stages of DCSs and SPCs (Fig. 4B and 4C).
Fig. 4.
Water content, chlorophyll content, H2O2 level, and activities of antioxidant enzymes in mature and germinating spores from O. cinnamomea L. var. asiatica. A, Water content. B, Chlorophyll a and chlorophyll b contents. C, Total chlorophyll content and chlorophyll a/b. D, H2O2 content. E, Activities of superoxide dismutase (SOD) and catalase (CAT). F, Activities of peroxidase (POD) and ascorbate peroxidase (APX). G, Activities of monodehydroascorbate reductase (MDHAR) and dehydroascorbate reductase (DHAR). H, Activities of glutathione reductase (GR) and glutathione peroxidase (GPX). I, Glutathione S-transferase (GST) activity. The values were determined in mature spores (MSs), rehydrated spores (RSs), double-celled spores (DCSs), germinated spores (GSs), and spores with protonemal cells (SPCs), and presented as means ± S.E. (n = 3). Different letters indicate significant differences among different type of spores (p < 0.05).
H2O2 Level and Activities of Antioxidant Enzymes in Germinating Spores
To evaluate the ROS level and the dynamics of ROS scavenging system in germinating spores, the H2O2 content and the activities of nine antioxidant enzymes were detected. These enzymes include SOD, CAT, POD, APX, MDHAR, DHAR, GR, GPX, and GST, and they are involved in superoxide dismutation, CAT/POD pathway, glutathione (GSH)-ascorbate (AsA) cycle, and GPX pathway, respectively (Fig. 4D–4I).
The H2O2 content declined during spore germination (Fig 4D). SOD catalyzes the dismutation of O2− into oxygen and H2O2, and the activity of SOD was clearly induced during spore germination (Fig. 4E). The conversion of H2O2 to H2O is catalyzed by CAT and POD. The CAT activity was decreased, but the POD activity was increased drastically in germinating spores (Fig. 4E and 4F). H2O2 can also be removed through the GSH-AsA cycle. In this cycle, H2O2 is reduced to H2O catalyzed by APX using AsA as the electron donor, and the oxidized AsA (monodehydroascorbate, MDHA) can be reduced back to AsA by MDHAR, or be converted into dehydroascorbate (DHA) spontaneously. DHA can also be reduced to AsA by DHAR at the expense of GSH, generating GSSG. Furthermore, GSSG is reduced by GR using NADPH as electron donor. In our results, the activities of APX, DHAR, and GR were all increased, but the activity of MDHAR was decreased (Fig. 4F, 4G, and 4H). In addition, H2O2 can be reduced to H2O by GPX with the consumption of GSH, and GST can catalyze the reduction of organic hydroperoxides using GSH as a cosubstrate or coenzyme. The activities of GPX and GST were all induced during spore germination (Fig. 4H and 4I).
Identification of DEPs
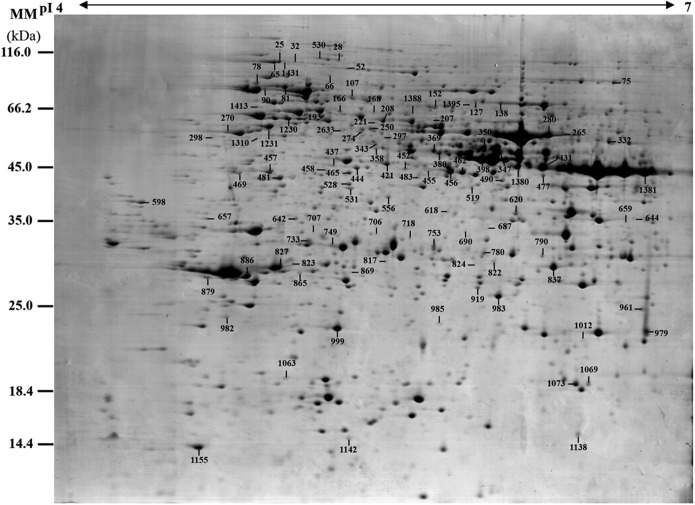
To investigate the DEPs upon spore germination, the protein profiles of spores at five germination stages (MSs, RSs, DCSs, GSs, and SPCs) were obtained using 2-DE analysis with a pI range of 4–7. On the gels of each sample, more than 1400 Coomassie Brilliant Blue-stained spots were detected (Fig. 5, supplemental Figs. S1 and S2). After gel image analysis on the base of the calculated average Vol% values of each matched protein spot, 198 reproducibly matched spots showed at least a 1.5-fold change in abundance (p < 0.05). All of the 198 DEP spots were subjected to in-gel digestion and protein identification using mass spectrometry (MS). A total of 139 DEP spots were identified using ESI-Q-TOF MS/MS and Mascot database searching with stringent criteria. Among 139 protein identities (IDs), only 113 IDs contained a single protein each (Fig. 5, Table I, and supplemental Table S2). The remaining 26 IDs contained more than one protein each (supplemental Table S3). In this case, it is difficult to determine which protein changed in abundance. Therefore, our analyses were focused on the 113 IDs.
Fig. 5.
A representative 2-DE gel image of proteins in mature spores from O. cinnamomea L. var. asiatica. Proteins were separated on 24 cm IPG strips (pH 4–7 linear gradient) using IEF in the first dimension, followed by 12.5% SDS-PAGE gels in the second dimension. The 2-DE gel was stained with Coomassie Brilliant Blue. Molecular mass (MM) in kDa and pI of proteins are indicated on the left and top of the gel, respectively. A total of 113 differentially expressed proteins identified by ESI-Q-TOF MS were marked with numbers on the gel, and detailed information can be found in Supplemental Figs. S1 and S2, Table I, and Supplemental Table S2.
Table I. Differentially expressed proteins during Osmunda cinnamomea L. var. asiatica. spore germination.
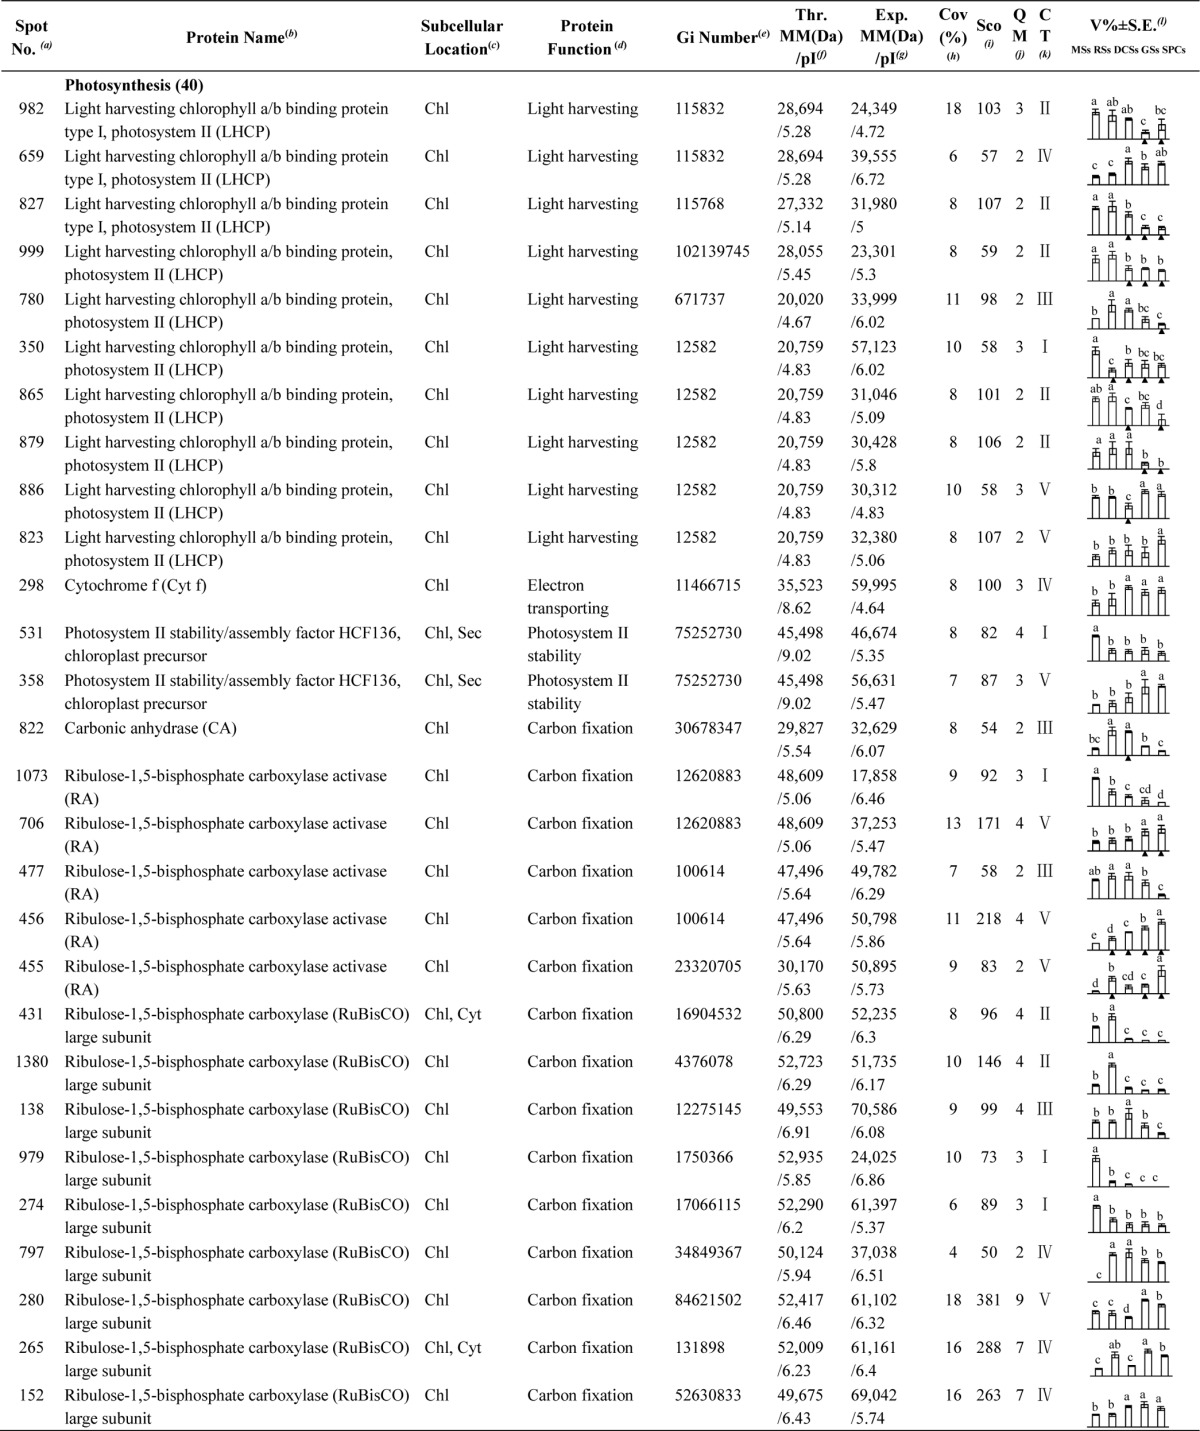
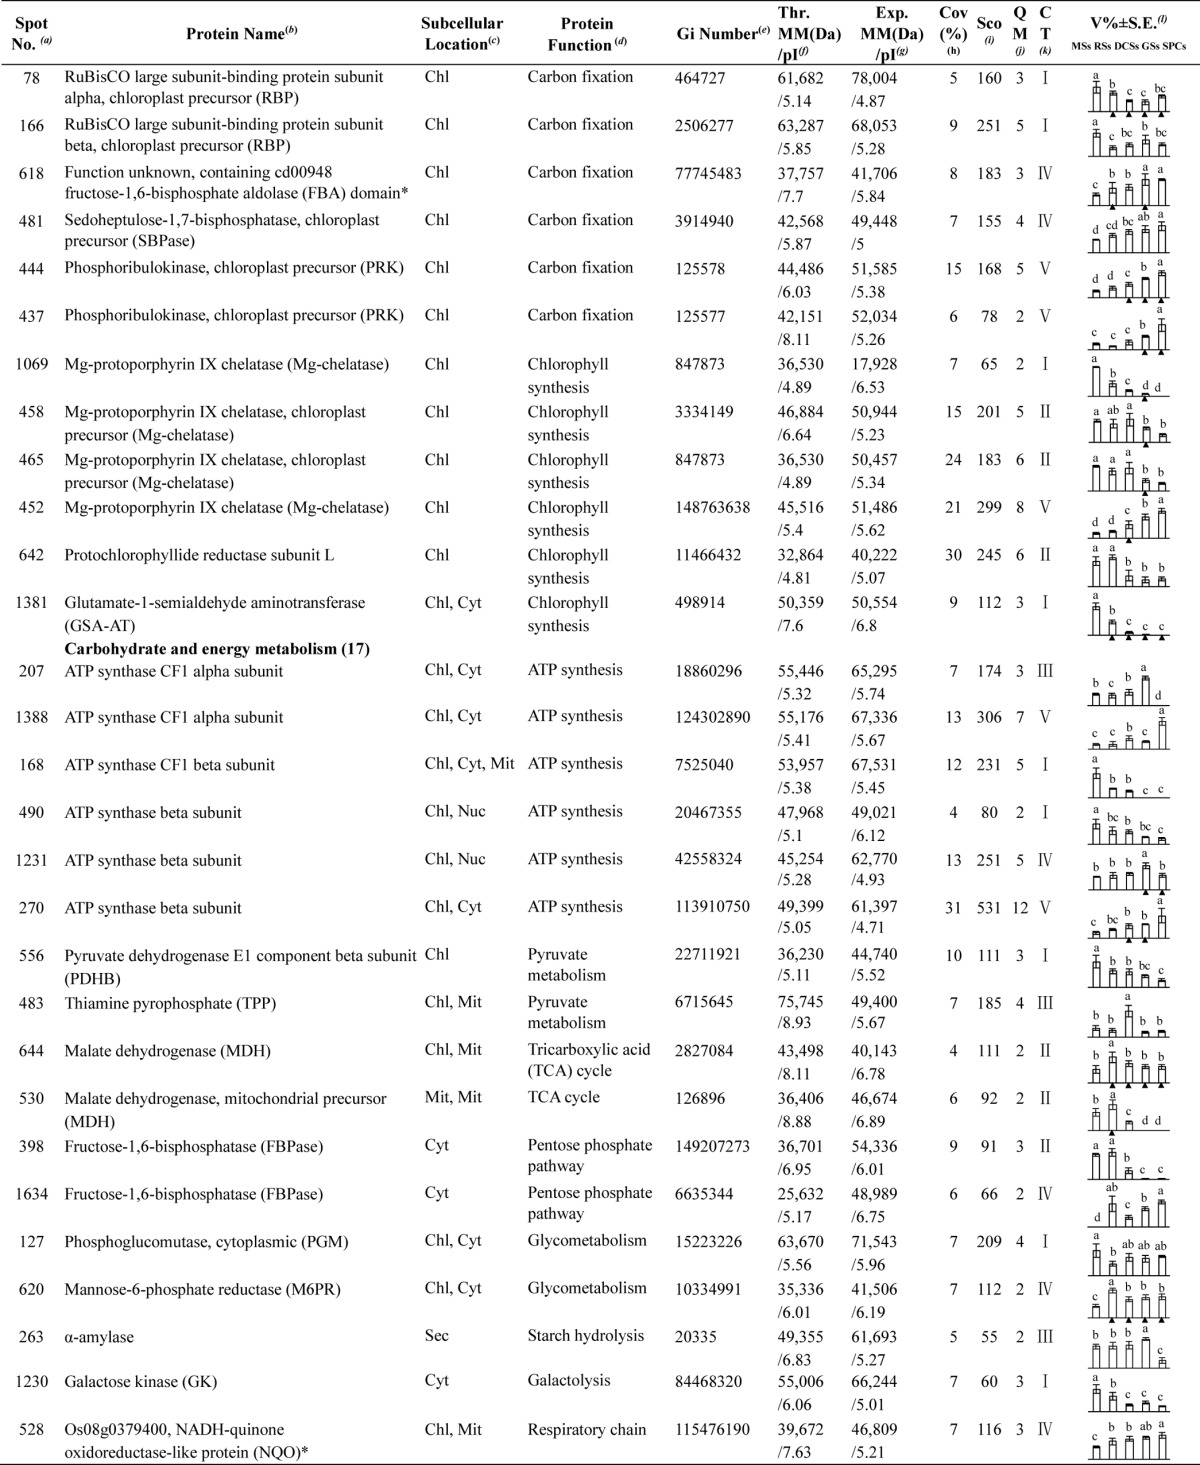
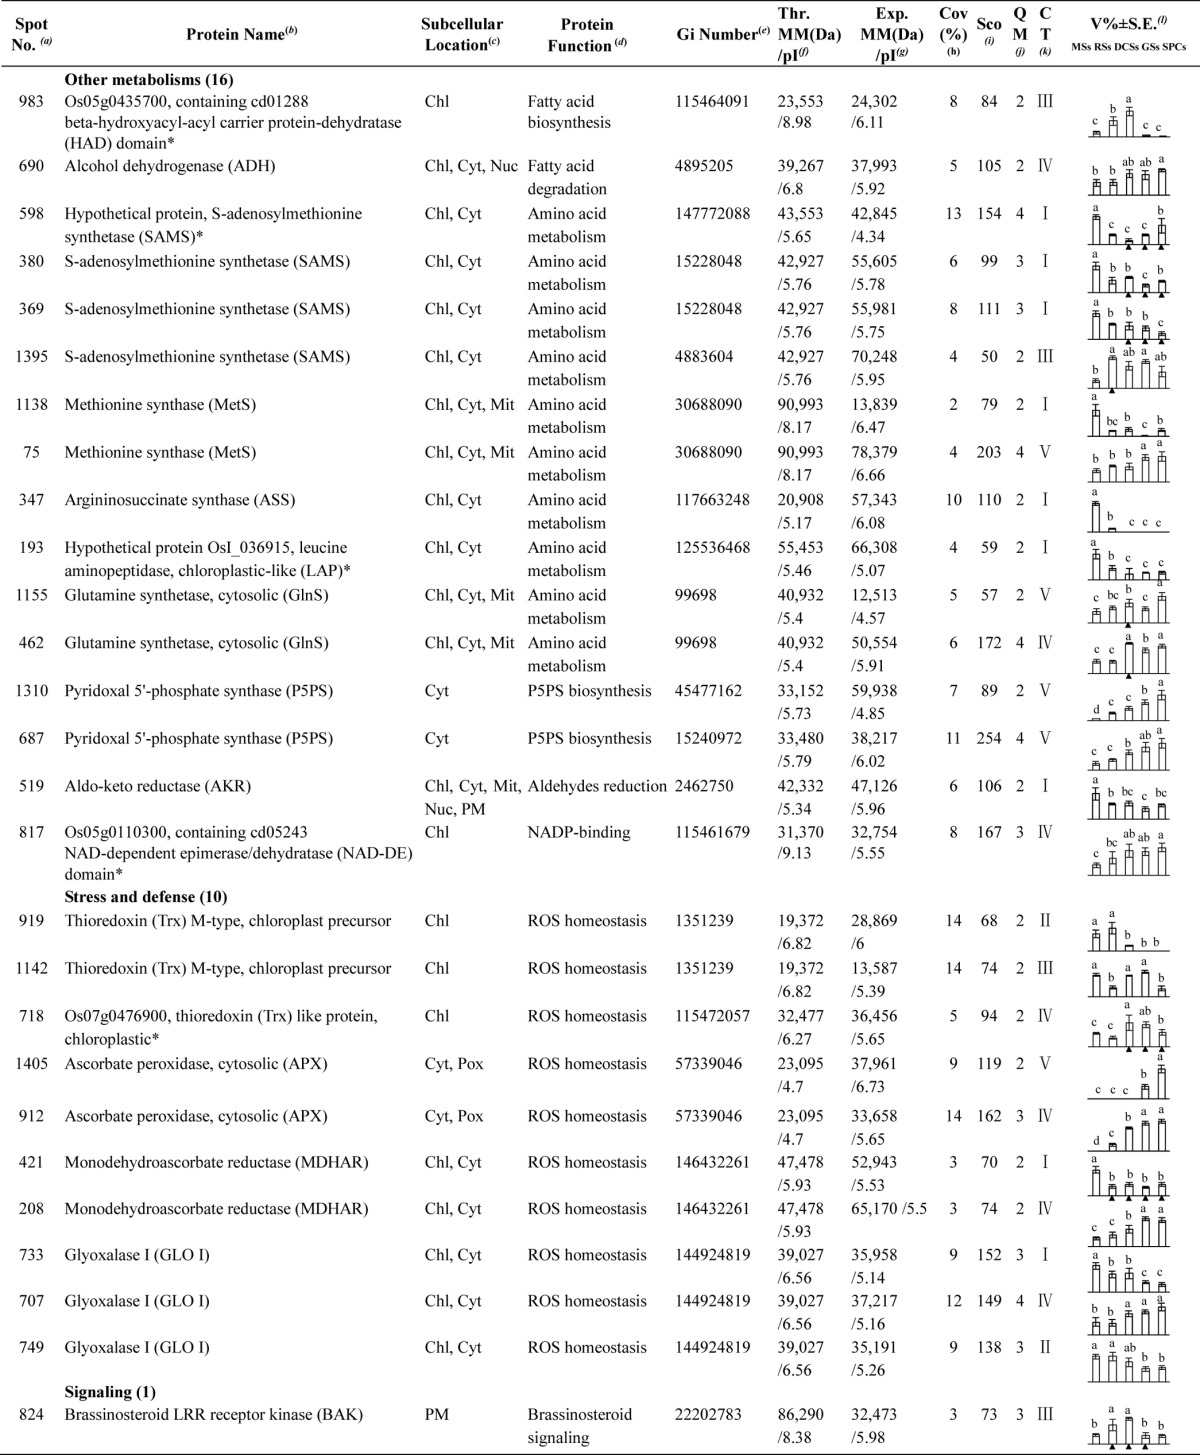
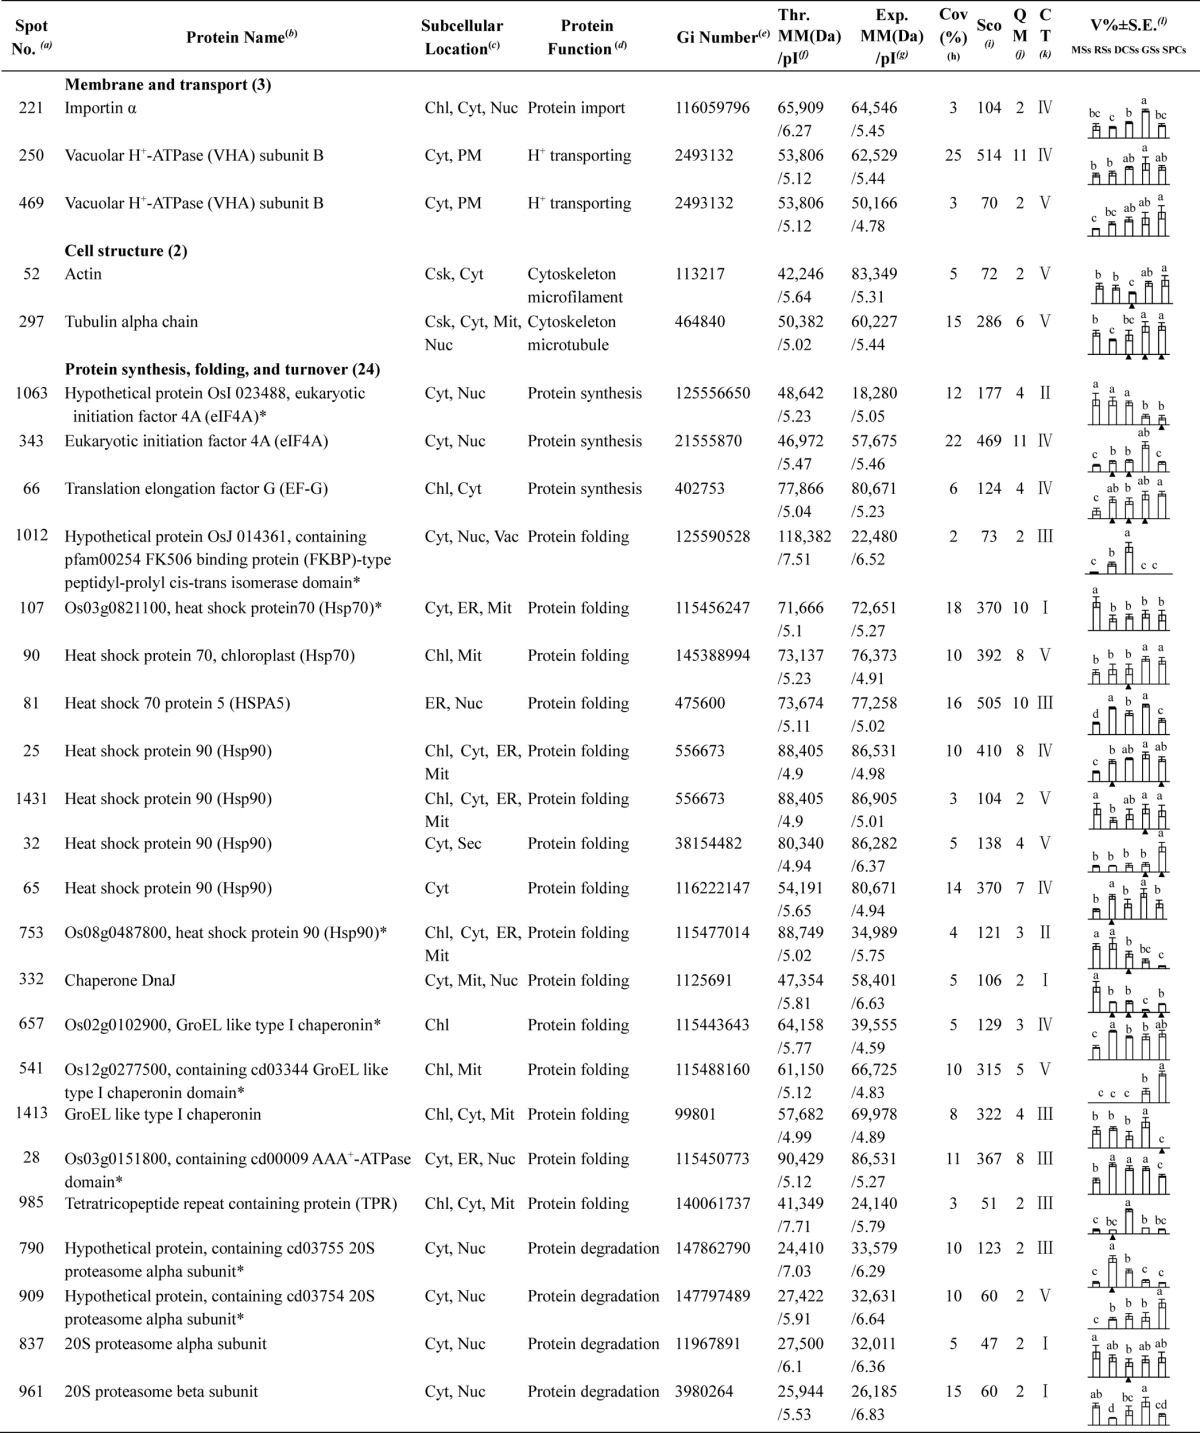

a Assigned spot number as indicated in Fig. 5.
b The name and functional category of the proteins identified by ESI-Q-TOF MS. Protein names marked with an asterisk (*) have been edited by us depending on functional domain searching and similarity comparison according to the Gene Ontology criteria.
c Protein subcellular localization predicted by softwares (YLoc, LocTree3, Plant-mPLoc, ngLOC, and TargetP). Chl, chloroplast; Csk, cytoskeleton; Cyt, cytoplasm; ER, endoplasmic reticulum; PM, plasma membrane; Mit, mitochondria; Nuc, nucleus; Pox, peroxisome; Sec, secreted; Vac, vacuole.
d The molecular function of the identified proteins.
e Database accession number from NCBInr.
f,gTheoretical (f) and experimental (g) molecular mass (Da) and pI of identified proteins. Experimental values were calculated using ImageMaster 2D software. Theoretical values were retrieved from the protein database.
hThe amino acid sequence coverage for the identified proteins.
iThe Mascot score obtained after searching against the NCBInr database.
jThe number of unique peptides identified for each protein.
kThe cluster types of identified proteins obtained from the GeneCluster software (version 2.0).
lThe mean values of protein spot volumes relative to total volume of all the spots. The black triangle (▴) under the column of protein abundance indicates that the proteins showed similar trends with their homologous genes (Please refer to Fig. 8). Five spore germination stages (MSs, RSs, DCSs, GSs, and SPCs) were performed. MSs, mature spores; RSs, rehydrated spores; DCSs, double-celled spores; GSs, germinated spores; SPCs, spores with protonemal cells. Error bar indicates ± standard error (S.E.). Letters indicate statistically significant differences (p < 0.05) among five stages of spore germination as determined by one-way ANOVA.
Annotation, Proteoform Analysis, and Functional Categorization of DEPs
Among the 113 IDs, 17 IDs are originally annotated as unknown, hypothetical proteins, or without annotation. They were all re-annotated according to their function domains by BLAST. The obtained annotation information indicated that these proteins were mainly involved in photosynthesis, carbohydrate and energy metabolism, stress and defense, protein synthesis, folding, and turnover, and other metabolisms (Table I, and supplemental Table S4).
Interestingly, the 113 IDs only represented 95 unique proteins. Twenty-five proteins had proteoforms, which were involved in photosynthesis, carbohydrate and energy metabolism, other metabolisms, stress and defense, membrane and transport, and protein synthesis, folding, and turnover (Table I, and supplemental Table S5). These proteoforms might be generated from alternative splicing and various post-translational modifications.
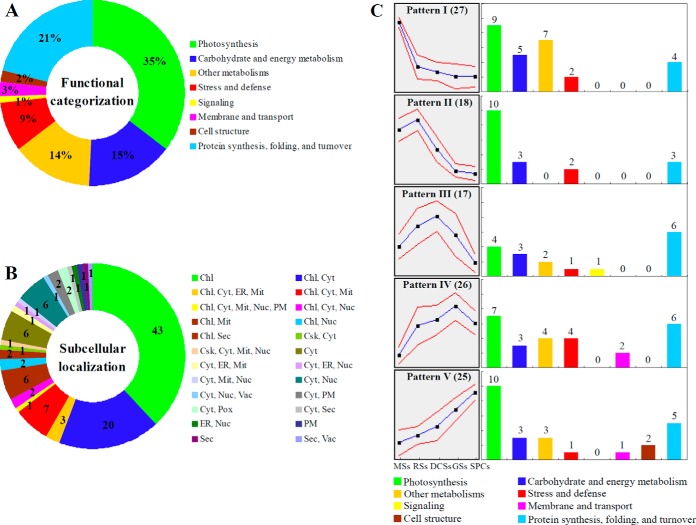
Based on Gene Ontology, BLAST alignments, and information from literature, the 113 IDs were classified into eight functional categories, including photosynthesis, carbohydrate and energy metabolism, other metabolisms, stress and defense, signaling, membrane and transport, cell structure, and protein synthesis, folding, and turnover (Fig. 6A, Table I, and supplemental Table S2). Among them, proteins involved in photosynthesis (35%), carbohydrate and energy metabolism (15%), other metabolisms (14%), protein synthesis, folding, and turnover (21%) were over-represented (Fig. 6A, and Table I). The 40 photosynthesis-related DEPs included photosystem II (PSII) proteins, cytochrome f, proteins involved in carbon assimilation and Calvin cycle, as well as chlorophyll synthesis-related proteins. The protein profiles are in line with the chlorophyll measurement results, which suggest that photosynthesis becomes more active after rhizoid emergence than at the early germination stages (RSs and DCSs) (Table I). In addition, 17 DEPs were involved in carbohydrate and energy metabolism, such as ATP synthesis, pyruvate metabolism, tricarboxylic acid (TCA) cycle, pentose phosphate pathway, and glycometabolism (Table I). Most of them were induced upon spore germination, which reflects that active hydrolysis of stored starch and sugar metabolism took place in germinating spores. Moreover, 16 DEPs were involved in other metabolisms, such as fatty acid biosynthesis, amino acid metabolism, and pyridoxal 5′-phosphate biosynthesis. This indicates that various metabolisms are switched to a more active status after initiation of spore germination. Importantly, we found ten ROS homeostasis-related DEPs were altered in germinating spores, implying that the modulation of ROS production and scavenging are crucial for spore germination. In addition to ROS signaling, a key brassinosteroid (BR) signaling protein, brassinosteroid LRR receptor kinase (BAK), was increased before rhizoid emergence (Table I). In addition, three transport-related DEPs and the two constituents of cytoskeleton were all induced at the stages of GSs and/or SPCs (Table I), indicating the promotion of nuclear movement, vesicle trafficking, and cytoskeleton dynamic during rhizoid elongation. Furthermore, 24 DEPs were found to be involved in protein synthesis, folding, and turnover (Table I). This suggests that active protein synthesis, processing, and selective degradation are essential for spore cell division, rhizoid elongation, and protonemal cell growth.
Fig. 6.
Functional categorization, subcellular localization, hierarchical clustering, and functional distribution analyses of differentially expressed proteins (DEPs) during O. cinnamomea L. var. asiatica spore germination. A, A total of 113 proteins were classified into eight functional categories on the bases of BLAST alignments, Gene Ontology, and knowledge from literature. The percentage of proteins in different functional categories is shown in the pie. B, Subcellular localization categories of proteins predicted by internet tools. The numbers of proteins with different locations are shown. C, Hierarchical clustering and functional distribution analyses of DEPs. Self-organizing maps clustering analysis of the protein expression profiles was performed based on the standardization of each protein abundance data using GeneCluster software (version 2.0). The blue line shows normalized level of protein expression in each group and the red line represents the variation of protein expression in the left panel. The columns with different colors in the right panel show the protein functional categories, and the protein numbers in each category are labeled on the top of corresponding columns. Chl, chloroplast; Csk, cytoskeleton; Cyt, cytoplasm; DCSs, double-celled spores; ER, endoplasmic reticulum; GSs, germinated spores; Mit, mitochondria; MSs, mature spores; Nuc, nucleus; PM, plasma membrane; Pox, peroxisome; RSs, rehydrated spores; Sec, secreted; SPCs, spores with protonemal cells; Vac, vacuole.
Subcellular Localization and Hierarchical Clustering of DEPs
The subcellular localization of the 113 DEPs was predicted using five internet tools (i.e. YLoc, LocTree3, ngLOC, TargetP, and Plant-mPLoc) (Fig. 6B, Table I, and supplemental Table S6). In total, 43 DEPs (38%) were predicted to be localized in chloroplast, six in cytoplasm, one on PM, and one secreted. The rest 62 proteins (55%) were predicted to be located in more than two locations (Fig. 6B, and Table I). Among the 62 proteins, 43 proteins and 20 proteins were predicted to be in chloroplast and mitochondria, respectively (Fig. 6B and Table I). These indicate that photosynthesis, energy metabolism, and vesical trafficking were active in germinating spores.
To visualize the expression characteristics of all the coordinately regulated proteins in each functional category, we performed hierarchical clustering analysis of the 113 DEPs, which revealed five cluster patterns (Pattern I–V) (Fig. 6C). Pattern I containing 27 DEPs and pattern II containing 18 DEPs represented the abundance-decreased proteins in germinating spores and spores after the stage of RSs, respectively. For instance, three chlorophyll biosynthesis-related proteins, Mg-protoporphyrin IX chelatase (Mg-chelatase), protochlorophyllide reductase, and glutamate-1-semialdehyde aminotransferase (GSA-AT), were decreased during spore germination. This indicates chlorophyll biosynthesis activity was reduced in germinating spores. Pattern III had 17 DEPs, which were increased before the stage of DCSs, decreased after this stage. BAK exhibited in this pattern implies the BR signaling pathways were involved in the gravity response, polarity establishment, and cell division prior to the DCSs stage (1, 35). In addition, Pattern IV (26 DEPs) and Pattern V (25 DEPs) represented proteins increased during fern spore germination, and the highest protein abundance was detected at the stages of GSs and SPCs, respectively. These proteins reflect several active pathways (e.g. vesicle trafficking and cytoskeleton dynamic) during spore germination. Importantly, 51 out of 113 DEPs fallen into patterns IV and V also suggests that a number of proteins were de novo synthesized upon spore germination.
Protein–Protein Interaction among DEPs
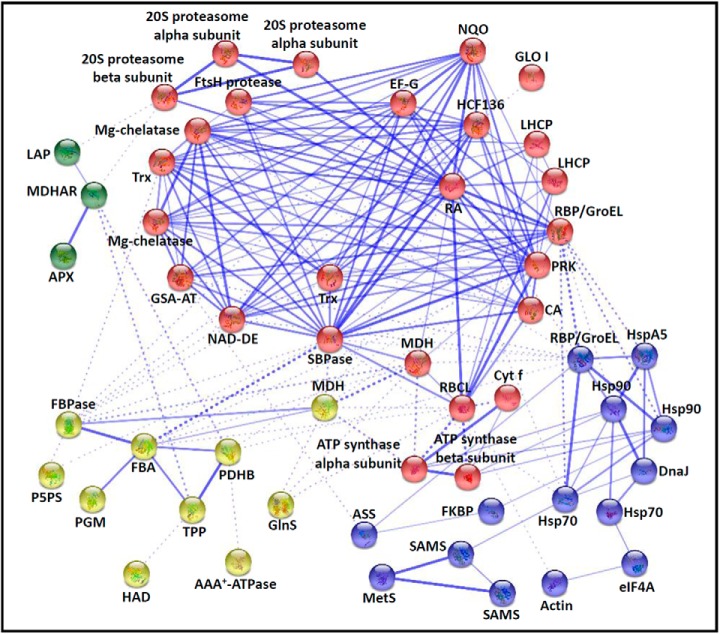
To predict the relationship among the 113 DEPs, the protein–protein interaction networks were generated using the web-tool STRING 9.1. The 113 DEPs were matched with 65 unique homologs in Arabidopsis by sequence BLASTing against the TAIR database (supplemental Table S7). Subsequently, the 65 homologous proteins were subjected to the molecular interaction tool of STRING 9.1 for creation of proteome-scale interaction network. Out of the 65 proteins, 53 representing 100 DEPs were depicted in the STRING database (Fig. 7), based on published literature, genome analysis of domain fusion, phylogenetic profiling/homology, gene neighborhood, co-occurrence, co-expression, and other experimental evidence. Four functional modules forming tightly connected clusters were illuminated in the network (Fig. 7). In the network, stronger associations were represented by thicker lines (Fig. 7). For example, 26 DEPs were connected in Module 1 (red nodes). Most of them were chloroplast-localized photosynthetic proteins involved in light harvesting, electron transferring, carbon fixation, ATP synthesis, and chlorophyll synthesis. In addition, the members of protein synthesis machine, 20S proteasome and ROS scavenging also appeared close links in Module 1. This indicates that active protein turnover and ROS homeostasis in chloroplast are crucial for photosynthesis in chlorophyllous spores. Model 2 (yellow nodes) included multiple enzymes involved in glycolysis, fatty acid metabolism, and vitamin B6 synthesis, implying the material and energy supply is active upon spore germination. Interestingly, several molecular chaperones, actin, eukaryotic initiation factor 4A (eIF4A), and four enzymes in charge of NO and ethylene synthesis were assigned in Model 3. Some molecular chaperones in Model 3 also linked with photosynthetic proteins in Model 1. This implies that active synthesis and folding of cytoskeletal and photosynthetic proteins may play important roles in rapid cell division during spore germination. In addition, three proteins, APX, MDHAR, and leucine aminopeptidase (LAP) did not appear to link tightly with other proteins, and they were assigned in Model 4.
Fig. 7.
The protein–protein interaction (PPI) network in O. cinnamomea L. var. asiatica spores revealed by STRING analysis. A total of 100 differentially expressed proteins represented by 53 unique homologous proteins from Arabidopsis are shown in PPI network. Four main groups are indicated in different colors. The PPI network is shown in the confidence view generated by STRING database. Stronger associations are represented by thicker lines. APX, ascorbate peroxidase; ASS, argininosuccinate synthase; CA, carbonic anhydrase; DnaJ, chaperone DnaJ; EF-G, translation elongation factor G; eIF4A, eukaryotic initiation factor 4A; FBA, fructose-1,6-bisphosphate aldolase; FBPase, fructose-1,6-bisphosphatase; FKBP, FK506 binding protein-type peptidyl-prolyl cis-trans isomerase; GlnS, glutamine synthetase; GLO I, glyoxalase I; GroEL, GroEL like type I chaperonin; GSA-AT, glutamate-1-semialdehyde aminotransferase; HAD, beta-hydroxyacyl-acyl carrier protein-dehydratase; HCF136, photosystem II stability/assembly factor HCF136; Hsp 70/90, heat shock protein 70/90; HSPA5, heat shock 70 protein 5; LAP, leucine aminopeptidase; LHCP, light harvesting chlorophyll a/b binding protein, photosystem II; MDH, malate dehydrogenase; MDHAR, monodehydroascorbate reductase; MetS, methionine synthase; Mg-chelatase, Mg-protoporphyrin IX chelatase; NAD-DE, NAD-dependent epimerase/dehydratase; NQO, NADH: quinone oxidoreductase-like protein; P5PS, pyridoxal 5′-phosphate synthase; PDHB, pyruvate dehydrogenase E1 component beta subunit; Cyt f, cytochrome f; PGM, phosphoglucomutase; PRK, phosphoribulokinase; RA, ribulose-1,5-bisphosphate carboxylase activase; RBCL, ribulose-1,5-bisphosphate carboxylase large subunit; RBP, ribulose-1,5-bisphosphate carboxylase large subunit-binding protein; SAMS, S-adenosylmethionine synthetase; SBPase, sedoheptulose-1,7-bisphosphatase; TPP, thiamine pyrophosphate; Trx, thioredoxin.
Homologous Gene Expression of DEPs
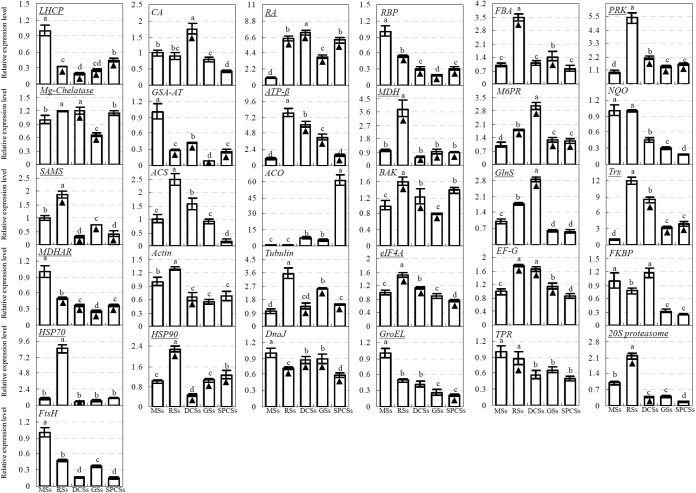
The 95 unique proteins have been subjected to BLASTing against the O. lancea EST database using a BLASTn program. Among them, only 31 homologous genes were found in O. lancea EST database. Subsequently, these homologous genes and two ethylene synthesis-related genes encoding 1-aminocyclopropane-1-carboxylic acid synthase (ACS) and aminocyclopropanecarboxylate oxidase (ACO) were subjected to PCR analysis to assess the homologous gene expression in spores of O. cinnamomea. The primer pairs were designed according to the EST sequence of each homologous gene (supplemental Table S1). In total, 31 homologous genes could be detected in O. cinnamomea spores. The gene expression patterns upon spore germination were generated from qRT-PCR analysis using UBQ5 as an internal control (Fig. 8). On the basis of qRT-PCR and proteomics results, the correlation between DEPs and their cognate genes were evaluated (Fig. 8, Table I). The results showed that 15 genes showed multiple proteoforms of homologous proteins. These genes were involved in light harvesting, carbon fixation, chlorophyll synthesis, ATP synthesis, TCA cycle, amino acid metabolism, ROS scavenging, and protein synthesis and degradation. Among them, only two genes, phosphoribulokinase (PRK) and malate dehydrogenase (MDH), appeared similar expressional patterns with the corresponding proteoforms (Fig. 8). In addition, four genes, ribulose-1,5-bisphosphate carboxylase large subunit-binding protein (RBP), GSA-AT, mannose-6-phosphate reductase (M6PR), and chaperone DnaJ showed consistent expressional trends with their homologous proteins. They were involved in carbon fixation, chlorophyll synthesis, glycometabolism, and protein folding, respectively. Furthermore, three genes, NADH-quinone oxidoreductase (NQO), FK506 binding protein-type peptidyl-prolyl cis-trans isomerase, and FtsH protease (FtsH), appeared opposite expressional trends with homologous proteins. They were involved in respiratory, protein folding and degradation, respectively. Lastly, the rest seven genes only showed similar trends with homologous proteins at certain stages of spore germination (Fig. 8 and Table I). These genes encode the proteins that were involved in photosynthesis, cytoskeleton, signaling, protein synthesis, and protein processing. The results of correlation analysis indicate that the aforementioned metabolic processes were modulated by post-transcriptional and/or post-translational regulation during spore germination. The inconsistent abundances of transcripts and proteins in germinating spores also support the notion that presynthesized mRNA and proteins in MSs would function for spore germination (4).
Fig. 8.
Quantitative real-time PCR analysis of gene expression patterns in the O. cinnamomea L. var. asiatica spore. Relative expression levels of homologous genes of differentially expressed proteins (DEPs) from O. cinnamomea spores were determined by qRT-PCR. The values were determined in mature spores (MSs), rehydrated spores (RSs), double-celled spores (DCSs), germinated spores (GSs), and spores with protonemal cells (SPCs), and presented as means ± S.E. (n = 3). Different letters indicate significant differences among different type of spores (p < 0.05). The gene name with an underline indicates that the gene has multiple proteoforms of homologous proteins. The column marked with a black triangle indicates the gene expression appeared similar trends with their homologous proteins (Please refer to Table I). 20S proteasome, 20S proteasome alpha subunit gene; ACO, aminocyclopropanecarboxylate oxidase gene; ACS, 1-aminocyclopropane-1-carboxylic acid synthase gene; ATP-β, ATP synthase beta subunit gene; BAK, brassinosteroid LRR receptor kinase gene; CA, carbonic anhydrase gene; DnaJ, chaperone DnaJ gene; eIF4A, eukaryotic initiation factor 4A gene; EF-G, translation elongation factor G gene; FBA, fructose-1,6-bisphosphate aldolase gene; FKBP, FK506 binding protein (FKBP)-type peptidyl-prolyl cis-trans isomerase gene; FtsH, FtsH protease gene; GlnS, glutamine synthetase gene; GroEL, GroEL like type I chaperonin gene; GSA-AT, glutamate-1-semialdehyde aminotransferase gene; Hsp70, heat shock protein 70 gene; Hsp90, heat shock protein 90 gene; LHCP, light harvesting chlorophyll a/b binding protein gene; M6PR, mannose-6-phosphate reductase gene; MDH, malate dehydrogenase gene; MDHAR, monodehydroascorbate reductase gene; Mg-chelatase, Mg-protoporphyrin IX chelatase gene; NQO, NADH: quinone oxidoreductase-like protein gene; PRK, phosphoribulokinase gene; RA, ribulose-1,5-bisphosphate carboxylase activase gene; RBP, RuBisCO large subunit-binding protein subunit alpha gene; SAMS, S-adenosylmethionine synthetase gene; TPR, tetratricopeptide repeat containing protein gene; Trx, thioredoxin gene.
DISCUSSION
Heterotrophic and Autotrophic Metabolisms are Active in Germinating Chlorophyllous Spores
Unlike nongreen fern spores, the mature green spores contain chloroplasts and water, which are metabolically active and short-lived. The chlorophyllous spores in a state of active respiration can germinate immediately after sowing. In the Pteridophyta, chlorophyll-bearing spores occur in only a few families (i.e. Equisetaceae, Osmundaceae, Grammitidaceae, and Hymenophyllaceae), genera (i.e. Blechnum, Christiopteris, Marginariopsis, Matteuccia, Onoclea, and Onocleopsis), and certain species (Lomariopsis sorbifolia). Chlorophyllous spores from these fern species can germinate in less than 3 days after sowing, which is more rapid than nongreen spores (36). Among them, it has been reported that chlorophyllous spores from Osmunda could germinate within 24 h after imbibition without dormancy, and the spores from O. cinnamomea L. could germinate within 3 days (37). Similarly, the fresh spores from Osmunda japonica without desiccation (11.2% water content) have the highest germination rate, but spore viability drops when the water content is lower than 6% (38). The rapid germination is mainly because of the active respiration/photosynthesis, and higher metabolic rate in chlorophyllous spores after being released from sporangium.
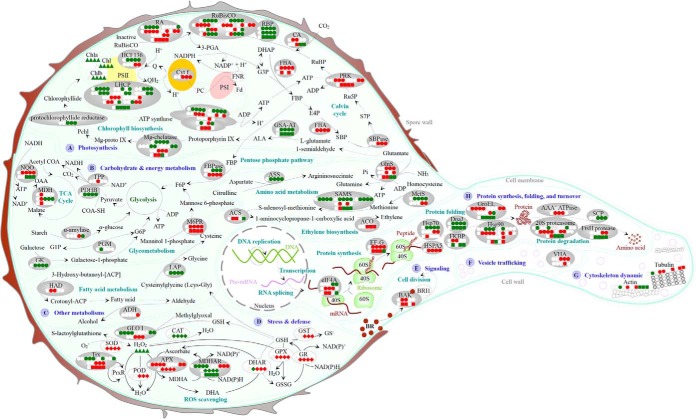
Both heterotrophic and autotrophic metabolisms are suspected to contribute to the germination of O. cinnamomea spores. Our histochemical and cytological analyses revealed that the predominant reserves, starch grains in chloroplasts, and lipids in vesicles, were decreased gradually during spore germination (Figs. 2 and 3). In addition, we found that 40, 17, and 16 proteins were involved in photosynthesis, carbohydrate and energy metabolism, and other metabolisms, respectively, accounting for 65% of 113 DEPs (Table I, Fig. 6A). In addition, the diverse protein expression patterns indicated that pentose phosphate pathway (e.g. fructose-1,6-bisphosphatase), TCA cycle (e.g. MDH), glycometabolism (e.g. M6PR, α-amylase, and NQO), amino acid metabolism (e.g. glutamine synthase (GlnS), S-adenosylmethionine synthetase (SAMS), and methionine synthase (MetS)), fatty acid metabolism (e.g. β-hydroxyacyl-ACP-dehydratase and alcohol dehydrogenase), and pyruvate metabolism (e.g. pyruvate dehydrogenase E1 component beta subunit) and thiamine pyrophosphate biosynthesis were actively altered upon spore germination (Table I, Fig. 9). This implies that the mobilization and sequential hydrolysis of storage reserves (proteins, starches, and lipids) are tightly controlled in temporal and spatial scale, which is important for energy metabolite biosynthesis during spore germination. Similarly, during the germination of chlorophyllous spores from O. sensibilis and M. struthiopteris (39) and nonchlorophyllous spores from A. phyllitidis, Pteris vittata, and Dryopteris filix-mas (4), the degradation of various storage reserves in spores was also found to be crucial for spore germination process. Moreover, the aforementioned pathways also show that active nitrogen metabolism served as the source of energy and nutrients for fern spore germination. Both the degradation of storage proteins and the oxidative deamination of free amino acids lead to a release of ammonium, and subsequently free ammonium is further recycled into glutamate to generate glutamine through the reaction catalyzed by the enzyme GlnS. It has been reported that maize seeds with high GlnS activity exhibited fast germination rate (40). In our results, the induced GlnS in germinating spores would contribute to glutamine synthesis for spore germination (Table I, Fig. 9). On the other hand, the expression abundances of proteins involved in chlorophyll biosynthesis (e.g. Mg chelatase), PSII (e.g. light harvesting chlorophyll a/b binding protein and PSII stability/assembly factor HCF136), carbon fixation (e.g. carbonic anhydrase, ribulose-1,5-bisphosphate carboxylase activase, ribulose-1,5-bisphosphate carboxylase, RBP, fructose-1,6-bisphosphate aldolase, sedoheptulose-1,7-bisphosphatase, and PRK), and ATP synthesis (e.g. ATP synthase) exhibited diverse changes (Table I, Fig. 9). This indicates that the active modulation of photosynthesis provides necessary carbon source for spore germination, which is consistent with previous observations on spore germination of Osmunda species that the protrusion of the rhizoidal cell depends upon photosynthesis (41).
Fig. 9.
Schematic presentation of the O. cinnamomea L. var. asiatica spore germination mechanisms. The identified proteins were integrated into subcellular pathways. A, Photosynthesis; B, Carbohydrate and energy metabolism; C, Other metabolisms; D, Stress and defense; E, Signaling; F, Vesicle trafficking; G, Cytoskeleton dynamic; H, Protein synthesis, folding, and turnover. Protein expression patterns, gene expression patterns, enzyme activities, and substrate contents are marked with circles, squares, diamonds, and triangles in white (unchanged), red (increased), and green (decreased), respectively. The solid line indicates single-step reaction, and the dashed line indicates multistep reaction. 3-PGA, 3-phosphoglyceric acid; 40S, eukaryotic small ribosomal subunit; 60S, eukaryotic large ribosomal subunit; Acetyl COA, acetyl coenzyme A; ACP, acyl carrier protein; ADH, alcohol dehydrogenase; ALA, 5-aminolevulinic acid; ANK, ankyrin-repeat containing protein; APX, ascorbate peroxidase; ASS, argininosuccinate synthase; BAK, brassinosteroid LRR receptor kinase; BR, brassinosteroid; BRI1, brassinosteroid-insensitive 1; CA, carbonic anhydrase; CaM, calmodulin; CAT, catalase; Chl, chlorophyll; COA-SH, coenzyme A; Cyt f, cytochrome f; DHA, dehydroascorbic acid; DHAP, dihydroxyacetone phosphate; DHAR, dehydroascorbate reductase; E4P, erythrose 4-phosphate; EF-G, translation elongation factor G; eIF4A, eukaryotic initiation factor 4A; F6P, fructose 1,6-diphosphate; FBA, fructose-1,6-bisphosphate aldolase; FBP, fructose 1,6-bisphosphate; FBPase, fructose-1,6-bisphosphatase; Fd, ferredoxin; FKBP, FK506 binding protein-type peptidyl-prolyl cis-trans isomerase; FNR, ferredoxin-NADP+ reductase; G1P, glucose-1-phosphate; G3P, glyceraldehyde 3-phosphate; G6P, glucose-6-phosphate; GK, galactose kinase; GLO I, glyoxalase I; GPX, glutathione peroxidase; GR, glutathione reductase; GroEL, GroEL like type I chaperonin; GlnS, glutamine synthetase; GSA-AT, glutamate-1-semialdehyde aminotransferase; GSH, glutathione; GSSG, oxidized glutathione; GST, glutathione S-transferase; HAD, beta-hydroxyacyl-acyl carrier protein-dehydratase; Hsp, heat shock protein; HSPA5, heat shock 70 protein 5; LAP, leucine aminopeptidase; LHCP, light harvesting chlorophyll a/b binding protein; M6PR, mannose-6-phosphate reductase; MDH, malate dehydrogenase; MDHA, monodehydroascorbate; MDHAR, monodehydroascorbate reductase; Mg-chelatase, Mg-protoporphyrin IX chelatase; Mg-proto IX, Mg-protoporphyrin IX; MetS, methionine synthase; NQO, NADH-quinone oxidoreductase; OAA, oxaloacetate; PC, plastocyanin; Pchl, protochlorophyllide; PDHB, pyruvate dehydrogenase E1 component beta subunit; PGM, phosphoglucomutase; POD, peroxidase; PRK, phosphoribulokinase; PrxR, peroxiredoxin; PSI, photosystem I; PSII, photosystem II; Q, quinone; QH2, hydroquinone; RA, ribulose-1,5-bisphosphate carboxylase activase; RBP, ribulose-1,5-bisphosphate carboxylase large subunit-binding protein; ROS, reactive oxygen species; RuBisCO, ribulose-1,5-bisphosphate carboxylase; Ru5P, ribulose-5-phosphate; RuBP, ribulose-1,5-bisphosphate; S7P, sedoheptulose 7-phosphate; SAMS, S-adenosylmethionine synthetase; SBP, sedoheptulose 1,7-bisphosphate; SBPase, sedoheptulose-1,7-bisphosphatase; SCP, serine carboxypeptidase; SOD, superoxide dismutase; TCA, tricarboxylic acid; TPP, thiamine pyrophosphate; Trx, thioredoxin; VHA, vacuolar H+-ATPase.
The decrease in chloroplast number (Figs. 2 and 3), chlorophyll content (Fig. 4B and 4C), as well as the abundances of chlorophyll biosynthesis-related enzymes (i.e. GSA-AT, Mg-chelatase, and protochlorophyllide reductase) (Table I) and their homologous genes (Fig. 8) indicated that chlorophyll biosynthesis was decreased during the spore germination. This implies that the photosynthesis is decreased during spore germination. This phenomenon is consistent with previously measured photosynthetic rates in Todea barbara (another species in Osmundaceae) (42). The photosynthetic rate of sporophytes from T. barbara is 3.6 to 5.5-fold higher than that of its gametophytes (42). The Osmunda chlorophyllous MSs contain a number of chloroplasts, and their photosynthesis and respiration are active (22). However, on germination, spores will develop into a morphology-reduced gametophyte with a single sheet of cells except for a thickened central cushion bearing sex organs and rhizoids. The chlorophyll content in gametophytes is obviously lower than that in sporophytes (42). Here, our results provide novel evidence on expressional abundances of several chlorophyll biosynthesis-related genes and enzymes for understanding the notion that the reduced photosynthesis in developing gametophytes is not entirely attributed to morphological differences with gametophytes (42).
ROS and Hormone Signalings are Crucial for Spore Germination
It is well known that ROS signaling in tip-growing pollen tube is involved in and/or interact with diverse crucial processes in cell polar growth, such as hormone signaling, modulation of cell wall structure and extensibility, regulation of Ca2+ gradient and Ca2+ channel activity, as well as the changes of NO levels and gravitropism (43). However, in analogous fern spores, the dynamic balance of ROS generation and scavenging are poorly understood. In this study, our proteomic results indicated that active CO2 fixation and electron transport in chloroplasts and mitochondria would be the major source of ROS generation in germinating spores. On the other hand, the abundances and/or activities of ROS scavenging enzymes were changed during spore germination. Enzyme abundances may be inconsistent with their activities, because of the activity also being modulated by the protein conformation and post-translational modifications. The increased abundances of thioredoxin (Trx), MDHAR, and APX, as well as the induced activity of SOD, POD, APX, DHAR, GR, and GPX could facilitate ROS scavenging in germinating spores (Table I, Figs. 4D–4I and 9). In addition, the induced GST activity and the altered abundances of LAP and glyoxalase (GLO) could contribute to maintain the balance of GSH and GSSG, because LAP is involved in the cleavage of cysteinylglycine into glycine and l-cysteine, which is the second step of GSH degradation (44), and GLO I catalyzes the detoxification of methylglyoxal to S-lactoylglutathione utilizing GSH in the GLO system (45). Thus, the dynamic abundance/activity of various antioxidant enzymes implies that POD pathway, PrxR-Trx pathway in chloroplasts, GSH-AsA cycle, GPX pathway, except for CAT pathway, are employed for ROS scavenging during spore germination.
ROS signaling has been reported to cross-talk with plant hormone ethylene during germination of seeds and pollen (46). In this study, we found the abundances of six proteoforms of two ethylene biosynthesis-related enzymes (SAMS and MetS) were changed, four of which were reduced but two were induced during spore germination (Table I, Fig. 9). The homologous gene of SAMS was also induced in RSs stage but reduced later (Figs. 8 and 9). Importantly, we found another two ethylene synthesis-related genes (ACS and ACO) were changed on spore germination. ACS was induced in the stages of RSs and DCSs and reduced in SPCs, and ACO was induced after DCSs stage (Figs. 8 and 9). MetS is responsible for the regeneration of methionine from homocysteine, and SAMS catalyzes the condensation of methionine and ATP to form S-adenosylmethionine (SAM) (47). SAM can be converted to 1-aminocyclopropane-1-carboxylic acid (ACC) through the catalytic activity of ACS, and subsequently ACC is oxidized to ethylene catalyzed by ACO (48). Our results implied that precursors of ethylene biosynthesis were temporally accumulated at the stages of RSs and DCSs, and endogenous biosynthesis of ethylene was enhanced after the DCSs stage. This is consistent with the notion that endogenous ethylene has positive role in seed germination (49). In Arabidopsis seeds, MetS was increased strongly in 1-day imbibed seeds and SAMS was specifically accumulated at the time of radicle protrusion (49). Moreover, exogenous ACC (50 μm) promoted Arabidopsis seed germination under salinity (50). However, early studies have reported that exogenous ethylene partially inhibited the spore germination of fern species C. richardii (51) and O. sensibilis (52). The critical stage of spore germination inhibited by ethylene is prior to nuclear migration and cell division (52), whereas the ethylene inhibition of cell division is attributed to the inhibition of chromatin activity, DNA synthesis, and chromosome replication (46, 53). This implies that exogenous ethylene treatment subsequent to DCSs stage was ineffective in blocking the germination of O. sensibilis spores (52). Consistently, in our results, the ethylene biosynthesis in O. cinnamomea spores was suspected to be enhanced as indicated from the significantly increased expression of ACO after the DCSs stage. The de novo synthesized ethylene in spores would not inhibit the spore germination themselves, but affect other spores in early stages of germination and thus limit overcrowding and competition among prothallia.
Additionally, we found an important protein in BR signaling, BAK, was induced at the stages of RSs and DCSs (Table I, Fig. 9). Moreover, BAK homologous gene was also obviously induced at the stages of RSs, DCSs, and SPCs (Figs. 8 and 9). BRs can enhance pollen germination and tube growth in a dose-dependent manner (54). BR signaling was also proved to be essential for Arabidopsis seed germination (55). In Arabidopsis, BAK1 functions as a positive coreceptor of BR insensitive 1 (a cell surface receptor of BRs) (35). Overexpression of BAK1 resulted in elongated organ phenotypes, whereas a null allele of BAK1 displayed a semidwarf phenotype and has reduced sensitivity to BRs (35). Thus, the consistently increased abundance of BAK with its homologous gene in germinating spores implies that BR signaling is probably involved in spore germination.
Vesicle Trafficking and Cytoskeleton Dynamic are Necessary for Spore Germination
Vesicle trafficking and cytoskeleton dynamic are necessary for the highly polarized cell growth of pollen tubes and root hairs (56). The post-Golgi secretory vesicles (SVs) are transported and accumulated at the extreme tip and fused to a restricted region of PM. They secrete cell wall material and provide new segments for PM formation. In this study, we found a large number of vesicles existed in MSs and germinating spores, and the volume of these vesicles was increased during spore germination. At the stages of GSs and SPCs, spores began to germinate and to form rhizoids. With the rhizoid formation and elongation, numerous small vesicles moved toward the tip regions in rhizoids (Figs. 2 and 3). This suggests that active vesicle trafficking is necessary for the spore germination and rhizoid tip growth. Importantly, we also found two vesicle trafficking-related proteins (vacuolar H+-ATPase (VHA) and MetS) were induced during spore germination. VHA is crucial for maintaining ion and metabolite homeostasis, but also for regulating membrane trafficking. The members of VHAs have been found to be localized in endomembrane system. For example, VHA-a1 is localized to the trans-Golgi network (TGN), whereas VHA-a2 and VHA-a3 are targeted to the vacuolar membrane (57). TGN-located VHA is important for structural integrity of Golgi apparatus and required for maintaining endocytic and secretory traffic (58). In this study, two induced proteoforms of VHA in GSs and SPCs (Table I, Fig. 9) indicated that active membrane secretory and endocytic pathways happened during spore germination. In addition, MetS is a zinc-binding methyl transferase catalyzing the de novo synthesis of methionine. MetS was found to be localized on the surface of tip-focused post-Golgi SVs in tobacco pollen tube, and partially associated with microtubules, suggesting an important role in vesicle trafficking during pollen tube growth (59). In our results, one proteoform of MetSs was induced at the stages of GSs and SPCs (Table I, Fig. 9), which implies a similar function of MetS in germinating fern spore as in pollen tube.
Cytoskeleton dynamic provides the molecular tracks for cytoplasmic streaming and vesicle transporting (60). F-actin forms diversely organized structures at different regions of pollen tube. In the shank, vesicles transport along the long actin cables, and the released vesicles are captured by the highly dynamic subapical actin fringe, which are subsequently fused to the apical PM (61). Similarly, an extensive network of microtubules almost paralleling the actin cytoskeleton can be observed throughout the pollen tube shank cytoplasm. Although microtubules did not appear to have direct roles in supporting the cell polar growth process, the integrity of microtubule system is linked to a properly organized actin cytoskeleton in angiosperm pollen tubes. This suggests the importance of coordination between microtubules and actin cytoskeleton for cytoplasmic streaming and tip growth in gymnosperm pollen tubes (62). Consistent with this, we found actin and tubulin levels increased in GSs and SPCs (Table I, Fig. 9). This indicates that actin filaments and microtubules act cooperatively to maintain the membrane organization and trafficking, support organelles, and SVs movement and positioning during fern rhizoid elongation. In addition, the induced importin α in GSs in our results implies that protein transportation from cytosol to nuclear is enhanced. The candidate proteins with nuclear localization signal in the cytosol can bind to importin α, forming a complex interacting with nuclear membrane protein importin β, and then this trimeric import complex docks to the cytoplasmic face of nuclear pore complex via importin β, subsequently being translocated to nucleoplasmic side (63). It has been found that pollen tube elongation was hampered in the rice importin β1 mutant, which suggests that importin is necessary for protein transportation that affecting pollen tube elongation (64). Thus, the induced importin α in GSs indicates that active protein transportation to nuclear is crucial for specific gene expression for regulating spore germination and rhizoid elongation.
De Novo Protein Synthesis is Necessary for Fern Rhizoid Elongation
Upon germination, pollen grains and fern spores quickly switch from metabolic quiescence to active state. A large amount of substance synthesis is triggered during germination process. Mature pollen grains were found to store presynthesized mRNAs that were required for germination and early tube growth (65). Similarly, both chlorophyllous spores of O. sensibilis and nonchlorophyllous spores from A. phyllitidis, Marsilea vestita, Pteridium aquilinum, and P. vittata can germinate normally in the presence of transcription inhibitor actinomycin D (4, 66–68). Our results showed that, in MSs, some genes exhibited high transcript levels, and the corresponding proteins also showed high expression levels when compared with germinating spores, indicating the mRNAs were stored in MSs. In addition, the tip-growing pollen tubes and generative cell division were dependent on de novo mRNA synthesis after germination (65). It was also proved that newly synthesized mRNAs were not necessary for P. aquilinum spore germination, but were crucial for rhizoid elongation (68). In our results, 21 genes were induced in germinating spores, and most of them exhibited similar trends in abundances of their homologous DEPs (Fig. 8 and Table I). This implies that mRNA synthesis plays key roles in Osmunda germinating spores.
Importantly, protein synthesis, processing, and selective degradation are active in growing fern rhizoid and pollen tube. In our results, several proteoforms of proteins involved in protein synthesis (i.e. eIF4A and translation elongation factor G) and folding (i.e. heat shock protein 70/90, heat shock 70 protein 5, and chaperone GroEL) were induced during spore germination and rhizoid growth (Table I, Fig. 9). In addition, several protein degradation-related proteins (i.e. 20S proteasome and FtsH) were also increased at certain stages of spore germination (Table I, Fig. 9). This is consistent with our previous proteomics analysis of rice pollen, where protein synthesis, processing, and turnover were induced upon pollen tube growth (26). It was also found that pollen tube growth was inhibited significantly by exogenous protein synthesis inhibitor cycloheximide (65). In addition, the activities of proteases and peptidases (endopeptidase, aminopeptidase, and carboxypeptidase) were increased, but the globulin fraction declined rapidly during M. struthiopteris spore imbibition and germination (69, 70). All these indicate that the enhanced protein turnover and mobilization of storage proteins are crucial in the rapid construction of cytoskeleton, membranes and cell wall, as well as other metabolism for rapid growth of rhizoid and pollen tubes.
Protein Function Skew is Different between Germinating Fern Spores and Pollen
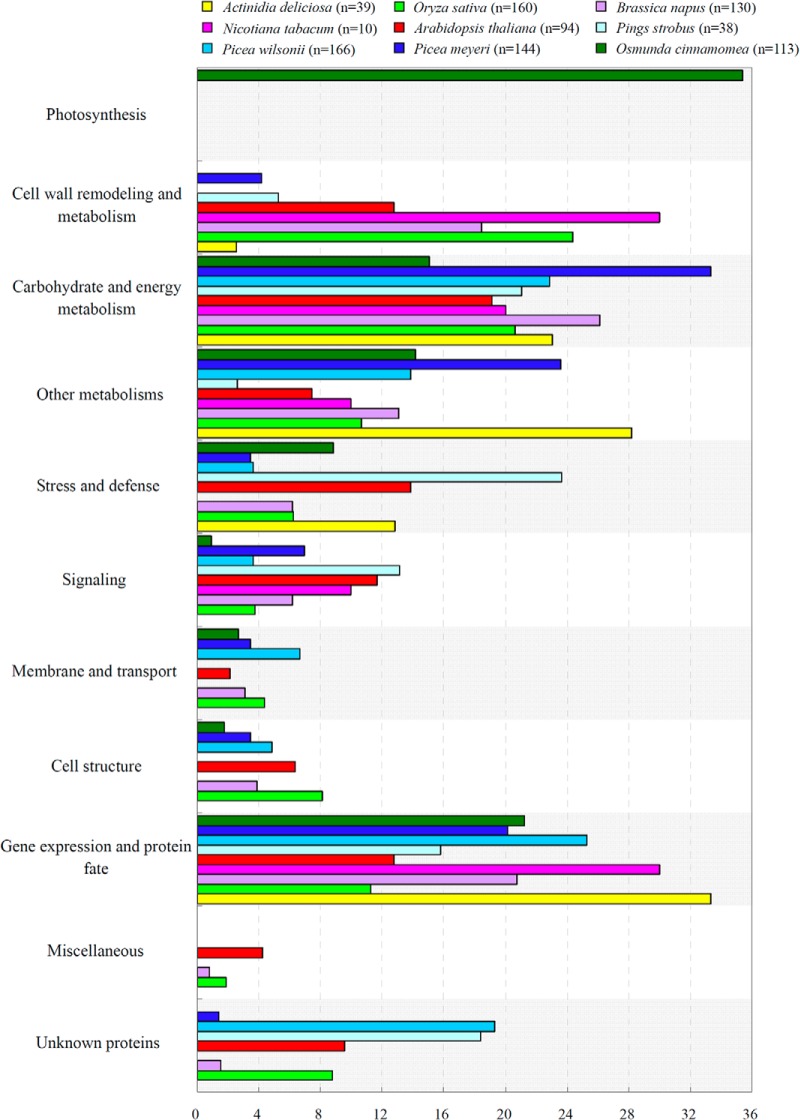
Fern spores and spermatophyte pollen are all generated via meiosis from a sporophyte mother cell in sporangium and anther, respectively, but they differentiated into functional organs of plants during evolution. Although most MSs and mature pollen grains are all metabolically quiescent and enveloped with thick cell wall, their functions in the life cycle are obviously different. Fern spores are initial cell of free-living gametophyte, but pollen grains are highly reduced gametophytes for delivering sperms to the ovaries for fertilization by polarized growth of pollen tubes. Importantly, pollen germination is regulated by the recognition of pollen coat with stigma surface through protein–protein interaction, thus, the pollen coat proteins and the structure and contents of stigma surface have effects on pollen germination. However, the fern spore germination happens in the medium, therefore, it is somewhat more complex and affected by various environmental factors, such as light, gravity, calcium, phytohormone, and temperature (6). The protein functional skew in fern spores and pollen grains revealed from this study and recent proteomics studies on germinating pollen from kiwifruit (Actinidia deliciosa) (71, 72), Nicotiana tabacum (73), rice (Oryza sativa) (26), Brassica napus (74), Pinus strobus (75), Picea meyeri (76, 77), Picea wilsonii (78) and Arabidopsis (79, 80) presented new evidence for the differentiation of fern spores and spermatophyte pollen (Fig. 10). In germinating pollen, the proteins were active in cell wall remodeling, signaling transduction, and cytoskeleton modulation. No photosynthetic proteins were found in pollen. This highlights that the remodeling of pollen tube cell wall, the loosening and hydrolyzing stigma surface cell and transmitting track of pistil, as well as the signaling in pollen tubes tip growth and pollen-stigma interaction are highly induced, whereas the carbohydrate and energy supply is dependent on the storage degradation, but not photosynthesis. However, in germinating chlorophyllous spores, photosynthesis-related proteins accounted for 35% of the DEPs. This illuminates that heterotrophy is crucial for the germination of chlorophyllous spores.
Fig. 10.
Comparison of functional categories of proteins identified from O. cinnamomea L. var. asiatica spores and pollen grains. The data of germinating pollen were summarized and reclassified based on pollen proteomic studies on Oryza sativa (26), Actinidia deliciosa (71, 72), Nicotiana tabacum (73), Brassica napus (74), Pinus strobus (75), Picea meyeri (76, 77), Picea wilsonii (78), and Arabidopsis thaliana (79, 80). The y axis represents the reclassified functional categories, and the x axis shows the percentage of identified proteins.
Concluding Remarks
Plant cell polarity establishment, nucleus migration, and division are fine-tuned and sophisticated cellular processes. Fern spore is a typical single-celled model for studying the comprehensive molecular networks. In this study, we performed the cytological, physiological, and proteomic analyses of O. cinnamomea germinating spores. The cytological features, ROS homeostasis, and expression patterns of genes and proteins in germinating spores revealed the specific molecular mechanisms during the germination of chlorophyllous spores. They include: (1) both heterotrophic and autotrophic metabolisms are triggered for nutrition and energy supplies, (2) ROS and hormone signaling pathways are employed in metabolism regulation, (3) vesicle trafficking and cytoskeleton dynamic are crucial for cell division and tip growth, and (4) de novo protein synthesis is necessary for rhizoid elongation. All these findings have laid a solid foundation for better understanding the complicated molecular networks in single-celled asymmetric division and polar growth.
Supplementary Material
Acknowledgments
We thank Drs. Katherine Tran and Baozhen Shan from Bioinformatics Solutions Inc. for assistance with de novo sequencing of the MS/MS spectra.
Footnotes
Author contributions: S.D. designed research; J.S., Z.Z., J.C., G.L., and S.D. performed research; S.C., X.W., T.W., and C.Y. contributed new reagents or analytic tools; J.S., Q.Z., Z.Z., and S.D. analyzed data; J.S., Q.Z., S.C., and S.D. wrote the paper.
* The project was supported by the National Natural Science Foundation of China (No. 31071194 and No.31270310), Fundamental Research Funds for the Central Universities (No. 2572014EA04), Postdoctoral Science Foundation of China (201104407), Funds for Distinguished Young Scientists of Heilongjiang Province (No. JC201011), and Research Foundation for the Returned Overseas Chinese Scholars, Ministry of Education of China (40-NEFU-01).
 This article contains supplemental Figs. S1 and S2 and Tables S1 to S7.
1 The abbreviations used are:
- DAPI
- 4,6-diamidino-2-phenylindole
- 2-DE
- two-dimensional gel electrophoresis
- ACC
- 1-aminocyclopropane-1-carboxylic acid
- ACO
- aminocyclopropanecarboxylate oxidase
- ACS
- 1-aminocyclopropane-1-carboxylic acid synthase
- APX
- ascorbate peroxidase
- AsA
- ascorbate
- BAK
- brassinosteroid LRR receptor kinase
- BR
- brassinosteroid
- CAT
- catalase
- CRY
- cryptochrome
- DCSs
- double-celled spores
- DEP
- differentially expressed protein
- DHA
- dehydroascorbate
- DHAR
- dehydroascorbate reductase
- eIF4A
- eukaryotic initiation factor 4A
- FtsH
- FtsH protease
- GlnS
- glutamine synthase
- GLO
- glyoxalase
- GPX
- glutathione peroxidase
- GR
- glutathione reductase
- GSA-AT
- glutamate-1-semialdehyde aminotransferase
- GSH
- glutathione
- GSs
- germinated spores
- GSSG
- oxidized glutathione
- GST
- glutathione S-transferase
- IDs
- identities
- LAP
- leucine aminopeptidase
- M6PR
- mannose-6-phosphate reductase
- MDH
- malate dehydrogenase
- MDHA
- monodehydroascorbate
- MDHAR
- monodehydroascorbate reductase
- MetS
- methionine synthase
- Mg-chelatase
- Mg-protoporphyrin IX chelatase
- MS
- mass spectrometry
- MSs
- mature spores
- NO
- nitric oxide
- NQO
- NADH-quinone oxidoreductase
- PHY
- phytochrome
- PM
- plasma membrane
- POD
- peroxidase
- PRK
- phosphoribulokinase
- PSII
- photosystem II
- RBP
- ribulose-1,5-bisphosphate carboxylase large subunit-binding protein
- ROS
- reactive oxygen species
- RSs
- rehydrated spores
- SAM
- S-adenosylmethionine
- SAMS
- S-adenosylmethionine synthetase
- SOD
- superoxide dismutase
- SPCs
- spores with protonemal cells
- SV
- secretory vesicle
- TCA
- tricarboxylic acid
- TGN
- trans-Golgi network
- Trx
- thioredoxin
- UBQ5
- Ubiquitin 5
- VHA
- vacuolar H+-ATPase.
REFERENCES
- 1. Chatterjee A., Porterfield D. M., Smith P. S., Roux S. J. (2000) Gravity-directed calcium current in germinating spores of Ceratopteris richardii. Planta 210, 607–610 [DOI] [PubMed] [Google Scholar]
- 2. Banks J. A. (1999) Gametophyte development in ferns. Annu. Rev. Plant Biol. 50, 163–186 [DOI] [PubMed] [Google Scholar]
- 3. Pettitt J. M. (1979) Ultrastructure and cytochemistry of spore wall morphogenesis. In The Experimental Biology of Ferns, pp. 213–252, Academic Press, London [Google Scholar]
- 4. Raghavan V. (1992) Germination of fern spores. Am. Scientist 80, 176–185 [PubMed] [Google Scholar]
- 5. Edwards E. S., Roux S. J. (1998) Influence of gravity and light on the developmental polarity of Ceratopteris richardii fern spores. Planta 205, 553–560 [DOI] [PubMed] [Google Scholar]
- 6. Suo J. W., Chen S. X., Zhao Q., Shi L., Dai S. J. (2015) Fern spore germination in response to environmental factors. Front. Biol. DOI 10.1007/s11515-015-1342-6 [DOI] [Google Scholar]
- 7. Bushart T. J., Roux S. J. (2007) Conserved features of germination and polarized cell growth: a few insights from a pollen-fern spore comparison. Ann. Bot. 99, 9–17 [DOI] [PMC free article] [PubMed] [Google Scholar]
- 8. Salmi M. L., Bushart T. J., Stout S. C., Roux S. J. (2005) Profile and analysis of gene expression changes during early development in germinating spores of Ceratopteris richardii. Plant Physiol. 138, 1734–1745 [DOI] [PMC free article] [PubMed] [Google Scholar]
- 9. Furuya M., Kanno M., Okamoto H., Fukuda S., Wada M. (1997) Control of mitosis by phytochrome and a blue-light receptor in fern spores. Plant Physiol. 113, 677–683 [DOI] [PMC free article] [PubMed] [Google Scholar]
- 10. Tsuboi H., Nakamura S., Schäfer E., Wada M. (2012) Red light-induced phytochrome relocation into the nucleus in Adiantum capillus-veneris. Mol. Plant 5, 85–92 [DOI] [PubMed] [Google Scholar]
- 11. Suetsugu N., Wada M. (2003) Cryptogam blue-light photoreceptors. Curr. Opin. Plant Biol. 6, 91–96 [DOI] [PubMed] [Google Scholar]
- 12. Kamachi H., Matsunaga E., Noguchi M., Inoue H. (2004) Novel mutant phenotypes of a dark-germinating mutant dkg1 in the fern Ceratopteris richardii. J. Plant Res. 117, 163–170 [DOI] [PubMed] [Google Scholar]
- 13. Salmi M. L., Morris K. E., Roux S. J., Porterfield D. M. (2007) Nitric oxide and cGMP signaling in calcium-dependent development of cell polarity in Ceratopteris richardii. Plant Physiol. 144, 94–104 [DOI] [PMC free article] [PubMed] [Google Scholar]
- 14. Bushart T. J., Cannon A., Clark G., Roux S. J. (2014) Structure and function of CrACA1, the major PM-type Ca2+-ATPase, expressed at the peak of the gravity-directed trans-cell calcium current in spores of the fern Ceratopteris richardii. Plant Biol. 16, 151–157 [DOI] [PubMed] [Google Scholar]
- 15. Clark G. B., Turnwald S., Tirlapur U. K., Haas C. J., von der Mark K., Roux S. J., Scheuerlein R. (1995) Polar distribution of annexin-like proteins during phytochrome-mediated initiation and growth of rhizoids in the ferns Dryopteris and Anemia. Planta 197, 376–384 [DOI] [PubMed] [Google Scholar]
- 16. Huang Q., Li W., Fan R., Chang Y. (2014) New MADS-box gene in fern: cloning and expression analysis of DfMADS1 from Dryopteris fragrans. PloS One 9, e86349. [DOI] [PMC free article] [PubMed] [Google Scholar]
- 17. Shutov A. D., Braun H., Chesnokov Y. V., Bäumlein H. (1998) A gene encoding a vicilin-like protein is specifically expressed in fern spores. Eur. J. Biochemistry 252, 79–89 [DOI] [PubMed] [Google Scholar]
- 18. Gemmrich A. (1979) Isocitrate lyase in germinating spore of the fern Anemia phyllitidis. Phytochemistry 18, 1143–1146 [Google Scholar]
- 19. DeMaggio A. E., Agreen C., Stetler D. (1980) Biochemistry of fern spore germination: glyoxylate and glycolate cycle activity in Onoclea sensibilis L. Plant Physiol. 66, 922–924 [DOI] [PMC free article] [PubMed] [Google Scholar]
- 20. Barker M. S., Wolf P. G. (2010) Unfurling fern biology in the genomics age. Bioscience 60, 177–185 [Google Scholar]
- 21. Chasan R. (1992) Ceratopteris: a model plant for the 90s. Plant Cell 4, 113–115 [DOI] [PMC free article] [PubMed] [Google Scholar]
- 22. Campbell D. H. (1918) The Structure And Development Of Mosses And Ferns (Archegoniatae), 3nd Ed., pp. 299–320, Macmillan, London [Google Scholar]
- 23. Dai S. J., Chen S. X. (2012) Single-cell-type proteomics: toward a holistic understanding of plant function. Mol. Cell. Proteomics 11, 1622–1630 [DOI] [PMC free article] [PubMed] [Google Scholar]
- 24. Gallardo K., Job C., Groot S. P., Puype M., Demol H., Vandekerckhove J., Job D. (2001) Proteomic analysis of Arabidopsis seed germination and priming. Plant Physiol. 126, 835–848 [DOI] [PMC free article] [PubMed] [Google Scholar]
- 25. Dai S. J., Li L., Chen T. T., Chong K., Xue Y. B., Wang T. (2006) Proteomic analyses of Oryza sativa mature pollen reveal novel proteins associated with pollen germination and tube growth. Proteomics 6, 2504–2529 [DOI] [PubMed] [Google Scholar]
- 26. Dai S. J., Chen T. T., Chong K., Xue Y. B., Liu S. Q., Wang T. (2007) Proteomics identification of differentially expressed proteins associated with pollen germination and tube growth reveals characteristics of germinated Oryza sativa pollen. Mol. Cell. Proteomics 6, 207–230 [DOI] [PubMed] [Google Scholar]
- 27. Dai S. J., Wang T., Yan X. F., Chen S. X. (2007) Proteomics of pollen development and germination. J. Proteome Res. 6, 4556–4563 [DOI] [PubMed] [Google Scholar]
- 28. Miernyk J. A., Hajduch M. (2011) Seed proteomics. J. Proteomics 74, 389–400 [DOI] [PubMed] [Google Scholar]
- 29. Tan L. Y., Chen S. X., Wang T., Dai S. J. (2013) Proteomic insights into seed germination in response to environmental factors. Proteomics 13, 1850–1870 [DOI] [PubMed] [Google Scholar]
- 30. Cao J. G., Bao W. M., Dai S. J. (2003) An ultrastructural study of the blepharoplast and the multilayered structure in spermatogenesis in the fern Osmunda cinnamomea var. asiatica. Acta Bot. Sin. 45, 832–842 [Google Scholar]
- 31. Wang X. N., Chen S. X., Zhang H., Shi L., Cao F. L., Guo L. H., Xie Y. M., Wang T., Yan X. F., Dai S. J. (2010) Desiccation tolerance mechanism in resurrection fern-ally Selaginella tamariscina revealed by physiological and proteomic analysis. J. Proteome Res. 9, 6561–6577 [DOI] [PubMed] [Google Scholar]
- 32. Lichtenthaler H. K., Wellburn A. R. (1983) Determination of total carotenoids and chlorophylls a and b of leaf extracts in different solvents. Biochem. Soc. Trans. 11, 591–592 [Google Scholar]
- 33. Yu J. J., Chen S. X., Zhao Q., Wang T., Yang C. P., Diaz C., Sun G. R., Dai S. J. (2011) Physiological and proteomic analysis of salinity tolerance in Puccinellia tenuiflora. J. Proteome Res. 10, 3852–3870 [DOI] [PubMed] [Google Scholar]
- 34. Livak K. J., Schmittgen T. D. (2001) Analysis of relative gene expression data using real-time quantitative PCR and the 2(-Delta Delta C(T)) method. Methods 25, 402–408 [DOI] [PubMed] [Google Scholar]
- 35. Li J., Wen J., Lease K. A., Doke J. T., Tax F. E., Walker J. C. (2002) BAK1, an Arabidopsis LRR receptor-like protein kinase, interacts with BRI1 and modulates brassinosteroid signaling. Cell 110, 213–222 [DOI] [PubMed] [Google Scholar]
- 36. Lloyd R. M., Klekowski E. J. (1970) Spore germination and viability in pteridophyta: evolutionary significance of chlorophyllous spores. Biotropica 2, 129–137 [Google Scholar]
- 37. Okada Y. (1929) Notes on the germination of the spores of some pteridophytes with special regard to their viability. Sci. Rep. Tôhoku Imp. Univ. Ser. IV. Biol. 4, 127–182 [Google Scholar]
- 38. Li Y., Shi L. (2014) Effect of desiccation level and storage temperature on green spore viability of Osmunda japonica. Cryobiology 68, 446–450 [DOI] [PubMed] [Google Scholar]
- 39. DeMaggio A. E., Stetler D. A. (1985) Mobilization of storage reserves during fern spore germination. Proc. R. Soc. Edinburgh 86B, 195–202 [Google Scholar]
- 40. Limami A. M., Rouillon C., Glevarec G., Gallais A., Hirel B. (2002) Genetic and physiological analysis of germination efficiency in maize in relation to nitrogen metabolism reveals the importance of cytosolic glutamine synthetase. Plant Physiol. 130, 1860–1870 [DOI] [PMC free article] [PubMed] [Google Scholar]
- 41. Mohr H., Meyer U., Hartman K. (1964) Effects of phytochrome and photosynthesis on spore germination of ferns (Osmunda cinnamomea L. and O. claytoniana L.). Planta 60, 483–496 [Google Scholar]
- 42. Hagar W. G., Freeberg J. A. (1980) Photosynthetic rates of sporophytes and gametophytes of the fern, Todea barbara. Plant Physiol. 65, 584–586 [DOI] [PMC free article] [PubMed] [Google Scholar]
- 43. Swanson S., Gilroy S. (2010) ROS in plant development. Physiol. Plantarum 138, 384–392 [DOI] [PubMed] [Google Scholar]
- 44. Cappiello M., Lazzarotti A., Buono F., Scaloni A., D'ambrosio C., Amodeo P., Méndez B. L., Pelosi P., Corso A. D., Mura U. (2004) New role for leucyl aminopeptidase in glutathione turnover. Biochem. J. 378, 35–44 [DOI] [PMC free article] [PubMed] [Google Scholar]
- 45. Goggin D. E., Powles S. B., Steadman K. J. (2011) Selection for low or high primary dormancy in Lolium rigidum gaud seeds results in constitutive differences in stress protein expression and peroxidase activity. J. Exp. Bot. 62, 1037–1047 [DOI] [PMC free article] [PubMed] [Google Scholar]
- 46. Corbineau F., Xia Q., Bailly C., El-Maarouf-Bouteau H. (2014) Ethylene, a key factor in the regulation of seed dormancy. Front. Plant Sci. 5, 539. [DOI] [PMC free article] [PubMed] [Google Scholar]
- 47. Yang S. F., Hoffman N. E. (1984) Ethylene biosynthesis and its regulation in higher plants. Ann. Rev. Plant Physiol. 35, 155–189 [Google Scholar]
- 48. Iglesias-Fernández F., Matilla A. J. (2010) Genes involved in ethylene and gibberellins metabolism are required for endosperm-limited germination of Sisymbrium officinale L. seeds. Planta 231, 653–664 [DOI] [PubMed] [Google Scholar]
- 49. Gallardo K., Job C., Groot S. P., Puype M., Demol H., Vandekerckhove J., Job D. (2002) Importance of methionine biosynthesis for Arabidopsis seed germination and seedling growth. Physiol. Plantarum 116, 238–247 [DOI] [PubMed] [Google Scholar]
- 50. Lin Y., Yang L., Paul M., Zu Y., Tang Z. (2013) Ethylene promotes germination of Arabidopsis seed under salinity by decreasing reactive oxygen species: evidence for the involvement of nitric oxide simulated by sodium nitroprusside. Plant Physiol. Biochem. 73, 211–218 [DOI] [PubMed] [Google Scholar]
- 51. Warne T. R., Hickok L. G. (1987) (2-chloroethyl) phosphonic acid promotes germination of immature spores of Ceratopteris richardii Brongn. Plant Physiol. 83, 723–725 [DOI] [PMC free article] [PubMed] [Google Scholar]
- 52. Edwards M. E., Miller J. H. (1972) Growth regulation by ethylene in fern gametophytes. III. Inhibition of spore germination. Amer. J. Bot. 59, 458–465 [Google Scholar]
- 53. Holm R. E., O'Brien T. J., Key L., Cherry J. H. (1970) The influence of auxin and ethylene of chromatin-directed ribonucleic acid synthesis in soybean hypocotyl. Plant Physiol. 45, 41–45 [DOI] [PMC free article] [PubMed] [Google Scholar]
- 54. Vogler F., Schmalzl C., Englhart M., Bircheneder M., Sprunck S. (2014) Brassinosteroids promote Arabidopsis pollen germination and growth. Plant Reprod. 27, 153–167 [DOI] [PubMed] [Google Scholar]
- 55. Steber C. M., McCourt P. (2001) A role for brassinosteroids in germination in Arabidopsis. Plant Physiol. 125, 763–769 [DOI] [PMC free article] [PubMed] [Google Scholar]
- 56. Campanoni P., Blatt M. R. (2007) Membrane trafficking and polar growth in root hairs and pollen tubes. J. Exp. Bot. 58, 65–74 [DOI] [PubMed] [Google Scholar]
- 57. Schumacher K., Krebs M. (2010) The V-ATPase: small cargo, large effects. Curr. Opin. Plant Boil. 13, 724–730 [DOI] [PubMed] [Google Scholar]
- 58. Šamaj J., Müller J., Beck M., Böhm N., Menzel D. (2006) Vesicular trafficking, cytoskeleton and signaling in root hairs and pollen tubes. Trends Plant Sci. 11, 594–600 [DOI] [PubMed] [Google Scholar]
- 59. Moscatelli A., Scali M., Prescianotto-Baschong C., Ferro M., Garin J., Vignani R., Ciampolini F., Cresti M. (2005) A methionine synthase homolog is associated with secretory vesicles in tobacco pollen tubes. Planta 221, 776–789 [DOI] [PubMed] [Google Scholar]
- 60. Cai G., Moscatelli A., Cresti M. (1997) Cytoskeletal organization and pollen tube growth. Trends Plant Sci. 2, 86–91 [Google Scholar]
- 61. Guan Y. F., Guo J. Z., Li H., Yang Z. B. (2013) Signaling in pollen tube growth: crosstalk, feedback, and missing links. Mol. Plant 6, 1053–1064 [DOI] [PMC free article] [PubMed] [Google Scholar]
- 62. Cheung A. Y., Duan Q. H., Costa S. S., de Graaf B. H., Di Stilio V. S., Feijo J., Wu H. M. (2008) The dynamic pollen tube cytoskeleton: live cell studies using actin-binding and microtubule-binding reporter proteins. Mol. plant 1, 686–702 [DOI] [PubMed] [Google Scholar]
- 63. Görlich D. (1997) Nuclear protein import. Curr. Opin. Cell Boil. 9, 412–419 [DOI] [PubMed] [Google Scholar]
- 64. Han M. J., Jung K. H., Yi G., An G. (2011) Rice importin β1 gene affects pollen tube elongation. Mol. Cells 31, 523–530 [DOI] [PMC free article] [PubMed] [Google Scholar]
- 65. Mascarenhas J. P. (1993) Molecular mechanisms of pollen tube growth and differentiation. Plant Cell 5, 1303–1314 [DOI] [PMC free article] [PubMed] [Google Scholar]
- 66. Kuligowski J., Ferrand M., Chenou E. (1991) Stored mRNA in early embryos of a fern Marsilea vestita: a paternal and maternal origin. Mol. Reprod. Dev. 30, 27–33 [DOI] [PubMed] [Google Scholar]
- 67. Raghavan V. (1977) Cell morphogenesis and macromolecule synthesis during phytochrome-controlled germination of spores of the fern, Pteris vittata. J. Exp. Bot. 28, 439–456 [Google Scholar]
- 68. Raghavan V. (1991) Gene activity during germination of spores of the fern, Onoclea sensibilis: RNA and protein synthesis and the role of stored mRNA. J. Exp. Bot. 42, 251–260 [DOI] [PubMed] [Google Scholar]
- 69. Cohen H. P., DeMaggio A. E. (1986) Biochemistry of fern spore germination: protease activity in ostrich fern spores. Plant Physiol. 80, 992–996 [DOI] [PMC free article] [PubMed] [Google Scholar]
- 70. Templeman T. S., DeMaggio A. E., Stetler D. A. (1987) Biochemistry of fern spore germination: globulin storage proteins in Matteuccia struthiopteris L. Plant Physiol. 85, 343–349 [DOI] [PMC free article] [PubMed] [Google Scholar]
- 71. Vannini C., Domingo G., Marsoni M., Bracale M., Sestili S., Ficcadenti N., Speranza A., Crinelli R., Carloni E., Scoccianti V. (2011) Proteomic changes and molecular effects associated with Cr (III) and Cr (VI) treatments on germinating kiwifruit pollen. Phytochemistry 72, 1786–1795 [DOI] [PubMed] [Google Scholar]
- 72. Vannini C., Bracale M., Crinelli R., Marconi V., Campomenosi P., Marsoni M., Scoccianti V. (2014) Proteomic analysis of MG132-treated germinating pollen reveals expression signatures associated with proteasome inhibition. PloS One 9, e108811. [DOI] [PMC free article] [PubMed] [Google Scholar]
- 73. Fíla J., Matros A., Radau S., Zahedi R. P., Čapková V., Mock H. P., Honys D. (2012) Revealing phosphoproteins playing role in tobacco pollen activated in vitro. Proteomics 12, 3229–3250 [DOI] [PubMed] [Google Scholar]
- 74. Sheoran I. S., Pedersen E. J., Ross A. R., Sawhney V. K. (2009) Dynamics of protein expression during pollen germination in canola (Brassica napus). Planta 230, 779–793 [DOI] [PubMed] [Google Scholar]
- 75. Fernando D. D. (2005) Characterization of pollen tube development in Pinus strobus (Eastern white pine) through proteomic analysis of differentially expressed proteins. Proteomics 5, 4917–4926 [DOI] [PubMed] [Google Scholar]
- 76. Chen Y., Chen T., Shen S., Zheng M., Guo Y., Lin J., Baluska F., Samaj J. (2006) Differential display proteomic analysis of Picea meyeri pollen germination and pollen-tube growth after inhibition of actin polymerization by latrunculin. B. Plant J. 47, 174–195 [DOI] [PubMed] [Google Scholar]
- 77. Chen T., Wu X., Chen Y., Li X., Huang M., Zheng M., Balusska F., Samaj J., Lin J. (2009) Combined proteomic and cytological analysis of Ca2+-calmodulin regulation in Picea meyeri pollen tube growth. Plant Physiol. 149, 1111–1126 [DOI] [PMC free article] [PubMed] [Google Scholar]
- 78. Chen Y., Liu P., Hoehenwarter W., Lin J. (2012) Proteomic and phosphoproteomic analysis of Picea wilsonii pollen development under nutrient limitation. J. Proteome Res. 11, 4180–4190 [DOI] [PubMed] [Google Scholar]
- 79. Zou J., Song L., Zhang W., Wang Y., Ruan S., Wu W. H. (2009) Comparative proteomic analysis of Arabidopsis mature pollen and germinated pollen. J. Integr. Plant Biol. 51, 438–455 [DOI] [PubMed] [Google Scholar]
- 80. Ge W., Song Y., Zhang C., Zhang Y., Burlingame A. L., Guo Y. (2011) Proteomic analyses of apoplastic proteins from germinating Arabidopsis thaliana pollen. Biochim. Biophys. Acta 1814, 1964–1973 [DOI] [PMC free article] [PubMed] [Google Scholar]
Associated Data
This section collects any data citations, data availability statements, or supplementary materials included in this article.


